1014
Clustering Student Data Based On K-Means
Algorithms
Khoiriyatus Sya’iyah, Herman Yuliansyah, Ika Arfiani
Abstract— Educational data mining is interesting research always to discuss. Student data has the potential to be further processed and provide results for other uses. By grouping student data, the educational institution will get useful potential knowledge. The methodology in this research divided into five steps, i.e., data cleaning, data selection, data transformation, clustering using K-Means Algorithms, and knowledge presentation. We split the cluster of student data into three groups. It is because we want to get characteristic of the student with excellent performance, standard performance, and underperformance. We use 724 student data and four variables, i.e., Grade Point Average (GPA), length of study (LS), English proficiency score (EP), and length of thesis working (LT). The results of this research are the three characteristics of the student, i.e., the students in cluster 1 have 3.28 scale 4 for GPA, 4.52 years for LS, scores 404 for EP, and 7.46 month for LT. The students in cluster 2 have 3.29 scale 4 for GPA, 4.48 years for LS, scores 481 for EP, and 7.26 month for LT. The students in cluster 3 have 3.31 scale 4 for GPA, 4.50 years for LS, scores 437 for EP, and 7.14 month for LT.
Index Terms— Data Mining, Clustering, K-Means Algorithms, Student Data, Student Performance, Educational.
—————————— ——————————
1 I
NTRODUCTION Evaluation student performance is an interesting problem to solve by using the data mining approach. Data mining also has essential roles in the education system[1] besides other fields[2][3]. Several researchers have analysed student performance based on historical data. Data mining uses to evaluate the factor that affects student performance and find and evaluate for future result[4]. Data mining makes it possible to improve educational quality and process[5]. By using data mining, educational organizations can find interesting patterns[6] and knowledge[7] and can improve the effectiveness of academic performances[8]. The experience is fundamental to solve pedagogical challenges and to define models in teaching and learning[9]. The final achievement is satisfaction levels toward course and instructor[10].The benefits of evaluating student performance are to reduce risk education like drop-out student [11][12][13][14], to increase new student[15], analysis study duration[16] and so on. Besides the evaluation, data mining also can increase the success rate and student retention[17] and final achievement status upon graduation[18][19].
Every education institution has many ways of learning and understanding their student data. But most of the educational institutions only use simple techniques to analyse the student data like find the average number of Grade Point Average (GPA), the number of graduation, failed ratio, and percentage of study duration. Besides the simple techniques, educational institutions also only save the data into databases or files. This situation has the challenge to optimise the data by utilising using data mining. However, these data have not optimised to analyse to become useful knowledge. This optimised data is a compelling case because data mining can become observer several data types and information storages. Then analyse the
data uses a few method/algorithm to solve the question and mine the hidden knowledge to be meaningful knowledge.
There are many data mining technique that can implement in this case, i.e., association rules mining, classification, clustering and prediction. In this article, we are interested in discuses the data mining analysis using clustering. Clustering technique has success implement in many fields[20][21].
Many variable data can analyse to get new knowledge in student evaluation. In this, we want to identify cluster correlation between the variable of Grade Point Average (GPA), length of study duration, length of thesis duration, and English proficiency score. The main goal of this identifies student characteristic in every cluster student. We split the cluster of student data into three groups. It is because we want to get the aspect of the student with excellent performance, standard performance, and underperformance. By grouping student data, the educational institution will get useful potential knowledge.
Several researchers have been discussing the clustering implementation in educational data. Islam[22] present a hybrid procedure based on the Decision Tree and Data Clustering. This hybrid procedure enables academicians to predict the student‘s GPA. The instructor can take a necessary step to improve student academic performance Keywords based on the result of the hybrid procedure. Morais [9] defines the prediction using a regression methodology, and clustering using K-means algorithm. The behaviours of students on each cluster are the objective of prediction.
Singh[23] analysed student performance base on the admission and placement process. Various factors help in understanding the overall student performance. Paul[24] has examined student performance in several core subjects of the course. The core of his items come from difference competency components types such as presentation, assignment, quiz, case-study, and so on. The experiment result shows cluster quality has proved to find patterns for student performance. Paul[25] also identify the course objectives achieved by analysing the performance of the student in several courses ————————————————
Khoiriyatus Sya’iyah, Informatics Department, Universitas Ahmad
Dahlan, Indonesia.
Herman Yuliansyah, Informatics Department, Universitas Ahmad Dahlan.
E-mail: [email protected] (Corresponding Author)
Ika Arfiani, Informatics Department, Universitas Ahmad Dahlan,
using competencies as the criteria for assessment.
Aghababyan[26] develop interpretable students clusters based on student confidence entropy, over/underconfidence degree, and related variables. Yadav[27] proposed a new hybrid clustering approach based on integrated techniques of Subtractive and Fuzzy C-Means clustering methods. The clusters are the basis of the intelligence students level.
This article organised in four sections: Section 1 is the introduction, section 2 is methodology, section 3 is result and discussion, and section 4 is conclusions.
2
M
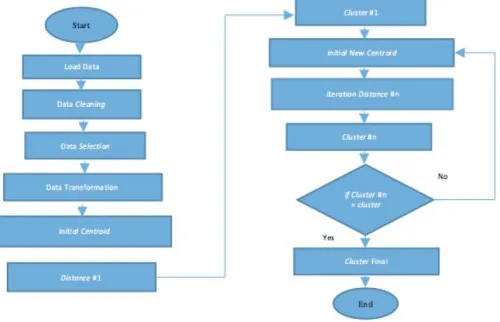
ETHODOLOGYFigure 1 shows the methodology to cluster the student data in this research.
Figure 1 Methodology to cluster the student data Figure 1 shows several steps to analyse the cluster data of student, i.e.:
1. Dataset
Dataset is a collection of the data source used in cluster analysis. This data comes from private educational data as sample data.
2. Load data
To do clustering, we developed a web application using python programming. This step is to upload the data set to the application.
3. Data cleaning
Data cleaning removed the noise data or invalid data. 4. Data transformation
The data transform implemented with calculating subtraction between Registration Date and Graduation Date.
5. Data selection
Data selection chose the variable data that use in cluster based on nine attributes available. This research uses four variables, i.e., Grade Point Average (GPA), length of study (LS), English proficiency score (EP), and length of thesis working (LT).
6. Clustering
First steps in clustering data using K-Mean algorithms are initial the centroid. This centroid use to calculate the distance between the data and the centroid by
cluster every row data. After all of the data clustered, calculate the average data every variable and every cluster. If the average data every variable not equal with centroid value, then need to iterate to repeat distance calculation until average data every variable same with centroid value.
3 R
ESULTSA
NDD
ISCUSSIONSThe data analysis process divided into three stages: 1) Preprocessing Data, 2) Data Mining, and 3) Knowledge Visualization.
3.1 Dataset
The dataset from a private educational institution contain 724-row data with eight variables, i.e., Student Number (SN), Name, Department (Dept), Length of Thesis Working (LT), Registration Date (RD), Graduation Date (GD), Grade Point Average (GPA), and English Proficiency Score (EP). Figure 2 shows the dataset collection.
Table 1 Dataset Data
row SN Dept (Month) LT RD GD GPA EP
1 08018001 Inf 13.6 2008-09-08 2014-02-17 2.92 406
2 08018003 Inf 6.8 2008-09-08 2012-12-22 3.53 400
3 08018004 Inf 4.83 2008-09-08 2013-01-05 3.44 403
… … … ... …
723 1400018238 Inf 2.8 2014-09-01 2018-06-28 3.68 430
724 1400018243 Inf 2.8 2014-09-01 2018-06-28 3.63 413
3.2 Load Data
This research not only analyses the student data clustering but also develop a web application, so the user can continue using the app for other data in the future. After data preparation in Table 1 saved in the spreadsheet file, the dataset can upload to the web application. Figure 4 shows the upload process and all of the data read by web application the store in databases and ready to analyse.
1016 3.3 Data Cleaning
The data has potential noise or invalid value. To prevent this condition, the data must clean to remove the inconsistent data. Figure 3 shows the data cleaning process. The web application has given several rules to do the cleaning process. The users click the button, and the web application will finish the cleaning process.
Figure 3 Data Cleaning
3.4 Data Selection
The data selection is a process to choose the variable that will use in the clustering process. From eight variables are available, only five variable that will select in this clustering process. The five variables are Length of Thesis Working, Registration Date, Graduation Date, Grade Point Average, and English Proficiency Score. The variable like Student Number, Name, and Department removed. It is because the data does not need to cluster process. Figure 4 shows the data result in the data selection process.
Figure 4 Data Selection
3.4 Data Transformation
The data transform uses to transform the subtraction calculation between Registration Date and Graduation Date. The purpose of this step is to change the subtraction date into years. So, it can use as a variable in the cluster. Figure 5 shows the transformation process. The web will automatically count the subtraction date and store into the database before the clustering process.
Figure 5 Data Transformation
3.6 Clustering Result
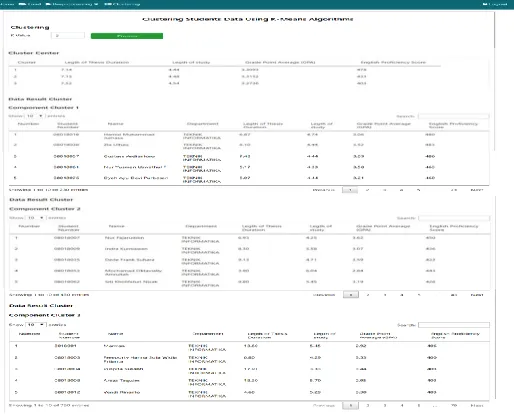
The process starts by determines the number of clusters. The web application has developed in the dynamic number of cluster. It depends on the users to determine the number of clusters, but in this research, the number of clusters is three. It is because the results expected show the profile of a student with criteria excellent performance, standard performance, and underperformance.
The web application also does not need to determine the initial value of the centroid. It is because the web application generates the initial centroid values automatically. The iterative process of clustering will be done in the background process. I will make it easier for users to use web applications. Figure 6 shows the cluster process and cluster results.
Figure 6 Cluster Results
4 C
ONCLUSIONSThis study concludes that we have successfully grouped the data with the K-Means algorithm and obtained three groups of data. The three data groups are the students in cluster 1 have 3.28 scale 4 for GPA, 4.52 years for LS, scores 404 for EP, and 7.46 month for LT. The students in cluster 2 have 3.29 scale 4 for GPA, 4.48 years for LS, scores 481 for EP, and 7.26 month for LT. The students in cluster 3 have 3.31 scale 4 for GPA, 4.50 years for LS, scores 437 for EP, and 7.14 month for LT. We have also developed applications to group this data with web applications.
However, we also found that the results of grouping data that had been carried out had an adjacent centre point so that it could not represent the characteristics of the students who want to search. We predict that the amount of data we use is too small and needs to evaluate the distribution of the data. This improvement will be to work in the future of our research.
A
CKNOWLEDGMENTUniversitas Ahmad Dahlan supports this research in the research scheme Competitive Research Grant (Penelitian Hibah Bersaing/PHB) with grant No: PHB-073/SP3/LPPM-UAD/IV/2019 on 08 April 2019.
R
EFERENCES[1] B. R.B, ―‗Importance of Data Mining in Higher Education System,‘‖ IOSR J. Humanit. Soc. Sci., 2013. [2] S. Winiarti, H. Yuliansyah, and A. A. Purnama,
―Identification of Toddlers‘ Nutritional Status using Data Mining Approach,‖ Int. J. Adv. Comput. Sci. Appl., vol. 9, no. 1, pp. 164–169, 2018.
[3] I. Riadi, S. Winiarti, and H. Yuliansyah, ―Development and Evaluation of Android Based Notification System to Determine Patient ‘ s Medicine for Pharmaceutical Clinic,‖ 2017 4th Int. Conf. Electr. Eng. Comput. Sci. Informatics, no. September, pp. 19–21, 2017.
[4] K. Kohli and S. Birla, ―Data Mining on Student Database to Improve Future Performance,‖ Int. J. Comput. Appl., 2016.
[5] R. Asif, A. Merceron, S. A. Ali, and N. G. Haider, ―Analyzing undergraduate students‘ performance using educational data mining,‖ Comput. Educ., 2017. [6] S. K. Verma, R. S. Thakur, and S. Jaloree, ―Fuzzy
association rule mining based model to predict students‘ performance,‖ Int. J. Electr. Comput. Eng., vol. 7, no. 4, pp. 2223–2231, 2017.
[7] A. Abu, ―Educational Data Mining & Students‘ Performance Prediction,‖ Int. J. Adv. Comput. Sci. Appl., 2016.
[8] M. Anoopkumar and A. M. J. Md Zubair Rahman, ―A Review on Data Mining techniques and factors used in Educational Data Mining to predict student amelioration,‖ in Proceedings of 2016 International Conference on Data Mining and Advanced Computing, SAPIENCE 2016, 2016.
―Monitoring student performance using data clustering and predictive modelling,‖ in Proceedings - Frontiers in Education Conference, FIE, 2015.
[10] J. L. Hung, Y. C. Hsu, and K. Rice, ―Integrating data mining in program evaluation of K-12 online education,‖ Educ. Technol. Soc., 2012.
[11] P. Paruechanon and W. Sriurai, ―Applying association rule to risk analysis for student-dropout in Information Technology Program,‖ J. Sci. Sci. Educ., vol. 1, no. 2, pp. 123–133, 2018.
[12] B. Pérez, C. Castellanos, and D. Correal, ―Predicting student drop-out rates using data mining techniques: A case study,‖ in Communications in Computer and Information Science, 2018.
[13] B. Perez, C. Castellanos, and D. Correal, ―Applying Data Mining Techniques to Predict Student Dropout: A Case Study,‖ in 2018 IEEE 1st Colombian Conference on Applications in Computational Intelligence, ColCACI 2018 - Proceedings, 2018. [14] B. Mahatthanachai, H. Ninsonti, and N. Tantranont,
―A Study of Factors Influency Student Dropout Rate Using Data Mining,‖ Golden Teak Humanit. Soc. Sci. J., vol. 22, no. 4, pp. 46–55, 2016.
[15] N. Chaimongkol and P. Meesad, ―Association Rule Mining for Specific New Course,‖ J. Inf. Sci. Technol., vol. 1, no. 1, pp. 15–22, Jun. 2010.
[16] P. Belsis, I. Chalaris, M. Chalaris, C. Skourlas, and A. Tsolakidis, ―The Analysis of the Length of Studies in Higher Education based on Clustering and the Extraction of Association Rules,‖ Procedia - Soc. Behav. Sci., vol. 147, pp. 567–575, 2014.
[17] T. Mishra, D. Kumar, and S. Gupta, ―Mining students‘ data for prediction performance,‖ in International
Conference on Advanced Computing and
Communication Technologies, ACCT, 2014.
[18] E. N. Ogor, ―Student academic performance monitoring and evaluation using data mining techniques,‖ in Electronics, Robotics and Automotive Mechanics Conference, CERMA 2007 - Proceedings, 2007.
[19] R. Bansal, A. Mishra, and S. N. Singh, ―Mining of educational data for analysing students‘ overall performance,‖ in Proceedings of the 7th International Conference Confluence 2017 on Cloud Computing, Data Science and Engineering, 2017.
[20] S. Winiarti, S. Kusumadewi, I. Muhimmah, and H. Yuliansyah, ―Determining the nutrition of patient based on food packaging product using fuzzy C means algorithm,‖ in 2017 4th International Conference on Electrical Engineering, Computer Science and Informatics (EECSI), 2017, pp. 1–6.
[21] M. Phanich, P. Pholkul, and S. Phimoltares, ―Food Recommendation System Using Clustering Analysis for Diabetic Patients,‖ 2010 Int. Conf. Inf. Sci. Appl., pp. 1–8, 2010.
1018 Comput. Sci. Appl., 2013.
[23] I. Singh, A. S. Sabitha, and A. Bansal, ―Student performance analysis using clustering algorithm,‖ in Proceedings of the 2016 6th International Conference - Cloud System and Big Data Engineering, Confluence 2016, 2016.
[24] D. V. Paul, C. Nayagam, and J. D. Pawar, ―Modeling Academic Performance using Subspace Clustering Algorithm,‖ in Proceedings - IEEE 8th International Conference on Technology for Education, T4E 2016, 2017.
[25] D. V. Paul and C. S. Nayagam, ―Use of Subspace Clustering Algorithm for Students‘ Competency and Subject Knowledge Assessment,‖ Int. J. Knowl. Syst. Sci., 2018.
[26] A. Aghababyan, N. Lewkow, and R. S. Baker, ―Enhancing the Clustering of Student Performance Using the Variation in Confidence,‖ in Lecture Notes in Computer Science (including subseries Lecture Notes in Artificial Intelligence and Lecture Notes in Bioinformatics), 2018, pp. 274–279.