Journal of Healthcare Leadership 2016:8 41–50
Journal of Healthcare Leadership
Dove
press
submit your manuscript | www.dovepress.com 41
O R I G I N A L R E S E A R C H open access to scientific and medical research
Open Access Full Text Article
Improving surgeon utilization in an orthopedic
department using simulation modeling
Yusta W Simwita Berit I Helgheim
Department of Logistics, Molde University College, Molde, Norway
Purpose: Worldwide more than two billion people lack appropriate access to surgical services due to mismatch between existing human resource and patient demands. Improving utilization of existing workforce capacity can reduce the existing gap between surgical demand and avail-able workforce capacity. In this paper, the authors use discrete event simulation to explore the care process at an orthopedic department. Our main focus is improving utilization of surgeons while minimizing patient wait time.
Methods: The authors collaborated with orthopedic department personnel to map the current operations of orthopedic care process in order to identify factors that influence poor surgeons uti-lization and high patient waiting time. The authors used an observational approach to collect data. The developed model was validated by comparing the simulation output with the actual patient data that were collected from the studied orthopedic care process. The authors developed a proposal scenario to show how to improve surgeon utilization.
Results: The simulation results showed that if ancillary services could be performed before the start of clinic examination services, the orthopedic care process could be highly improved. That is, improved surgeon utilization and reduced patient waiting time. Simulation results demonstrate that with improved surgeon utilizations, up to 55% increase of future demand can be accommodated without patients reaching current waiting time at this clinic, thus, improving patient access to health care services.
Conclusion: This study shows how simulation modeling can be used to improve health care processes. This study was limited to a single care process; however the findings can be applied to improve other orthopedic care process with similar operational characteristics.
Keywords: waiting time, patient, health care process
Introduction
Despite significant technological and medical advances, critical shortage in health work-force poses key constraints in health care service delivery.1–3 This problem is more critical
in the field of surgery as more than two billion people worldwide lack access to surgery services.4,5 Funk et al5 noted that rising constraints on the availability of human resources,
inadequate surgical facilities, and poor infrastructures are the main problems associated with inadequate surgical treatment service. Thus, to meet increasing surgical demand and needs, healthcare providers must learn to better utilize existing workforce capacity. This can be achieved by applying operational management tools such as simulation to explore patient care processes in order to improve utilization of existing resources and patient care delivery processes.6–9
Correspondence: Yusta W Simwita Department of Logistics, Molde University College, Britvegen 2, 6410 Molde, Norway
Tel +47 71 195 785
Email [email protected]
Journal name: Journal of Healthcare Leadership Article Designation: ORIGINAL RESEARCH Year: 2016
Volume: 8
Running head verso: Simwita and Helgheim
Running head recto: Improving surgeon utilization in an orthopedic department DOI: http://dx.doi.org/10.2147/JHL.S112856
Journal of Healthcare Leadership downloaded from https://www.dovepress.com/ by 118.70.13.36 on 24-Aug-2020
For personal use only.
This article was published in the following Dove Press journal: Journal of Healthcare Leadership
5 October 2016
Dovepress
Simwita and Helgheim
In spite of the growing number of academic research on the patient care process, time-related studies focus mainly on wait time or the duration of individual medical procedures in the care process, thus lacking a total, holistic view of the patient care process.10,11 In order to facilitate increased
access to care services through better utilization of existing workforce capacity, a holistic view of the process should be taken into consideration. This paper aims to fill part of this gap by using a discrete event simulation model to explore the patient treatment process and investigate how to improve surgeon utilization without adding extra resources. This objective will be achieved by first, using simulation model to explore and identify factors that influence poor surgeon utilization and high patient waiting time. Second, suggesting and testing a proposal scenario that can be used to improve surgeon utilization and reduce patient waiting time. And lastly, investigating to what extent the improved process can accommodate future increasing demand.
The remainder of this paper is organized as follows: The second section presents the literature review, and the third section presents the description of orthopedic department and its workforce capacity problem. The fourth section presents data collection and the methodology used for simulation model development. The fifth section presents the proposal scenario suggested to improve utilization of surgeons and decrease patient wait time. The modeling results are presented in section six. The seventh section pres-ents a discussion of the simulation results, followed by the managerial implication and conclusion in the last Section.
Literature review
Health care resources have become increasingly scarce and expensive, thus placing greater emphasis on better utilization of resources to improve health services. One of the major operational issues in health care delivery sys-tems involves maximizing resource utilization goals while minimizing patient wait times. Simulations have proven their capability and viability as a technique for improving resource utilization and reducing patient wait time.7,12,13 This
has led to a number of simulation studies being carried out on orthopedic care processes.
Bowers and Mould14 conducted a study in orthopedic
trauma theaters to explore the balance between maximiz-ing the utilization of operatmaximiz-ing room sessions and ensurmaximiz-ing improved throughput. They found that a willingness on the part of elective patients to postpone their treatments could result in achieving greater throughputs. Bowers and Mould15
adopted simulations to explore the potential for increased
efficiency with an increased volume of nonelective patients in an orthopedic department. They found that the concentra-tion of nonelective activity could offer potential savings in terms of the theater time allocated for trauma cases. Meer et al16 conducted a study in an orthopedic department using a
series of projects. The goal was to give their clients a better understanding of the reason for increased patient wait times.
Baril et al17 studied the relationships and interactions
among patient flows, resource capacities, and appointment scheduling rules in order to improve an orthopedic outpatient clinic. They found that in order to improve the outpatient orthopedic clinic’s performance, resources and appoint-ment scheduling rules must be applied to the various patient flows. Bowers and Mould18 used a simulation to explore the
balance between maximizing orthopedic theater utilization, minimizing the number of overruns, and ensuring high qual-ity during theater sessions. They suggested that including deferred, elective patients in trauma theater sessions has the potential to generate excess theater capacity using existing resources. Steins et al9 deployed discrete event simulation
to explore how various management policies affect various performance metrics, such as patient waiting time, cancel-lations, and the utilization of orthopedic theater time. They noted that the performance of an operating room department can be significantly improved by utilizing policies that focus on reserving operating room capacity.
Despite the wide application of simulations on health care processes, the literature points out that application of simula-tion in healthcare is still at an embryonic stage.19,20 And this
is evidenced by the above reviewed literature as most of them have focused on using simulation to either reduce patient wait-ing time or improve resource utilization. This study extends this line of research by considering not only patient wait time and resource utilizations but also exploring the extent to which this department can accommodate future increasing demand as a result of process improvement. In this paper, the authors use discrete event simulation to explore on how to improve surgeon utilization while minimizing patient wait time from when the patient arrives to the point of discharge. Here, surgeon utiliza-tion is defined as the proporutiliza-tion of time in which orthopedic surgeons are busy with patient examination and treatment.
Description of orthopedic
department
This study was approved by Research and Ethics commit-tee (REC) of Catholic University of Health and Allied Sciences and Bugando Medical Centre (CUHAS/BMC). Patient written consent was not necessary because this
Journal of Healthcare Leadership downloaded from https://www.dovepress.com/ by 118.70.13.36 on 24-Aug-2020
Dovepress Improving surgeon utilization in an orthopedic department
was a process improvement study and no single medical or personal information from the patient was taken. Data col-lection was anonymous. The authors conducted this study at Bugando referral hospital, one of the four teaching and consultant hospitals in Tanzania. It serves mainly the Lake and Western zones of the United Republic of Tanzania. The Bugando hospital is located along the shores of Lake Victoria in Mwanza City. This 900-bed hospital has ~1,000 employees. The Bugando hospital is a referral hospital for tertiary spe-cialist care serving eight regions: Kigoma, Mwanza, Kagera, Tabora, Shinyanga, Simiyu, Geita, and Mara. This hospital serves a population of ~13 million people.
The orthopedic department of this hospital was experienc-ing workforce capacity challenges. Specifically, its existexperienc-ing surgeon capacity was facing an increase of demand for orthopedic care services and high patient wait times. Hospital management noticed that process improvement was neces-sary for this department. Improving utilization of existing surgeon capacity, without adding extra resources, was one of the improvement initiative proposed to enhance this care process. The management of this hospital was concerned with finding a better way of utilizing the current limited number of surgeons in order to reduce patient wait times and increase patient access to care. The main interest was on identifying factors causing the poor utilization of surgeons and the strat-egy or actions that can be used to improve surgeon utilization, reduce patient wait times, and increase patient access to care.
Orthopedic department resources
Bugando hospital has four specialized orthopedic surgeons and five operational theaters for both elective and emergency patients. Orthopedic surgeons are allocated only two rooms, operating on Monday, Wednesday, and Friday, with two sur-geons per day. The total capacity for the allocated 3 days in the operating theater is six rooms per week. On the clinic side, orthopedic surgeons attend to patients on Tuesday and Wednes-day, with two surgeons per day. The orthopedic clinic has three nurses who guide and take patients to surgeons for examina-tions. Bugando hospital also has a central laboratory and an X-ray section, which serve the entire hospital community.
Describing process operations
In order to understand and map the entire orthopedic care process, the authors held interviews with orthopedic sur-geons, heads of departments related to orthopedic care (lab, X-ray, registrations, and the orthopedic ward), and hospital management. To increase model validity and credibility, the authors involved key surgeons at the orthopedic clinic and the head of operating room during conceptual model
development. To gain more insight into the orthopedic care process, the authors held unstructured discussions with nurses and patients attending the orthopedic clinic. The entire patient orthopedic care process is described below.
Upon arrival at the hospital patient starts first at the reg-istration department where individual patient information is collected as well as any associated treatment charges if needed. It is common for patients to arrive at the registration department from six in the morning, even though registra-tions start from seven and clinic services start from eight in the morning. Patients are allowed to drop off their informa-tion cards at the registrainforma-tion counter, which are used by the registration personnel to collect patient information for reg-istration purposes. The regreg-istration counter sometimes opens before seven to allow early arrival patients to drop off their information cards. Being the sole registration department for the entire hospital, this approach helps the registration personnel to successfully accommodate the high volume of patients attending this department. When the registration process is complete, patients are directed to their respective clinics: orthopedic clinic in this case.
After their arrival at the orthopedic clinic, patients are required to wait for the examination activities to start, includ-ing the arrival of the orthopedic surgeons. Although there is no clear reason as to why some patients tend to arrive early in the morning before the start of clinical services, it is probably due to the high volume of patients attending this hospital per day. Thus, some patients would prefer to arrive early in the morning so that they can receive treatment before the queues for health care providers pile up. Occasionally, nurses at this clinic arrive early, though not necessarily an hour earlier, and upon their arrival help patients with administrative issues before the surgeons arrive. This might be due to the high number of patients attending this clinic. Sometimes, the surgeons arrive 15–45 minutes after the clinic has opened due to other duties at the hospital. When the surgeons arrive at the clinic, the nurses escort patients to the examination rooms.
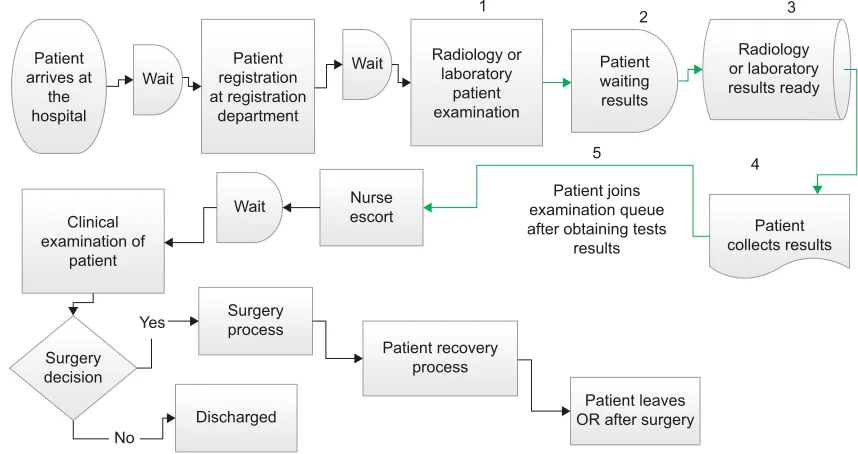
During first examinations surgeons usually orders ancil-lary tests such as X-ray and lab test. Patient with ordered ancillary test are then required to undertake their respective ordered test which can be either X-ray or lab test. After obtaining their ancillary tests results, patients bring their results to the clinic and hand them to the nurse, who takes the results to the surgeons for further diagnosis. At the end of the second examination, patients are either transferred for surgery activity or discharged. Figure 1 presents a concep-tual model of the current orthopedic care process that was translated into the computer simulation model.
Journal of Healthcare Leadership downloaded from https://www.dovepress.com/ by 118.70.13.36 on 24-Aug-2020
Dovepress
Simwita and Helgheim
Methodology and data collection
Our study is based on the observational and interview data from the orthopedic care process from June 2012 to August 2012. The authors followed patients from when they arrived at the registration department to the point of discharge. For data collection process the authors used stopwatches and structured data sheets where each column represented either waiting or assessment time of a particular observed patient activity. The authors recorded patient assessment time and waiting time for registration, examination at the clinic by the surgeon, X-rays, lab tests, the surgery process, and recovery. Based on collected patients data, a daily average of 35 patients attend the clinic per day, of whom 80% are discharged while 20% undergo the whole process up to surgery. During the data collection period, 178 patients underwent the entire process from arrival to surgery to discharge.
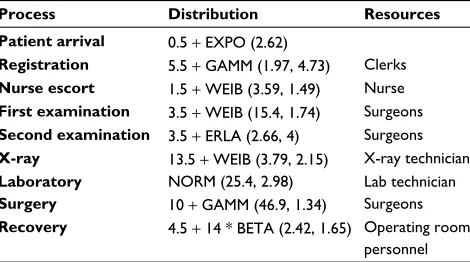
The authors performed a comprehensive analysis of the collected data in order to identify and fit an appropri-ate distribution. Starting with statistical overview, Table 1 summarizes the statistical information on the durations of activity time of the observed 178 patients. Linear correlation techniques and scatter plot were further applied to assess data independence. Histograms and box plot techniques were used to hypothesize concerning the families of distribution. Subsequently, the authors used a chi-square test to determine the representativeness of the identified distribution.21 Thus,
chi-square tests for goodness of fit guided the selection of the appropriate distribution. This study adopted discrete event simulation as the main methodology and used Arena
( Version 13.0) to develop simulation model. The authors used the Arena input analyzer to generate the parameters of the selected distribution (Table 2), which was used in the simulation model.
Model development and assumptions
It is difficult to imitate complex health care delivery systems that involve human decisions and behavior in a simulation model.22 Thus, the authors made a number of assumptions
that guided simulation model development. First, this paper considers operations systems from 6 am to 4 pm because the
Wait
Patient registration at registration
department Patient
arrives at the hospital
Patients joins examination queue for second time after tests
results for further examination
Patient collects results
Patient waiting results
Patient surgery process
Recovery process Patient
leaves OR after recovery process
First visit Discharged No
No
Yes
Yes
Radiology or laboratory results
ready
Radiology or laboratory patient
examination
Wait Nurseescort Wait examinationSurgeon
Surgery decision
5
2
1 4
3
Figure 1 Current process in the orthopedic department: the five numbered steps show the ancillary service follow-up process.
Abbreviation: OR, operating room.
Table 1 Descriptive statistics of the observed data for 178 patients (minutes)
Activity time Mean
(minutes)
Median (minutes)
Standard deviation (minutes)
Registration waiting time 35.134 33 21.35
Registration time 14.87 15 3.888
Nurse escort 4.7 4 2.21
First examination waiting time
144 48.5 41.7
First examination 17.17 16 8.236
Second examination waiting time
53.41 50 22.99
Second examination 13.98 13 5.31
X-ray waiting time 43 45 28.5
X-ray 16.38 17 1.65
Laboratory test waiting time
41 42 12.7
Laboratory test 25.39 25.5 2.98
Surgery time 72.848 60 4.25
Recovery time 12.61 13 2.969
Journal of Healthcare Leadership downloaded from https://www.dovepress.com/ by 118.70.13.36 on 24-Aug-2020
Dovepress Improving surgeon utilization in an orthopedic department
observed patients began to arrive at the hospital from 6 am. Second, the central purpose of this paper is to explore the entire orthopedic care process; thus, it focused on patients who undertook the whole process from arrival to discharge after surgery. Third, in line with the second assumption, the authors assumed that surgeon decisions on whether surgery is required are made only at the end of the second examina-tion (ie, after bringing surgeons the ordered X-ray and lab test results). Fourth, the authors assumed that resources are available to patients for the two clinical and three allocated surgical days. Fifth, the second examination queue has prior-ity over the first examination queue. The model limitations were based on the following grounds: transfer times (trans-port times) within the orthopedic department were not taken into account because the main focus of this study was the orthopedic department, particularly the interaction between specialist orthopedic surgeons and patients.
The simulation model was then developed within the aforementioned assumptions and ran for 100 independent replications and the system was reinitialized between replica-tion. In this model each replication stands for a single day of orthopedic care delivery at this clinic. The normal opera-tions of the studied clinic is from 8 am to 4 pm, however, the authors simulate the model for 9 hours because during data collection process, the clinic was most of the time closing at 5 pm. Patients in this care process are examined based on first in first out service discipline. Likewise, in the simula-tion model patients were also served using the same first in first out queuing discipline. Patient arrivals were generated based on the observed schedule of the two allocated clinic days. Also in the surgical room, the model simulates based on the schedule of the observed three allocated surgical days. During analysis, it was observed that the surgeon at the clinic is the key bottleneck due to high patient wait time
of more than 2 hours and high number of patients waiting in the queue. The authors further used the model to identify the factors creating this high wait time.
Model verification and validation
Model verification is a key step used to ensure that the con-ceptual model is well translated into the simulation computer program and the model is running free of errors.21 To meet
this requirement the authors verified simulation model using Arena debugging techniques and animation and the model was running correctly. The authors took several steps to validate the developed model. First, the authors maintained high face validity of the model by involving the head of the operating room and key orthopedic specialist surgeons in the conceptual model development. Further, the authors used three perfor-mance measures to validate the developed model: patient wait time at the clinic, patient throughput per day at the surgical room and surgeons utilization at the clinic. Observed surgeon utilization is calculated as the total hours that a surgeon has worked divided by the total scheduled hours.23
In addition, throughput is measured as average number of patients that complete surgery per day in a surgical room. The average patient wait time for a surgeon at the clinic from simulation output is 2.8 hours, at 95% confidence interval. This is not very different from the observed patient wait time for a surgeon at the clinic, 2.4 hours. Furthermore, the average surgeon utilization is 94.5% based on the collected patient data. This is very similar to the simulation output surgeons utilization, which is 91.5%, at 95% confidence interval. The average throughput based on the simulation output, at 95% confidence interval, is 5 patients. This is close to the observed average patient throughput at surgical room, which is 7.3 patients. Lastly, the authors increased model validity by running the simulation using the collected patient arrivals instead of sampling from the selected exponential distribu-tion, and the similar results were achieved.
The major difference between simulation output and observed data was found on waiting time for second examination at the clinic. The average waiting time from the simulation model is 0.14 hours while based on the real data the average waiting time is 0.8 hours. This is probably because in the simulation model second visit patients were given priority over the first examination patients. Thus, in the model it was assumed that patients bringing their ancillary results for second examination, were always given first prior-ity in the queue over the first examination patients. Normally patients with ancillary test coming for second examination are always preceded by other patients in the queue. Despite this discrepancy the model is considered valid because other
Table 2 Simulation model input based on observed orthopedic care process operations (minutes)
Process Distribution Resources
Patient arrival 0.5 + EXPO (2.62)
Registration 5.5 + GAMM (1.97, 4.73) Clerks
Nurse escort 1.5 + WEIB (3.59, 1.49) Nurse
First examination 3.5 + WEIB (15.4, 1.74) Surgeons
Second examination 3.5 + ERLA (2.66, 4) Surgeons
X-ray 13.5 + WEIB (3.79, 2.15) X-ray technician
Laboratory NORM (25.4, 2.98) Lab technician
Surgery 10 + GAMM (46.9, 1.34) Surgeons
Recovery 4.5 + 14 * BETA (2.42, 1.65) Operating room
personnel
Note: Numbers in parenthesis represent distribution parameters as generated by Arena input analyzer.
Abbreviations: EXPO, Exponential; GAMM, Gamma; WEIB, Weibull; ERLA, Erlang; NORM, Normal.
Journal of Healthcare Leadership downloaded from https://www.dovepress.com/ by 118.70.13.36 on 24-Aug-2020
Dovepress
Simwita and Helgheim
performance measures such as first examination, throughput and surgeons utilization are close to the actual collected data.
Proposal scenario
The main focus of the simulation model was to explore the key reasons for high patient waiting time and poor surgeon utilization. After simulation analysis of process variables, the authors identified that the key reason for high patient wait time and the poor utilization of surgeons was follow-ups in the form of ancillary services (X-ray and lab tests) ordered by surgeons. Due to these ancillary tests, patients join the examination queue twice, thus experiencing high total wait times. The authors examined one strategy relating to the standardization and transfer of ancillary-service-ordering activities to upstream staff. If implemented, this could signifi-cantly enhance surgeons to handle more patients than before. Figure 2 shows a revised conceptual model.
Care procedure for proposal scenario
The major change in the proposed scenario is that ancillary services will be ordered at the beginning of the process by upstream staff, immediately after the registration process. Upstream staff can either be a nurse or any mid-level trained staff. It should be noted that these resources are not accounted for in the current model. This change implies that surgeons’ examination processes will be initiated once the ancillary tests results are obtained, after which the patient is discharged or undergoes surgery. With this change, the authors further
wanted to explore if the new system can accommodate more than 50% increase in demand without the patient waiting more than 2 hours. The main focus is to investigate how the new model of operations can cope with future increasing demand if ancillary tests are ordered at the beginning of the process. It should be noted that surgeons can still order certain tests if further diagnosis is needed.
Modeling results
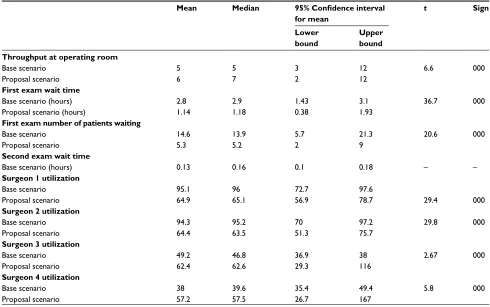
Output analysis of the proposed scenario was performed using the Arena output analyzer at a 95% confidence inter-val. Table 3 presents the average of performance measures before and after the proposed changes. As expected simu-lation model results indicate that patient waiting time can be reduced by 59.2% after delegating ancillary services to upstream staff. The simulation model shows that transferring ancillary services improves surgeon utilizations at the clinic (surgeons 1 and 2) by 17%, thus allowing the accommodation of more patients at the clinic. Given the fact that more than 80% of orthopedic patients have nonsurgical cases,16 this
alternative is still viable for these care providers. The model didn’t show high improvement in throughput in the operat-ing room before and after the changes because arrival rate has not changed. The authors used a paired t-test validation procedure to explore whether there was a significant change in performance measures before and after dedicating ancil-lary services to lower-level staff. All changes were found to be significant as presented in Table 3.
Patient arrives at
the hospital
Clinical examination of
patient
Wait Nurseescort
Surgery process Surgery
decision Yes
No Discharged
Patient recovery process
Patient leaves OR after surgery Patient joins examination queue after obtaining tests
results 5
4
Patient collects results Wait registrationPatient
at registration department
Radiology or laboratory
patient examination
Radiology or laboratory results ready Patient
waiting results Wait
1 2 3
Figure 2 Revised conceptual model. Abbreviation: OR, operating room.
Journal of Healthcare Leadership downloaded from https://www.dovepress.com/ by 118.70.13.36 on 24-Aug-2020
Dovepress Improving surgeon utilization in an orthopedic department
Discussion
This study focused on exploring the entire orthopedic care process. The authors explore the efficiency of the process, focusing on the inadequate utilization of surgeons and high patient wait times. The focus is identifying process inhibitors that lead to poor utilization of surgeons and showing how surgeon utilization can be improved and also investigating the effect of improved utilization on future increasing demand. Discrete event simulation was used to explore the base sce-nario that represents the observed orthopedic care process and to develop a proposal scenario that can be used to improve surgeons utilization as well as reducing patient waiting time.
The simulation results from the base scenario reveal long patient wait times and poor surgeon utilization. Poor surgeon utilization has several negative effects, such as long patient wait times, as well as morbidity and mortality. The authors suggested a proposal scenario that demonstrates a change that may lead to the improvement of the orthopedic care process, without any increase in resources. The objective of the proposed scenario was, to improve surgeon utilization and shorten the time patients had to wait at the orthopedic clinic. As expected, the results of the simulation analysis show significant decrease in patient wait time. The results presented in Table 3 indicate that if ancillary services could
Table 3 Comparison of performance measures before and after transferring ancillary services
Mean Median 95% Confidence interval
for mean
t Sign
Lower bound
Upper bound Throughput at operating room
Base scenario Proposal scenario
5 6
5 7
3 2
12 12
6.6 000
First exam wait time
Base scenario (hours) Proposal scenario (hours)
2.8 1.14
2.9 1.18
1.43 0.38
3.1 1.93
36.7 000
First exam number of patients waiting
Base scenario Proposal scenario
14.6 5.3
13.9 5.2
5.7 2
21.3 9
20.6 000
Second exam wait time
Base scenario (hours) 0.13 0.16 0.1 0.18 – –
Surgeon 1 utilization
Base scenario Proposal scenario
95.1 64.9
96 65.1
72.7 56.9
97.6
78.7 29.4 000
Surgeon 2 utilization
Base scenario Proposal scenario
94.3 64.4
95.2 63.5
70 51.3
97.2 75.7
29.8 000
Surgeon 3 utilization
Base scenario Proposal scenario
49.2 62.4
46.8 62.6
36.9 29.3
38 116
2.67 000
Surgeon 4 utilization
Base scenario Proposal scenario
38 57.2
39.6 57.5
35.4 26.7
49.4 167
5.8 000
Note: Surgeons 1 and 2 represent two surgeons at the orthopedic clinic, whereas surgeons 3 and 4 represent two surgeons at the surgical room.
Table 4 System behavior for 55% demand increase after change
(95% confidence interval)
Waiting time (hours)
Surgeon 1 utilization
Surgeon 2 utilization
Base model 2.8 64.4 64.9
55% demand increase 1.89 88.4 89.3
Note: The authors assume the patient is not supposed to wait for more than 2 hours.
0 0.5 1 1.5 2
10% 20% 30% 55%
Waiting time (hours)
Demand increase rate Average waiting time
Figure 3 Percentage of demand that can be accommodated.
The authors further explored future demand that can be accommodated as a result of a released surgeon capacity. The simulation model demonstrates that 55% increase in demand can be accommodated without patient waiting more than 2 hours. The results are shown in Table 4 and Figure 3.
Journal of Healthcare Leadership downloaded from https://www.dovepress.com/ by 118.70.13.36 on 24-Aug-2020
Dovepress
Simwita and Helgheim
be performed before the start of clinic examination services for all patients in need of ancillary services, orthopedic care process could be highly improved.
The authors further explored the effect of delegating ancillary services on surgeon utilization. The main objective of delegating ancillary services to upstream staff is to free up surgeon capacity by reducing the number of patients meeting the surgeons twice on the same day. The freed capacity will thus be used by surgeons to accommodate increasing patient demands and needs. As expected, the simulation results in Table 3 showed a significant reduction of surgeons’ utilization at the clinic after dedicating ancillary services to downstream staff. This implies that the capacity that had been used for patients’ second visits, bringing with them the results of the ordered ancillary tests, can be utilized to accommodate other patients in the queue or those on the waiting list.
From healthcare processes perspective the necessity of improving patient access to care through the use of discrete event simulation is presented in this study. A simulation model demonstrates that if these changes are implemented, up to 55% additional patient demand can be accommodated without a patient waiting more than 2 hours. Thus, freeing up surgeon capacity is necessary to enhance the flexibility of responding to the increasing patients demands. According to Chadha et al,24 the benefit of having excess capacity in
inpatient clinics would include the provision of efficient and timely patient services. The simulation results showed that dedicating ancillary services to upstream staff reduces patient wait time; thus, patients can see the surgeons earlier in the process than before.
It is worth noting that implementing the proposed improvement initiatives will undoubtedly present a sig-nificant challenge. A shift to using upstream staff to order ancillary tests poses a risk of unnecessary or wrong tests being ordered by these staff. Previous studies demonstrated that unnecessary ordering of tests is a global concern and contributes to overall hospital cost as well as inappropriate use of resources in labs and X-ray sections.25–27 This effect
could then outweigh the improved surgeons’ utilization at the clinic in this study because part of the freed capacity will be used to order more new tests. This will lead to poor utiliza-tion of improved surgeon capacity as well as increased cost to the hospital as a whole due to inappropriate utilization of lab and X-ray resources.
Nevertheless, previous studies investigating how to reduce the associated cost of unnecessary tests ordering have shown that staff training and involvement in the devel-opment of tests guidelines reduce the aforementioned cost
and improve resource utilization.27,28 Thus, to ensure that
the proposed improvements are achieved, hospitals should focus on training the upstream staff before implementation of the proposed model. In addition, the process of developing standardized protocols should involve surgeons, X-ray, lab as well as upstream staff. This will enhance the development of a comprehensive standardized protocol that will help to reduce the effect of ordering unnecessary tests and hence utilize effectively the improved surgeons’ capacity.28
It is a common practice for surgeons to order some additional tests in a situation where they need more investi-gation for patients. In the proposed model, if surgeons still need to order some tests for patients, this will partly reverse the proposed model. But it will not look exactly like the current model, because not all patients will need to go for additional tests. The authors believe that if upstream staff are well trained and able to manage their work, few patients will be redirected for additional tests. Since the volume of these tests will not be as high as the volume of tests in the baseline model, the inefficiencies observed in the base model, such as high waiting time, may not be observed in the same pattern. Hence, improved surgeon capacity will to a large extent still be used to treat more patients than in the baseline model.
The above raised issues need to be carefully consid-ered during the implementation of the proposed model. For example, unnecessary ordering of tests if not carefully handled could potentially increase figures of surgeon uti-lization in real life because more tests will still need to be ordered by the surgeons. This will increase the inefficiency utilization of the surgeons. As stated above, these problems can be eliminated through training and collaborative working between surgeons and upstream staff. If all necessary precau-tions and educational steps are taken into consideration, the proposed model can lead to improved patient access to care and improved surgeon utilization.
Managerial implications
The simulation result from this study provide significant insights to healthcare providers aiming to improve patient care processes. First the reduced patient waiting time and improved surgeon utilization indicates that improving patient care process does not necessarily need additional workforce capacity. Instead healthcare providers should focus on better utilization of existing workforce capacity to enhance flexible capacity that can be used to accommodate ever increasing patient demands and needs.
Second, the implication of increased demand that can be accommodated as a result of released capacity suggest that
Journal of Healthcare Leadership downloaded from https://www.dovepress.com/ by 118.70.13.36 on 24-Aug-2020
Dovepress Improving surgeon utilization in an orthopedic department
patients access to care can be improved through better utili-zation of existing surgeons. The released surgeons capacity can be used to reduce not only patients waiting time but also to improve patient access to orthopedic care services. This improvement further indicate that, healthcare providers should focus on finding better ways of utilizing the existing surgeons capacity in order to accommodate more patients within the existing workforce capacity.
Finally globally hospitals are facing increasing trend of human resource constraints,1 thus it is important for
health-care providers to adopt operational management tools such as simulation in order to improve the utilization of existing surgeons. With increasing human resource constraints par-ticularly in developing countries the importance of increasing patient access to care through better utilization of resources is imperative.
Conclusion
This study used discrete event simulation model to show how the care process can be explored to identify critical factors that inhibit better resource utilization, leading to high patient wait times. The authors have further suggested ways in which surgeons, as critical resources, can be utilized efficiently to improve care services and reduce patient waiting time. The simulation results show that if the proposed changes will be implemented, it will be possible to achieve reduced patient wait time and improved surgeon utilization, thus increasing patient access to care.
Our study faces some limitations: first, patients’ wait time includes the early arrival of patients, before the start of examination services, as well as surgeons lateness. If surgeons could arrive at the start of clinic sessions patient waiting time could decrease. Likewise, if patients could arrive a few minutes before the start of the clinical session, this could further decrease their wait time.
Also, our study was limited to a group of patients who underwent the entire process from arrival to discharge after surgery. However, the authors believe that the improvement initiatives can still impact patients ending their journey at the clinic. To realize these improvements, all patients must be treated based on the proposed model. This limitation calls for future research evaluating both the patients ending their journey at the clinic and those taking the entire process to surgery.
Despite the fact that our study was conducted in a single orthopedic care process, however our findings can be generalized to other orthopedic care processes with the same operational characteristics. From patient care process perspective, high patient waiting time problems are typical
issues facing healthcare organizations today.14,29 Thus,
pro-cess redesign proposed in this study can be applied with other orthopedic care processes globally to address the issue of high patient waiting time as well as improving surgeons utilization.
Acknowledgments
The authors would like to thank the management of the Bugando Hospital for allowing us to collect data for this study. The authors would also like to thank all health care pro-viders for their great help during the data collection period. The authors would further like to express their gratitude to Associate Professor Ketil Danielsen of Molde University College for comments on the simulation aspect.
Disclosure
The authors report no conflicts of interest in this work.
References
1. WHO. Working together for health. GENEVA. 2006.
2. Anand PS, Bärnighausen T. Human resources and health outcomes: Cross-country econometric study. Lancet. 2004;364:1603–1609.
3. Edward A, Kumar B, Niayesh H, Naeem AJ, Burnham G, Peters DH. The association of health workforce capacity and quality of pediatric care in Afghanistan. Int J Qual Health Care. 2012;24(6):578–586.
4. Debas T. Haile, Richard Gosselin, Colin McCord, AT. Surgery. In: Jamison TL, Breman JG, Measham AR, et al, (editors). Disease Control Priorities in Developing Countries. 2nd ed. New York: Oxford University Press; 2006:1245–1261;1293–1307.
5. Funk LM, Weiser TG, Berry WR, et al. Global operating theatre distribu-tion and pulse oximetry supply: An estimadistribu-tion from reported data. Lancet. 2010;376(9746):1055–1061.
6. Min D, Yih Y. Scheduling elective surgery under uncertainty and down-stream capacity constraints. Eur J Oper Res. 2010;206(3):642–652. 7. Abo-Hamad W, Arisha A. Simulation-based framework to improve
patient experience in an emergency department. Eur J Oper Res. 2013; 224(1):154–166.
8. Kumbhakar SC. Efficiency and productivity of world health systems: where does your country stand? Appl Econ. 2010;42(13):1641–1659. 9. Steins K, Persson F, Holmer M. Increasing Utilization in a Hospital
Operat-ing Department UsOperat-ing Simulation ModelOperat-ing. Simulation. 2010;86(8–9): 463–480.
10. Kujala J, Lillrank P, Kronström V, Peltokorpi A. Time-based management of patient processes. J Health Organ Manag. 2006;20(6):512–524. 11. Davenport T, Short J. The New Industrial Engineering : Information
Technology And Business Process Redesign. Sloan Manage Rev. 1990;31(4):11–27.
12. Bretthauer KM, Coˇté MJ. A Model for Planning Resource Requirements in Health Care Organizations. Decis Sci. 1998;29(1):243–270. 13. Barjis J. Editorial: Healthcare simulation potentials and challenges.
Simula-tion. 2010;86(8–9):459–462.
14. Bowers J, Mould G. Managing uncertainty in orthopaedic trauma theatres.
Eur J Oper Res. 2004;154(3):599–608.
15. Bowers J, Mould G. Concentration and the variability of orthopaedic demand. J Oper Res Soc. 2002;53(2):203–210.
16. Meer RB van der, Rymaszewski LA, Findlay H, Curran J. Using OR to support the development of an integrated musculo-skeletal service. J Oper Res Soc. 2005;56(2):162–172.
17. Baril C, Gascon V, Cartier S. Design and analysis of an outpatient orthopaedic clinic performance with discrete event simulation and design of experiments. Comput Ind Eng. 2014;78:285–298.
Journal of Healthcare Leadership downloaded from https://www.dovepress.com/ by 118.70.13.36 on 24-Aug-2020
Dovepress
Journal of Healthcare Leadership
Publish your work in this journal
Submit your manuscript here: http://www.dovepress.com/journal-of-healthcare-leadership-journal
The Journal of Healthcare Leadership is an international, peer-reviewed, open access journal focusing on leadership for the health profession. The journal is committed to the rapid publication of research focusing on but not limited to: Healthcare policy and law; Theoretical and practical aspects healthcare deliv-ery; Interactions between healthcare and society and evidence-based practices;
Interdisciplinary decision-making; Philosophical and ethical issues; Hazard management; Research and opinion for health leadership; Leadership assess-ment. The manuscript management system is completely online and includes a very quick and fair peer-review system. Visit http://www.dovepress.com/ testimonials.php to read real quotes from published authors.
Dove
press
Simwita and Helgheim
18. Bowers J, Mould G. The deferrable elective patient: a means of reducing waiting-lists in orthopaedics. J Manag Med. 2002;16(2–3): 150–158.
19. Baldwin LP, Eldabi T, Paul RJ. Simulation in healthcare management: A soft approach (MAPIU). Simul Model Pract Theory. 2004;12(7–8 SPEC. ISS.):541–557.
20. Barjis J. Healthcare simulation and its potential areas and future trends.
SCS M&S Mag. 2011;1:1–6.
21. Law AM, Kelton WD. Simulation Modeling and Analysis. Vol. 2; 2000.
22. Venkatadri V, Raghavan VA, Kesavakumaran V, Lam SS, Srihari K. Simulation based alternatives for overall process improvement at the cardiac catheterization lab. Simul Model Pract Theory. 2011;19(7): 1544–1557.
23. Shi J, Peng Y, Erdem E. Simulation analysis on patient visit efficiency of a typical VA primary care clinic with complex characteristics. Simul Model Pract Theory. 2014;47:165–181.
24. Chadha R, Singh A, Kalra J. Lean and queuing integration for the transformation of health care processes A lean health care model. Clin Gov An Int J. 2012;17(3):191–199.
25. van Walraven C, Naylor CD. Do we know what inappropriate laboratory utilization is? a systematic review of laboratory clinical audits. JAMA. 1998;280(6):550–558.
26. Williams SV, Eisenberg JM, Pascale LA, Kitz DS. Physicians’ percep-tions about unnecessary diagnostic testing. Inquiry. 1982;19(4):363–370. 27. Lewis S, Foreman J. Low-cost diagnostic technologies and clinical
outcomes. The impact of inappropriate utilization. Int J Technol Assess Health Care. 1997;13(4):501–511.
28. Kwok J, Jones B. Unnecessary repeat requesting of tests: an audit in a government hospital immunology laboratory. J Clin Pathol. 2005;58(5):457–462.
29. Rohleder TR, Lewkonia P, Bischak DP, Duffy P, Hendijani R. Using simulation modeling to improve patient flow at an outpatient orthopedic clinic. Health Care Manag Sci. 2011;14(2):135–145.
Journal of Healthcare Leadership downloaded from https://www.dovepress.com/ by 118.70.13.36 on 24-Aug-2020