X-ray Studies
of the
Intermediate Polar PQ Gem
Cynthia Helen James
A thesis submitted to the University of London for the
degree of Master of Philosophy
Mullard Space Science Laboratory
Department of Space and Climate Physics
University College London
ProQuest Number: U 642368
All rights reserved
INFORMATION TO ALL USERS
The quality of this reproduction is dependent upon the quality of the copy submitted.
In the unlikely event that the author did not send a complete manuscript
and there are missing pages, th ese will be noted. Also, if material had to be removed, a note will indicate the deletion.
uest.
ProQuest U 642368
Published by ProQuest LLC(2015). Copyright of the Dissertation is held by the Author.
All rights reserved.
This work is protected against unauthorized copying under Title 17, United States Code. Microform Edition © ProQuest LLC.
ProQuest LLC
789 East Eisenhower Parkway P.O. Box 1346
Abstract
This thesis concerns an X-ray study of the intermediate polar (IP) magnetic cataclysmic variable (MCV) PQ Gem, which exhibits variable circular polarisation (indicative of a relatively high magnetic field) and a secure soft X-ray spectral compo nent. These are unusual properties for an IP MCV. The scope of the thesis includes V405 Aur and RX J1712.6-2414, IPs which exhibit some of PQ Gem’s unusual char acteristics. This enables preliminary assessment of the generality of the PQ Gem’s results.
The first three chapters are devoted to the introduction of the main character istics and processes taking place in IPs, relevant previous findings about the three IPs under investigation and a description of the data, its reduction and analysis techniques employed. The focus of the analysis (Chapter 4) is to determine the role played by absorption and the changing visibility of the emission region (s) in forging the observed modulation of the light curves of PQ Gem over the spin period. It is concluded that both play a part. The phased-resolved spectroscopy shows a strong correspondence between the variation of the covering fraction of a partial absorber component and the hardness ratio. Possible accretion scenarios are examined and a modification of the accretion curtain model (Rosen et al. 1988) proposed. The mass of the white dwarf is also calculated. The analyses of V405 Aur and RX J1712.6-2414 (Chapters 5 & 6) resemble those of PQ Gem. The results are interpreted both in their own right and compared to those of PQ Gem. An explanation for the vary ing prominence of the double pulse in the spin folded light curves of V405 Aur is suggested.
C on ten ts
1 Introducing M agnetic C ataclysm ic Variables 13
1.1 So what are Cataclysmic V ariables?... 13
1.2 The power source in Cataclysmic V ariables... 14
1.2.1 A c c r e tio n ... 14
1.2.2 The Effect of a Strong Magnetic Field on A c cre tio n ... 17
1.2.2.1 The Polar Picture ... 17
1.2.2.2 The IP R epresentation... 21
1.2.2.3 Cyclotron M o d ellin g... 24
1.3 The Properties of Intermediate P o lars... 29
1.3.1 Fundamental properties ... 29
1.3.1.1 The Mass of the White D w arf... 31
1.3.2 Light Curve V ariations... 32
1.3.2.1 X -ra y s... 32
1.3.2.2 Polarised L i g h t ... 32
1.3.3 X-ray Spectrom etry... 33
1.3.4 Light Curve Modulation Scenarios... 33
2 The Participants 38 2.1 In tro d u ctio n ... 38
2.2 PQ Gem or RF J 0 7 5 1 -H 4 ... 39
2.2.1 System P a ra m e te rs... 39
2.2.1.1 The Mass of the Primary ... 39
2.2.1.3 Magnetic F i e l d ... 41
2.2.1.4 P e r i o d s ... 41
2.2.1.5 O rie n ta tio n ... 44
2.2.2 The Light C u rv e s... 45
2.2.2.1 X - r a y ... 45
2.2.2.2 Polarised L i g h t ... 46
2.2.3 X-ray Spectroscopy... 46
2.2.4 A c c r e tio n ... 48
2.2.5 Why is PQ Gem so S p e c ia l? ... 49
2.3 V405 Aur or RX J05584-53... 51
2.3.1 System P a ra m e te rs ... 51
2.3.2 X-ray Light C u rv e s... 53
2.3.3 X-ray Spectroscopy... 53
2.3.4 Accretion S c e n a r io ... 54
2.4 RX J1712.6-2414... 54
2.4.1 System P a ra m e te rs... 54
2.4.2 Spectroscopy ... 57
2.5 S u m m a r y ... 57
3 Observations, D ata R eduction and Analysis 59 3.1 A S C A ... 59
3.1.1 ASCA Instrum entation... 59
3.1.2 Observations from A SC A ... 60
3.1.3 Reduction of ASCA Data ... 61
3.2 R X T E ... 64
3.2.1 The RXTE Satellite ... 64
3.2.2 Observations using R X T E ... 65
3.2.3 Reduction of RXTE D a t a ... 66
3.3 Data A n aly sis... 68
3.3.2 Modelling and Fitting of X-ray S pectrum ... 69
3.3.2.1 Spectral F ittin g ... 69
3.3.2.2 The M o d e ls... 70
3.3.3 The A pproach... 73
4 X-ray A nalysis of PQ G em 75 4.1 Preamble ... 75
4.2 The Light C u rv e s ... 75
4.2.1 Period A n a ly sis... 76
4.2.2 M o d u la tio n ... 77
4.2.2.1 ASCA light c u r v e s ... 77
4.2.2.2 RXTE light c u rv e s ... 79
4.2.2.3 Comparison between the ASCA and RXTE folded light c u r v e s ... 79
4.2.2.4 RXTE hardness r a t i o s ... 79
4.3 Spectral A n a ly sis... 81
4.3.1 The Integrated Spectrum ... 81
4.3.2 Phase-resolved sp ectro sco p y ... 84
4.3.2.1 4 B i n s ... 84
4.3.2.2 10 B i n s ... 86
4.4 The Mass of the White D w a r f ... 89
4.4.1 The Technique ... 89
4.4.2 The R e s u lts ... 92
4.5 D iscussion... 94
4.5.1 The Mass of the White D w a r f... 96
4.5.2 Spin Pulse M o d u latio n ... 96
4.5.3 Accretion Model ... 97
4.5.4 Occultation by the Accretion D i s c ? ...101
4.5.5 Disc Overflow? ... 102
5 X-ray A nalysis of V405 Aur 104
5.1 Preamble ...104
5.2 The Light C u rv e s ... 104
5.2.1 Period A n a ly sis...104
5.2.2 M o d u la tio n ... 107
5.3 Spectroscopy ... 107
5.3.1 The Integrated S p e c tra ... 109
5.3.1.1 A S C A ...109
5.3.1.2 R X T E ...I l l 5.3.2 Phase-Resolved Spectroscopy ... I l l 5.4 D iscussion... 117
5.4.1 Interpretation of the R e su lts... 117
5.4.2 Comparison to PQ G e m ... 119
6 X-ray A nalysis o f R X J1712.6-2414 121 6.1 Preamble ... 121
6.2 The Light C u rv e s...121
6.2.1 Period A n a ly sis...121
6.2.2 M o d u la tio n ...122
6.3 Spectral A n a ly sis...126
6.3.1 The Integrated Spectrum ...126
6.3.2 Phase-resolved Spectroscopy...127
6.4 D iscussion... 129
7 Sum m ary and C onclusions 135
Acknow ledgem ents 138
List o f Tables
2.1 Estimates of the mass of the white dwarf in PQ Gem using various models derived from the radial free fall of gas onto the white dwarf through magnetically controlled accretion... 40
2.2 Table summarizing the main system and observational parameters for PQ Gem, V405 Aur and RX J1712.6-24141... 58
3.1 Gharacteristics of ASCA’s instrumentation... 60
3.2 Details of the ASCA observations and data used in the analysis for this thesis... 62
3.3 The main characteristics of the R X T E PGA instrument... 65
3.4 Details of the R X T E observations and data used in the analysis for this thesis... 67
4.1 The details of the significant power peaks found from period analysis of ASCA SISl data and R X T E pea data of PQ Gem... 77
4.2 Results from spectral analysis of the ASCA integrated spectrum of PQ Gem... 82
4.3 Results from spin phase-resolved spectroscopy of PQ Gem over 4 phase-bins. The normalisation alone was allowed to vary from the reference model... 85
4.4 Results from spin phase-resolved spectroscopy of PQ Gem over 4 phase-bins. The absorption alone was allowed to vary from the refer ence model... 86
4.5 Results from spin phase-resolved spectroscopy of PQ Gem over 4 phase-bins. Both the normalisation and the absorption factors were allowed to vary from the reference model... 87
4.6 The results from spin phase-resolved spectroscopy of PQ Gem over 10 phase-bins. Only the normalisation and absorption parameters were allowed to vary from the reference model... 90
4.7 Results from fitting the stratified-accretion-column model of Cropper et al. (1999b) to both ASCA and R X T E data of PQ Gem... 95
5.1 The details of the statistically significant amplitude peaks found from period analysis of ASCA SISl data and R X T E PGA data of V405 Aur. 105
5.2 Results from spectral analysis of the integrated spectrum of V405 Aur. 112
5.3 Results from spin phase-resolved spectral analysis of V405 Aur over 5 phase-bins. Only the normalisation and inhomogeneous absorption parameters of the reference model were allowed to vary during the spectral fitting...113
5.4 Results from spin phase-resolved spectral analysis of V405 Aur over 5 phase-bins. Only the partial covering absorber parameters of the reference model were allowed to vary during the spectral fitting. . . . 114
5.5 Results from spin phase-resolved spectral analysis of V405 Aur over 5 phase-bins. Only the normalisation parameters of the reference model were allowed to vary during the spectral fitting... 115
6.1 Results from spectral analysis of the integrated spectrum of RXJ1712.6-2414... 127
6.3 Results from beat phase-resolved spectral analysis of RX J1712.6-2414 over 10 phase-bins. During the fitting only the inhomogeneous absorp tion parameters of the reference model were allowed to vary...131 6.4 Results from beat phase-resolved spectral analysis of RX J1712.6-2414
List o f Figures
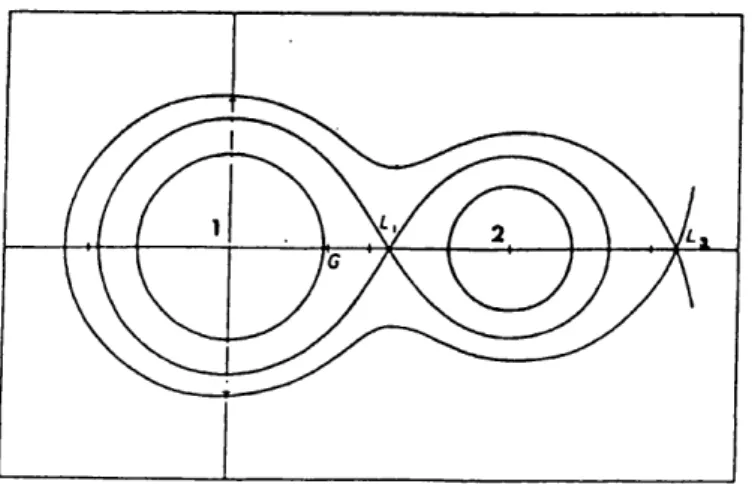
1.1 Roche equipotentials. (Pringle 1985; Warner 1995)... 15 1.2 The structure of the accretion shock showing a high density compact
region which is the source of the hard X-rays and a more extended lower density region which gives rise to the optical - IR polarised radiation. Reproduced from Wickramasinghe (1988)... 19 1.3 Schematic picture of a homogeneous accretion column taken from King
(1995)... 20 1.4 Figures showing the temperature and density profiles within the post
shock flow for different mass white dwarfs and the dependence on shock height of the temperature and density profiles as a function of the magnetic field. Reproduced from figure 1, Cropper at al. 1999a. . 22 1.5 Schematic picture of disc accretion from an axisymmetric IP system
taken from Ghosh & Lamb (1978)... 25 1.6 Schematics of the flow of material on to the white dwarf in an IP for
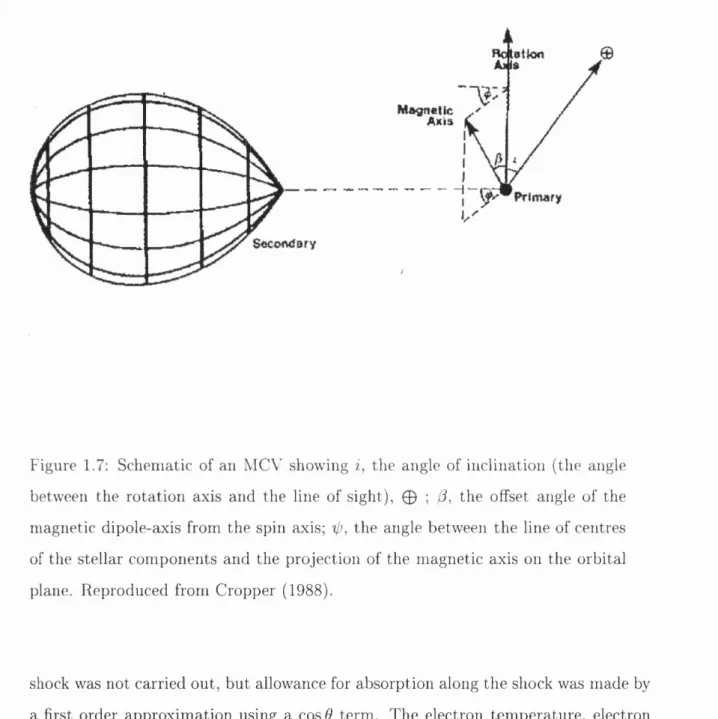
discless accretion and through an accretion curtain via an accretion disc. Reproduced from figure 1 of Ferrario (1996)... 26 1.7 Schematic of an MCV showing i, the angle of inclination; /?, the offset
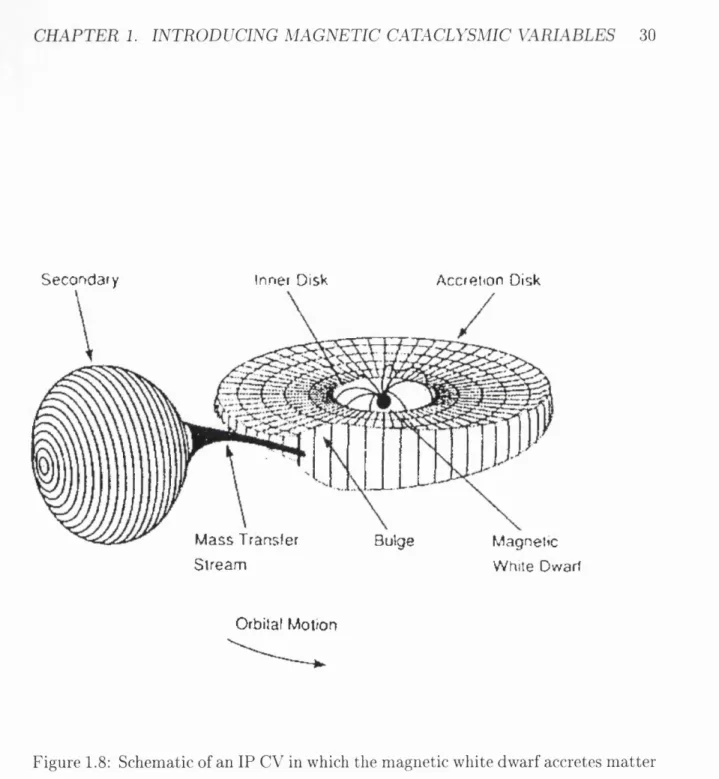
angle of the magnetic dipole-axis from the spin axis; the angle between the line of centres of the stellar components and the projection of the magnetic axis on the orbital plane. Reproduced from Cropper (1988)... 28 1.8 Schematic of an IP CV in which the magnetic white dwarf accretes
m atter from a truncated disc. Reproduced from Mason et al. (1988). 30
1.9 Schematic diagram showing a side view illustration of the accretion-curtain model of an IP. Reproduced from figure 13, Hellier et al. (1991)... 35
1.10 Schematic diagram showing an intermediate polar with a relatively low magnetic field. Attenuation of the X-rays is greatest parallel to the white dwarf surface, and least along the magnetic field lines. Re produced from figure 8, Norton et al. 1999... 37
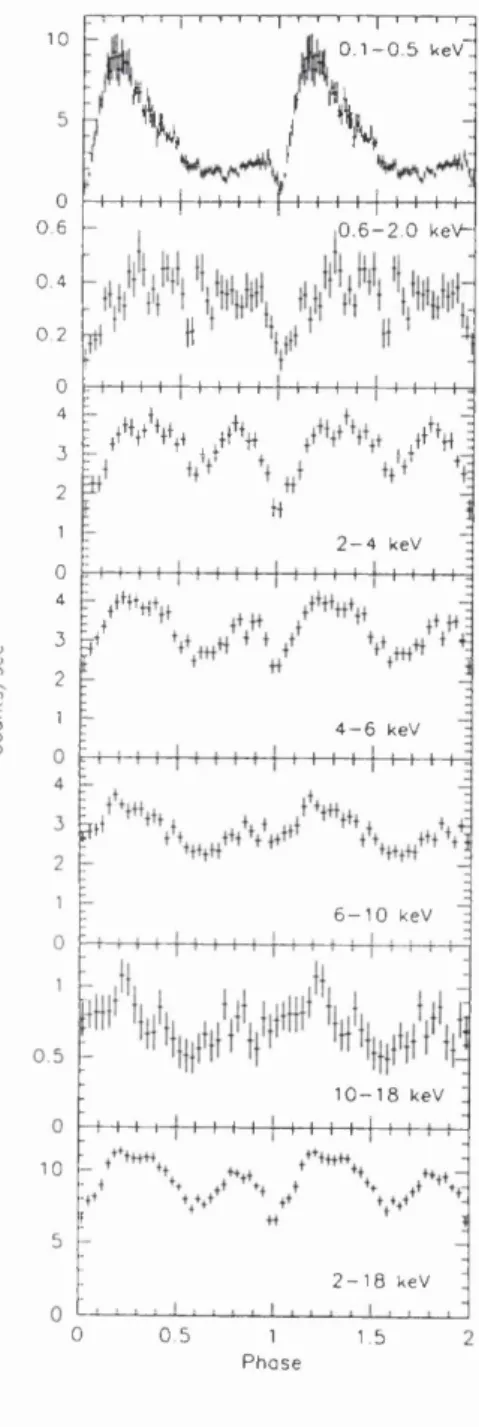
2.1 Phase-folded light curves for the ’soft’ and ’hard’ ROSAT PSPC spec tral bands; and five energy-resolved Ginga bands. Reproduced from figure 3, Duck et al. (1994)... 43
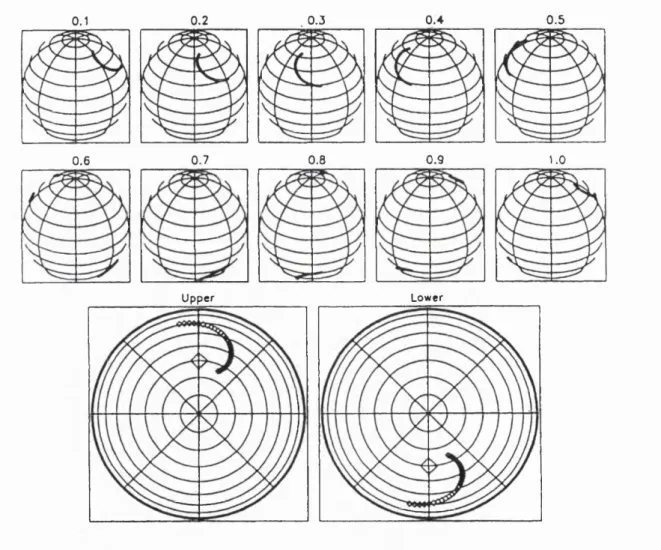
2.2 Illustration of the upper and lower accretion arcs on the surface of the white dwarf as computed from cyclotron modelling of PQ Gem at consecutive phases of the spin period. Reproduced from figure 9 of Potter et al. (1997)... 47
2.3 Inferred geometry of magnetic field lines along which m atter is accret ing in PQ Gem. Reproduced from figure 6, Mason 1997 50
2.4 Spin phase-folded light curves of V405 Aur for optical waveband and the ’soft’ and ’hard’ ROSAT PSPC spectral bands. Reproduced from Allen et al. (1996), figures 2 & 4... 52
2.5 ROSAT PSPC X-ray light curve folded on the 1003s beat period. Reproduced from Buckley et al. (1997)... 56
4.1 Periodograms calculated from the ASCA 0.5-10.0keV light curve (up per half) and R X T E 2.0-25.0keV light curve (lower half) of PQ Gem. 78
4.2 Background subtracted light curves of PQ Gem using ASCA SISO and R X T E PGA data folded on the spin period... 80
4.3 The R X T E 8.0-25.0keV/2.0-8.0keV hardness ratio for PQ Gem folded on the spin period... 81
4.4 Integrated ASCA spectra of PQ Gem... 83
12
4.5 The results from spin phased-resolved spectroscopy over 10 phase-bins using ASCA data of PQ Gem... 91 4.6 Figure 2.2 repeated here for the convenience of the reader. Reproduced
from figure 9 of Potter et al. (1997)... 93
5.1 Periodograms of V405 Aur using ASCA SISl data from observation 05/10/96 and R X T E PGA d ata...106 5.2 ASCA and R X T E light curves of V405 Aur folded on the spin ephemeris
of Allan et al. (1996)... 108 5.3 The RXTE hardness ratio 8.0-25.OkeV/2.0-8.OkeV of V405 Aur. . . . 109 5.4 The integrated ASCA spectra of V405 Aur... 110 5.5 The results (Table 5.3) from spin phase-resolved spectroscopy of V405
Aur over 5 phase-bins using ASCA data... 116
6.1 Periodograms of RX J1712.6-2414 calculated from ASCA SISO data and RXTE PGA data...123 6.2 Light curves of RX J1712.6-2414 taken from ASCA SISO data folded
on the 927.66s spin period and on the 1003.299s, beat period... 124 6.3 Light curves of RX J1712.6-2414 taken from RXTE PGA data folded
on the 927.66s spin period and on the 1003.299s, beat period... 125 6.4 8.0-25.OkeV/2.0-8.OkeV RXTE hardness ratio of RX J1712.6-2414. . 126 6.5 4.0-10.OkeV/1.0-4.OkeV ASCA hardness ratio of RX J1712.6-2414. . 126 6.6 Integrated ASCA spectra of RX J1712.6-24...128 6.7 Plots of the results (Table 6.4) from beat phase-resolved spectroscopy
C hapter 1
In trod u cin g M agn etic C ataclysm ic
V ariables
1.1
So w hat are C ataclysm ic Variables?
Cataclysmic variables (CVs) are close binary systems with relatively short orbital periods (generally, 3-6 hours). They are important in the study of accretion phe nomena and accretion disc properties, as well as providing valuable information on the final stages of stellar evolution.
The primary star is a degenerate white dwarf, whereas the secondary is a low mass star on the lower main sequence. The usual spectroscopic classification for the secondary is a cool M-type (red dwarf) star, but other late type stars such as K-type or degenerate secondaries are also possible (Cropper et al. 1998a, Ramsay et al. 2000). Tidal effects due to gravitational and centrifugal forces distort the secondary from spherical to pear-drop shape and lead to its rotational synchronisation with the orbital period. This in turn mainly eliminates any initial eccentricity to give a circular orbit. The primary rotates asynchronously in the majority of CVs and is largely unaffected by distortion due to its compact nature. CVs are semi-detached systems (the secondary fills its Roche lobe. Section 1.2.1) which leads to stream accretion onto
CHAPTER 1. INTRODUCING MAGNETIC CATACLYSMIC VARIABLES 14
the primary via an accretion disc (for the majority of cases). This extends as far as the surface of the primary in those systems which have a low magnetic moment. However, a large magnetic moment in the primary can be sufficient to inhibit the formation of this disc and generate sufficient torque to ensure synchronisation (Section 1.2.2.1).
The magnetic CVs (MCVs) are those for which the magnetic moment is suf ficient strong to substantially alter the accretion processes. The highest field MCVs (mainly the polars or AM Her systems) accrete directly from the stream onto the surface of the white dwarf. The lower field MCVs (the majority of intermediate polars (IPs)) possess a truncation to the inner boundary of the accretion disc, but the field is insufficient to inhibit disc formation completely.
Warner (1995) gives a comprehensive review of the several classes of CVs, many of which show a variety of eruptive behaviour.
1.2
T he power source in C ataclysm ic Variables
The power source in CVs is the conversion of gravitational potential energy to radi ation through the transfer of mass from the secondary to the primary i.e. by stream accretion.
1.2.1 A ccretion
The transfer of mass from the secondary to the primary is approximated to by Roche lobe geometry in which two objects depict Keplerian orbits around their common centre of mass due to their mutual gravitational attraction. The model assumes that these orbits are circular and that the objects are centrally condensed, i.e. they can be regarded dynamically as point sources. It then considers the behaviour of a test particle introduced into the system. The two objects are sufficiently massive that their orbits are unaffected by this test particle.
CHAPTER 1. INTRODUCING MAGNETIC CATACLYSMIC VARIABLES 15
Figure 1.1: Roche equipotentials. The centres of the primary (1), secondary (2) and the centre of gravity (G) are shown for a mass ratio q=0.5. Li and L2
CHAPTER 1. INTRODUCING MAGNETIC CATACLYSMIC VARIABLES 16
other at larger radii. The minimum equipotential to encompass both masses forms a critical surface with a saddle point, the inner Lagrangian point (Li) separating two distorted spheres, the Roche lobes (Figure 1.1). It is easier for the test particle to pass to the other lobe through L\ than to escape across the critical surface in general. Even so its path within the critical surface is dominated by the gravitational pull of the Roche lobe within which it is located (Frank, King & Raine 1992) .
This model forms a good approximation to the gravitational situation for CVs in which the secondary completely fills its Roche lobe. Any slight perturbation of the Roche lobe of the secondary in the vicinity of Li is sufficient to cause its material to pass into the Roche lobe of the primary. The stream flow makes an angle with the line of centres between the two stars due to the Coriolis effect and expands trans versely at the speed of sound which allows the pressure to become negligible. The density distribution of the material within the stream is approximately Gaussian. The stream of gas particles issuing from Li possess considerable angular momentum and are accelerated from sonic to supersonic velocities with a ballistic trajectory which is governed by the Roche potential. This angular momentum is sufficient to ensure that the stream fails to accrete directly onto the primary, but circularises within the Roche lobe to impact on itself and thereby to form a ring of material (the distance of which, from the centre of the white dwarf, is termed the circulari- sation radius). Nevertheless, conservation of energy considerations ensure that the trajectory remains within the Roche lobe of the primary. The ring of material has finite extent and rotates differentially so that there is a distribution of energy loss caused by the dissipation of heat through viscous processes. Through arguments of the conservation of angular momentum, the ring of particles diffuses into a circular disc of material (Lubow & Shu 1975).
CHAPTER 1. INTRODUCING MAGNETIC CATACLYSMIC VARIABLES 17
impact site (Lubow & Shu 1975; Bath et al. 1983; Livio et al. 1986; Rozyzka & Schwarzenberg-Czerny 1987; Rozyzka 1988; Lubow 1989; Hirose et al. 1991; Lan- zafame et al. 1992, 1993). The bulge region is thought to be the site associated with the S-wave seen in trailed optical spectra. In general there is an increase in temperature across the face of the disc toward the boundary layer at the interface between the disc and the primary. This boundary layer is a source of strong UV radiation. A further source of radiation is illumination of the concave faces of the disc (a property of thin steady state discs) by radiation from the primary and the boundary layer (Shakura & Sunyaev 1973; Frank, King & Raine 1992).
1.2.2
T h e Effect o f a Strong M agn etic Field on A ccretion
1.2.2.1 T he Polar P icture
The magnetosphere is defined as that volume within which the magnetic field domi nates the flow of mass, energy and angular momentum. The radius of the magneto sphere, r^, corresponds to the distance from the centre of the white dwarf to where the magnetic pressure is balanced by the ram pressure of the infalling material:
= pv^
CHAPTER 1. INTRODUCING MAGNETIC CATACLYSMIC VARIABLES 18
non-magnetic CVs until is reached (Liebert & Stockman 1985). Nevertheless the shape and density of the stream is controlled by the magnetic field from the location where the magnetic pressure exceeds the thermal pressure (r > r^). This leads to fragmentation of the stream due to the competing processes of Rayleigh-Taylor and Kelvin-Helmholtz instabilities which causes a spread in azimuth for the threading region (Burnard et al. 1983; Liebert & Stockman, 1985; Hameury et al. 1986a; Lamb & Melia 1986, 1987, 1988). This spread dictates the footprint of the threaded magnetic field lines at the surface of the white dwarf, and hence, to the formation of accretion arcs (e.g. Mukai 1988). The manner in which the stream threads the field lines may lead to a correlation of fragment size and hence to a variation in physical conditions along the length of the accretion arcs (Figure 1.2 illustrates the case where there is a variation in the density of the accreting material along the accretion arc). Single or two pole accretion is dependant on the orientation of the magnetic field to the binary geometry (e.g. Ferrario et al. 1989).
A simplification of this concept is provided by the homogeneous accretion model (also known as the standard accretion column model) in which the accretion stream is depicted as having a circular cross-section with uniform density distribution (Hoshi 1973; Fabian et al. 1976; Masters et al. 1977; Lamb & Masters 1979). The material threads the magnetic field lines smoothly at a very narrow azimuth to impact the surface of the white dwarf with a circular footprint at the magnetic pole. A strong shock forms above this area due to the need for rapid adjustment in physical conditions between the material of the accretion stream which is travelling at supersonic speeds and that of the photosphere of the white dwarf. Figure 1.3.
pho-CHAPTER 1. INTRODUCING MAGNETIC CATACLYSMIC VARIABLES 19
I RWO
SOFT X «AYS
CHAPTER 1. INTRODUCING MAGNETIC CATACLYSMIC VARIABLES 20
M-agnctlC fie ld line
S H O C K
H ard X -ra ys
H o t s u b s o n ic s e t t in g flo w Soft X-rays
and UV w
W h ite d w a rf p h o to s p h e re
CHAPTER 1. INTRODUCING MAGNETIC CATACLYSMIC VARIABLES 21
tons by shocked electrons. The relative importance of each of the cooling mechanisms depends on the postshock conditions, especially the magnetic field and the specific accretion rate. If bremsstrahlung cooling dominates, the ions and electrons are in equilibrium (single fiuid case). On the other hand, if this equilibrium breaks down then cyclotron cooling dominates (two fiuid case), which in extreme circumstances can cause the complete collapse of the shock (Masters 1978).
The spectrum is that of optically thin bremsstrahlung, (typically kT ~30keV), emitted from the accretion column; cyclotron emission, also emitted from the accre tion column, which is optically thick for low harmonics, but optically thin at higher harmonics; and for reprocessed hard X-rays for that fraction which is intercepted by the surface of the white dwarf, such that those 30keV are refiected with the remain der absorbed, thermalised and re-emitted as an approximate blackbody spectrum at UV and soft X-rays energies (usually ~40eV) (Milgrom & Salpeter 1975).
The symmetry associated with this model allows for simplification to a one dimensional problem. Even so, a full computation requires solution of the three hydrodynamic equations of continuity, momentum conservation and energy conser vation with appropriate boundary conditions (for a strong shock and a stellar photo- shere temperature) including time-dependent terms (Cropper 1990). A static model for both the single and two fluid case, which takes into account bremsstrahlung, cy clotron and the reprocessed blackbody emissions, was calculated by Masters (1978). However it omitted consideration of radiation from the side of the column and as sumed uniform temperature and density for the post shock region. Subsequently, the three hydrodynamic equations without the time dependent terms for the one dimensional problem were calculated, e.g. by Imamura & Durisen (1983) (the single fluid case) and Imamura et al. (1987) (the two fiuid case).
1.2.2.2 The IP R epresentation
CHAPTER 1. INTRODUCING MAGNETIC CATACLYSMIC VARIABLES 22
Sh ock C haracicrislics with W hite D w arf M ass
E
I
S h o c k H e ig h t (c m )
1.5-10* 2.0-10*
Effect o f C yclotron C o olin g for M ,j=Q .8M ,
4Q M G
I
«I
I
2 .0 - 1 0 ' 4 .0 -1 0 * 6 .0 -1 0 * «.O' S h o c k H e ig h t (c m )
1 0'
CHAPTER 1. INTRODUCING MAGNETIC CATACLYSMIC VARIABLES 23
of mass transfer depending on whether the magnetic moment is sufficiently low to allow the formation of a disc. A disc will certainly form if is less than the minimum radius depicted by the accreting particles around the primary and it will definitely not form if it is greater than than the circularisation radius (Section 1.2.1). However, the situation is very uncertain between these two extremes (Hameury et al. 1986b, Lamb & Melia 1986, 1987, 1988).
In general the magnetic axis is inclined to the spin axis which makes the asynchronous primary an oblique rotator. In other words, the accretion fiow is time dependent, three dimensional and non-axisymmetric, which is a non-trivial problem, currently unsolved (e.g. Anzer & Borner 1980, 1983; Sprint & Taam 1990). The presence of a disc has profound effects on the magnetic field geometry. Convective and turbulent motions can be set up where the magnetosphere penetrates the disc, Kelvin-Hermholtz instabilities can arise at the interface between the fiow within the disc and the magnetic field (Ghosh & Lamb 1978), and reconnection between the magnetic field of the primary and the disc can occur (Livio & Pringle 1992). These factors lead to a dilution of the primary’s magnetic field in the midplane of the disc (Ghosh & Lamb 1979a,b) and to material and magnetic torques.
It is assumed that the disc in IPs lies in the orbital plane with the material threading onto the magnetic field lines over a range of azimuths at the onset of the magnetosphere. This situation was first modelled by Ghosh and Lamb (1978) for axisymmetric accretion. Figure 1.5, in which they predicted a narrow threading region, depicts the inner limit to which the disc structure is unperturbed by the magnetic field. The co-rotation radius, r^-, is where the angular velocity of the primary and th at of the disc match. Tq marks the outer limit of the boundary layer,
CHAPTER 1. INTRODUCING MAGNETIC CATACLYSMIC VARIABLES 24
factors (see above) which reduce its strength in the midplane, but viscous stresses dominate in this outer transition zone of the disc. In the non-axisymmetric model it is assumed th at the material accretes preferentially to the nearest magnetic pole in a time dependent manner. In this way material from the inner edge of the disc may form curtains of accreting gas to first one and then the other magnetic pole over the spin cycle (Rosen, Mason & Cordova 1988), Figure 1.6 bottom.
Discless accretion in IPs is expected to be similar to that of polars except that the material accretes alternatively to one magnetic pole and then the other with a beat period (Wynn & King 1992, Figure 1.6 top). In such a scenario it is to be expected th at the material impacts the white dwarf over a 360° longitude range and would lead to a lower specific accretion rate covering ~10% of the surface of the white dwarf (Warner 1995).
Disc-overflow is a hybrid mode between disc and stream fed accretion in which the latter flows over the disc to impact directly onto the surface of the primary. Even so, some small percentage of the accretion also takes place from the inner edge of the truncated accretion disc (King & Lasota 1991).
1.2.2.3 C yclotron M odelling
The material in the postshock region of the accretion column is highly ionised and hence the electrons (and ions) depict a helical path due to the force exerted on them by the magnetic field. In consequence, the accelerated electrons emit cyclotron radiation at their gyration frequency of lOq = eB/jrrieC plus all harmonics of this
j. irvTTfKiDC/ciAfG; Af/i(3jVjSjrTC (%/iT:4(:%;yiS7kLrc; 25
SB532533XE35S\W\^<^^^AV\VVV\V.VvV>V>S.\\\X\:
WAGf^ErOSPHCRlC
FLOW TpANSfTIONREGION ^UNPERTURBEDDISK FLOW
OUTER
— tran sition
BOUNDARY ZONE
T^YER
j. frfGrftooc/CfArc; Af/tcïiVjSTfC (%AT)t(:f;yiSA/[r(7 vyij%j/ij3i;E;;s 26
Figure 1.6; Schematics of the flow of material on to the white dwarf in an IP for discless accretion (top) and through an accretion curtain via an accretion disc (bottom). Reproduced from figure 1 of Ferrario (1996).
•I)- 0-25
CHAPTER 1. INTRODUCING MAGNETIC CATACLYSMIC VARIABLES 27
orbital plane of the electron. The observed cyclotron spectrum is created from an aggregate of electrons which possess a distribution of energies; this tends to broaden the spectrum preferentially towards the higher harmonics. The observed polarisation depends heavily on the viewing angle with respect to the magnetic field direction as well as on the effects of cyclotron opacity (decreases towards the higher harmonics) and free-free opacity (dominates where cyclotron opacity is low and as the viewing angle approaches zero). The cyclotron emission can be quantified by the Stokes pa rameters which are a mathematical formulation describing the radiation in terms of its intensity, percentage of circular and linear polarisation, and position angle of the linear polarisation.
The sensitivity of the observed polarised emission to the angle at which the magnetic field line is viewed makes it a very good probe for determining the structure of the postshock accretion region. Cyclotron modelling involves the use of polarisa tion data plus calculations of the transfer of radiation through an accretion column to model the structure of the accretion region.
Meggitt & Wickramasinghe (1982) and Wickramasinghe & Meggitt (1985) cal culated the cyclotron emission from hot plasmas in terms of the electron temperature, frequency, the viewing angle with respect to the magnetic field, the electron number density (A^g), propagation path (s), and the optical depth parameter characterized by A = 1.0 X 10^(s/10®)(A^e/10^® cm“^)(1.8 x lO^G/B) where B is the polar magnetic field strength. Their calculations included allowance for both cyclotron and free-free opacities and were published as a grid of results for a range of values covering a large region of the parameter space.
Af/ic^jvjsirrc (%
AT)i(:%
;yiSA%
rK:7
28
Figure 1.7: Schematic of an MCV showing z, the angle of inclination (the angle between the rotation axis and the line of sight), 0 ; /?, the offset angle of the magnetic dipole-axis from the spin axis; -0, the angle between the line of centres of the stellar components and the projection of the magnetic axis on the orbital plane. Reproduced from Cropper (1988).
CHAPTER 1. INTRODUCING MAGNETIC CATACLYSMIC VARIABLES 29
1.3
T he P rop erties o f Interm ediate Polars
The defining features of an IP are firstly that it is a strong emitter of hard X-rays and secondly that it shows multiple periods (Warner 1995). This latter property is the direct result of the asynchronous rotation of the primary with respect to the orbital cycle. These objects owe their name to their magnetic field strength which lies in a range between th at of the non-MCVs and the strongly magnetic polars. As already stated in Section 1.2.2.2, the strength of the magnetic moment of in the majority of IPs (in contrast to that of the polars, Section 1.2.2.1) is not only insufficient to force the synchronisation of the primary but also to inhibit the circularisation of the accretion stream. Hence the majority of IPs accrete via a truncated accretion disc. These characteristics profoundly affect their behaviour making them observationally quite distinct from both the non-MCVs and the polars. Figure 1.8 is a schematic of an IP system showing the secondary, the accretion (mass transfer) stream, the bulge where this latter impacts on the outer edge of the accretion disc and the magnetic white dwarf. The system geometry of MCVs in general is shown in Figure 1.7.
1.3.1 Fundam ental properties
The magnetic field strength, B, of most IPs is thought to be < 2MG (Warner 1995), but some are considerably higher (< 21MG). Although the majority of IPs are disc accretors, the evidence points to discless accretion for J1712.6-2414 (Buckley et al. 1997) and possibly TX Col (Hellier 1991). However, the latter, together with FO Aqr, may be examples of the hybrid accretion model in which the stream overflows the disc (Section 1.2.2.2).
i. 7Ar]rftc)i)[;ciArG; A4vi(;uvj5:rfc (%/rr:4(:z;yiSA/rrc; so
S e c o n d a r y Inner Disk Accretion Disk
M a s s Transfer
S tream
Bulge Magnetic
Whiite Dwad
Orbital Motron
CHAPTER 1. INTRODUCING MAGNETIC CATACLYSMIC VARIABLES 31
1.3.1.1 The M ass of the W hite Dw arf
CHAPTER 1. INTRODUCING MAGNETIC CATACLYSMIC VARIABLES 32
dwarf mass from 0.45M q for EX Hya to 1.20M q for BG CMi with the mean of
0.85±0.21M q, where M q is the solar mass.
1.3.2
Light C urve Variations
Eruptive behaviour, such as that witnessed in many non-magnetic CVs is also ob served in some IPs. In addition, IPs show large differences in the proportion of time spent in states of higher and/or lower output than normal, as well as in their general short-term variability.
1.3.2.1 X-rays
Those IPs having observational data of sufficient duration show modulation on the orbital period. The amplitude of the modulation increases towards the lower energies thus indicating that the cause is most probably due to photo-electric absorption by obscuring gas (Hellier et al. 1993).
Most IPs emit strongly in the hard X-ray band (2-20keV). In general, these light curves, folded on the spin period, are sinusoidal in profile, but overlaid with energy dependant dips (Warner 1995).
1.3.2.2 Polarised Light
CHAPTER 1. INTRODUCING MAGNETIC CATACLYSMIC VARIABLES 33
al. 1987).
1.3.3
X-ray S p ectrom etry
The majority of IPs have a much higher accretion rate than polars which leads to a hard X-ray luminosity (6 x 10^^ erg s“ ^-l x 10^^ erg s~^ for 2-lOkeV) which is greater than that of polars by a factor of 10-100 (Warner 1995). Successful model fitting usually requires an optically thin plasma component with a kT of 30keV, a cold inhomogeneous absorber component and a component to model the Fe Ka line at 6.4-6.5keV. The upper limit of the temperature is often poorly constrained which may depend on the limited energy range covered by the detectors used, but complex absorption factors can also play a part (e.g. Duck et al. 1994). The equivalent neutral hydrogen column density (7xl0^®cm~^-25xl0^^cm“^) can vary by a factor of two around the orbit (Warner 1995).
Unlike polars the majority of IPs do not show a strong soft component (Wat son 1986; Osborne 1988). However, the observed variation in the amplitude of the modulation in the optical light curves from one cycle to the next is indicative of inhomogeneous accretion at a level reminiscent to that seen in polars. Hence, the generation of EUV and soft X-rays by similar processes to those appropriated to IPs is to be expected; i.e. the reprocessing of hard X-rays (Section 1.2.2.1) and the ther malisation of submerged ’blobs’ of accreting material in the photosphere of the white dwarf (Kuijpers & Pringle 1982). Their apparent absence may be due obscuration by local and interstellar absorption (Warner 1995).
1.3.4
Light C urve M od u lation Scenarios
CHAPTER 1. INTRODUCING MAGNETIC CATACLYSMIC VARIABLES 34
to be very transparent with electron scattering the only likely source of opacity. Importantly, in this model, the minimum of the light curve modulation occurs when the emission site is pointing away from the observer and the accretion footprint covers a substantial fraction of the surface of the white dwarf.
At this time it was thought that IPs were the progenitors of polars and would evolve to polars with synchronisation of the white dwarf. Hence, the magnetic fields of the two populations must be similar, as it was difficult to propose a known physical mechanism by which they could subsequently acquire such a property. Starting from this premise, Hameury et al. (1986b) concluded that the formation of an accretion disc, in IPs with an orbital period <5hrs, was unlikely. They visualised the accretion stream impacting the rotating surface of the white dwarf like a jet from a hosepipe. Raleigh-Taylor and Kelvin-Helmholtz instabilities in the flow would lead to fragmentation into large and small blobs respectively. The accretion stream would intercept along the observers’ line of sight at some orbital phases and its footprint would cover > 10% of the surface of the white dwarf. The expected signature for the modulation was an X-ray pulse lasting for less than half a spin cycle with profiles similar to those proposed by King & Shaviv (1984).
CHAPTER 1. INTRODUCING MAGNETIC CATACLYSMIC VARIABLES 35
F lu x m ax. F lu x m in.
D ISK
Figure 1.9: Schem atic diagram showing a side view illustration of the accretion-
cu rtain model of an IP. The m axim um visibility of the emission region occurs
when the upper pole points away from the observer (Flux m ax.), and the
m axim um atten u atio n of the radiation occurs when th e upp er pole points
tow ards the observer(Flux m in.). R eproduced from figure 13, Hellier et al.
1991.
viewed m ost nearly parallel to th e direction of the m agnetic held lines; i.e. when the
upper hem isphere points tow ards the observer. Figure 1.9 (Flux m in.). T he visibility
of the lower emission region happens 0.5 of a spin cycle later (assum ing a sym m etrical
dipole geom etry) when the absorption in the cu rtain is least, so th a t the m axim um
am plitude in the light curve occurs when th e upper pole is pointing a way from the
observer, Figure 1.9 (Flux m ax.). The emission region covers a sm all fraction of the
surface of the prim ary in this scenario.
Rosen et al. (1988) also described w hat they term ed a hybrid o ccu ltatio n / absorp
tion model in which the emission region is located close to the surface of the white
dwarf. In this case the sym m etry of the emission regions m ust be broken in order for
m odulation to be observed. Heavy absorption of th e emission region below the disc
(e.g. by the inner edge of the accretion disc) can provide the required mechanism,
since it atten u ates the emission preferentially as the rad iatio n energy decreases. In
this model, the m axim um am plitude of the light curve coincides w ith the emission
region above the disc pointing m ost nearly tow ards the observer.
CHAPTER 1. INTRODUCING MAGNETIC CATACLYSMIC VARIABLES 36
CHAPTER 1. INTRODUCING MAGNETIC CATACLYSMIC VARIABLES 37
A
Figure 1.10: Schem atic diagram showing an interm ediate p olar w ith a rela
tively low m agnetic held. A ttenuation of the X-rays is greatest parallel to the
w hite dw arf surface (across the accretion cu rtains), and least along the m ag
netic held lines (up the accretion curtains). X-ray pulse m axim a are seen when
the system is viewed from b oth A and B. R eproduced from hgure 8, N orton
C hapter 2
T he P articip an ts
2.1
Introduction
PQ Gem is an IP which exhibits many unusual and intriguing properties for a MCV of this type. Two of the most notable of these characteristics are a unambiguous soft spectral component (more normally associated with the polars) and spin modulated circular polarisation. The latter implies a strong magnetic field and so, is also more usually associated with the polars. PQ Gem is the protagonist of this work, but by way of comparison, two other IPs which show some similarities to PQ Gem, V405 Aur and RX J1712.6-2414, are also covered. V405 Aur, like PQ Gem, shows a unambiguous soft component (Harberl et al. 1994), but its magnetic field strength is, in general, assumed to be low. On the other hand, RX J1712.6-2414 does not exhibit a soft spectral component, but does have the largest degree of circular polarisation observed in any IP (Buckley et al. 1995, 1997). Moreover, it is the only object of this class, apart from PQ Gem, in which periodic modulation of the polarised light is detected (Sections 1.3.2.2, 2.2.2.1).
CHAPTER 2. THE PARTICIPANTS 39
2.2
PQ Gem or RE J 0 7 5 1 + 1 4
PQ Gem (RE J0751+14) is one of six IPs discovered by the RO SAT Galactic Plane Survey project (Haberl & Motch 1995). Its position (from the optical follow up) is RA (2000) 7^ 51"^ 17.3' Uec (2000) +14° 44' 23" (Mason et al. 1992).
PQ Gem has been classified as an IP due to the observational evidence for multiple periods and strong hard X-ray emission (Section 1.3). In addition to these characteristics it also shows unequivocal circular and linear polarisation in the in frared and R-band as well as strong EUV and soft X-ray spectral components. These properties are more usually associated with polars, which has lead to the proposition that PQ Gem is the first truly intermediate polar (Rosen et al. 1993). This sec tion reviews those system parameters and properties which have a bearing, in some capacity, on the analysis carried out in Ghapter 4.
2.2.1
S ystem Param eters
2.2.1.1 The Mass of the Prim ary
The mass of PQ Gem’s white dwarf has been calculated using several models based on the radial free fall of gas through magnetically controlled accretion (Section 1.3.1.1). The range of masses obtained and the relevant model parameters are given in Table 2.1. The majority of these estimates are comparable to those for other IPs derived from the same model, but high when compared to single white dwarfs (Gropper et al. 1998b). Further estimates of the mass are made in this work using the stratified-accretion-column (Section 1.3.1.1) model and data from the ASCA and R X T E satellites.
2.2.1.2 D istance
CHAPTER 2. THE PARTICIPANTS 40
Mw d{Mq) model Reference
1.29(>1.17) C+G-fPC+refiection Gropper et al. (1999b)
1.21(>1.08) C+G-t-IA+reflection Gropper et al. (1999b)
1.32(>1.15) G-l-IA-t-refiection Cropper et al. (1999b)
1.39(>1.25) H+IA+no reflection Cropper et al. (1998b)
1.35(>1.05) H-l-IA-l-reflection Gropper et al. (1998b)
0.65 analytic solution (closed form) Wu et al. (1995)
0.31 temp: X-ray continuum Ishida (1991)
Table 2.1: Estimates of the mass of the white dwarf in PQ Gem using various models derived from the radial free fall of gas onto the white dwarf through magnetically controlled accretion (Section 1.3.1.1.). In all instances the data used was from the Ginga satellite. The errors (where provided) are to the 90% confidence level with a
CHAPTER 2. THE PARTICIPANTS 41
2.2.1.3 M agnetic Field
The magnetic field, B, of PQ Gem has been estimated on three separate occasions using cyclotron modelling (Piirola et al. 1993, Potter et al. 1997, Howell et al. 1997, Section 1.2.2.3). Piirola et al. (1993) found that the observed polarised fiuxes gave a best fit of B = 18MG when A ~ 10^ and k T ~ lOkeV; and of B = lOMG when the model parameters were set at A ~ 10® and kT ~ 20keV. Consideration of the calculations of Wickramasinghe et al. (1991) for ribbon-like accretion shocks lead them to their final estimate of 8-18MG. Potter et al. (1997) found that the optimal fit to their data with A ~ 10^ and A:T=10keV gave B = 14.0MG. However they obtained acceptable fits for the range B = 9-2IMG, dependent on the initial values of A and T.
Vath et al. (1996) estimated the magnetic field strength by modelling the light curves taking into account the accretion shock structure, i.e. using similar principles as the calculation of the mass of the white dwarf (Section 1.3.1.1). They used a shock temperature of kT ~ 20keV and assumed the structure of the upper and lower emission regions to be the same. They calculated B for a range of values for the mass of the white dwarf, Mw d, and accretion rate, M, using the X-ray fiux as constraint. They found that B = 9-21MG for a M w d = 0.4-0.8M q.
All three estimates give very similar ranges for the magnetic field strength. However, a higher value of Mw d, as indicated by Table 2.1, would result in a lower
B with respect to the last estimate.
2.2.1.4 Periods
CHAPTER 2. THE PARTICIPANTS 42
Rosen et al. 1993, Hellier et al. 1994, Potter et al. 1997, Stavroyiannopoulos et al. 1997).
Optical spectroscopy provides a rich source for system periodicities through the analysis of emission lines. PQ Gem has proved to be no exception in this respect. Radial velocity measurements gave an estimate of the orbital period at 5.18±0.01h (Mason 1995) which is very close to the implied photometric orbital period of 5.19h (Hellier et al. 1994).
An accurate ephemeris is an essential tool to all but the most elementary data analysis. It is only through its knowledge that direct comparisons can be made between the phasing of the light curves from different energy bands and different epochs. Mason (1997) addressed this problem for PQ Gem by including data from a five year period to develop a quadratic X-ray ephemeris. In the soft (< 0.5keV) X-ray (ROSAT) light curves (Figure 2.1) there is a prominent dip with a very narrow core
which varied by as little as 0.034 phase (30s) maximum per spin cycle from its mean position (Mason 1997). This notch can also be seen in the medium X-ray energy band ( <6.0keV) of the Ginga data. Figure 2.1, at roughly the same phase, though its width is around twice that seen in the soft X-rays. Therefore, this dip was chosen as the fiducial marker. The X-ray ephemeris calculated from the Ginga data (Duck et al. 1994) were combined with “the dip” minimum from the RO SAT and ASCA data to give the following quadratic ephemeris (Mason 1997)
HJDx„,„ = 2448173.95714(5) + 0.0096458718(10)Woj,c + 5.24(4) x (2.1)
where Ncyc is the number of spin cycles and the numbers in parenthesis indicate the error in the last decimal places.
The evidence is that this quadratic X-ray ephemeris for the spin cycle is stand ing the test of time. Mason (1997) found it to be entirely consistent with prior optical ephemerides, while Hellier (1997) used I-band photometry data to confirm the ne cessity for a quadratic ephemeris.
CHAPTER 2. THE PARTICIPANTS 43
10
0
06
0 . 4
0. 2 0 4 3 2 1 0 4 3 2 1
I I I I I I I I I I I I I I I r 0 . 1 - 0 . 5 k e V"
\
J \1 KLm I I
1 I I I t I 4 - 1 t [ 1 I I I I I I I t l O . 6 2 . 0 k e V
-«
t I t I I I I I I I I I I I I
/vSv, A
_ A
H
2 - 4 k e V
M i l l !
k' ...
4 — 6 k e V M I I I I I t
3'*
6 - 1 0 k e V
10
1 0 - 1 8 k e V
■M I I I I I I I I I n
2 - 1 8 k e V
0 0 5 1 1 5
Ph as e
Figure 2.1: Phase-folded light curves for the ’soft’ (0.1-0.5keV) and ’h a rd ’ (0.6-
2.0keV) R O S A T P SP C sp ectral bands (top two panels); and five energy-resolved
CHAPTER 2. THE PARTICIPANTS 44
The calculation of the quadratic spin ephemeris (Mason 1997) also provided the rate of change of the spin period, P = +1.1 x 10“ ^°s s“ ^ over the 5 years since 1990. The positive sign indicates that the spin period is lengthening; a finding that is endorsed by results from cyclotron modelling by Potter et al. (1997). V1223 Sge is the only other IP definitely found to be spinning down, though FO Aqr and V533 Her are borderline candidates. Period changes per se are not uncommon amongst IPs; even so, the magnitude of P /P in PQ Gem is almost twice that seen in any other IP. The I-band quadratic spin ephemeris of Hellier (1997) leads to a P / P of 2.5
X 10^ yr which compares favourably to that of 2.4 x 10^ yr found by Mason (1997).
2.2.1.5 O rientation
The system geometry and its presentation with respect to the line of sight of the ob server is an important determinant in unravelling the observed physical phenomena. The crucial geometric parameters are the angle of inclination, i, and the offset angle of the magnetic axis from the spin axis, /? (Figure 1.7). The most accurate estimates of i are provided by eclipsing systems. Nevertheless, in general, observational data can provide clues which lead to less accurate estimates.
CHAPTER 2. THE PARTICIPANTS 45
orientation (Hellier 1997). Nevertheless, consideration of the changes in light curve modulation from the infrared to the hard X-rays indicate that the accretion region faces the observer at the phase of the maximum in the 10-20keV light curve, i.e. at phase 0.11 (Mason 1997).
2.2.2
T h e Light Curves
There is a remarkable constancy in PQ Gem’s light curves as observed from one epoch to another, though there is considerable variation in the amplitude of the modulations from one cycle to the next. PQ Gem has not as yet shown evidence for high/low states or for outbursts such as those which characterize many other IPs and GVs in general (Section 1.3.2). This long term stability is not carried through into the results from polarimetry where there is considerable difference from one observation to the next.
2.2.2.1 X-ray
The soft KOSATPSPG (0.1-0.5keV) light curve folded on the spin period (with “the dip” as fiducial marker) shows a high amplitude modulation (Figure 2.1) with the maximum estimated to occur at phase 0.19±0.05 and the width of “the dip” to be 0.09±0.03 (Duck et al. 1994). In the hard RO SAT PSPC (0.6-2keV) light curve, folded on the spin period, the width of “the dip” is 0.12±0.05 cycles (Figure 2.1).
CHAPTER 2. THE PARTICIPANTS 46
2.2.2.2 Polarised Light
Variable circular polarisation exhibiting both positive and negative signs which peaked at phases ~0.6 and ~0.4 respectively were detected by Potter et al. (1997) for the V through to K bands. The maximum amplitude occurred in the I- and J- bands at a level of ~2%. Previously, variable circular polarisation had been detected in the i?-band (Rosen et al. 1993, Piirola et al. 1993) and in the /-band (Piirola et al. 1993). The results from the cyclotron modelling by Potter et al. (1997) demon strated accretion arcs of equal size positioned diametrically opposite, but ahead of the poles. The arcs extended in magnetic longitude from 60°-200° with an elon gation of 20° towards the magnetic equator. In magnetic latitude they extended from 12°(longitude 60°)-32° (longitude 200°). The orientation and phasing of these arcs within the spatial reference frame of the white dwarf is shown in Figure 2.2 (reproduced from Potter et al. 1997, figure 9).
Howell et al. (1997) used the same model with minor adjustments to analyse their polarimetry data. They needed to introduce asymmetric arcs and extend them by longitude 20° and latitude 30° to obtain good fits between the calculated and observed data. They were unable to resolve the discrepancy between the model’s position angle range of 180° and their data which exhibited a position angle between 50°-60°.
Linear polarisation varying between -80° and -1-90° in both the I- and R- bands was detected by Piirola et al. (1993) which indicated that at least some polarisation emanated from within the system.
2.2.3
X -ray S pectroscopy
CHAPTER 2. THE PARTICIPANTS 47
0.1 0.2 0 .3 0 . 4 0 .5
0.6 0 .7 0.8 0 .9 1.0
U p p e r Lower
Figure 2.2: Illustratio n of the upper and lower accretion arcs on the surface of the
w hite dw arf as com puted from cyclotron m odelling of P Q Gem (Section 2.2.2.2)
a t consecutive phases of the spin period. T he b o tto m two globes give the view as
seen from directly above the top and bo tto m poles respectively. T he diam onds
CHAPTER 2. THE PARTICIPANTS 48
Model fitting separately to the RO SAT (0.1-2.5 keV) data showed it to be dominated by a powerful soft component of blackbody temperature 20-60eV. This confirmed the results of Mason et al. (1992) who found an S1/S2 ratio of > 3.2 (90% confidence) indicating a soft source spectrum cut off by absorption. Nevertheless, there is no evidence for a soft excess, since the Lb b/[L bremss + Lcyd) ~ 0.55 which is consistent with the spectral distribution of PQ Gem (Mason 1995).
It was not possible to constrain the upper limit to the temperature of the Ginga data during the spectral fitting, therefore they fixed it at 20.0keV. This temperature was identified during a separate model fitting exercise by restricting the spectrum to >10keV thus eliminating those energies most effected by absorption.
The spin phase-resolved spectroscopy demonstrated that the maximum emis sion from both the blackbody and the thermal bremsstrahlung components coin cided with the light curve maximum, but were only marginally less during “the dip” phase. The Nh, column density, parameter of the cold inhomogeneous absorption
component varied between 7.7x10^^ cm“^-13.6xl0^^ cm“^ and its covering fraction between 0.55-0.81 with maximum attenuation during the “dip” . Both the emis sion and the absorption tended to their minimum values during the minimum and secondary maximum phases.
The authors concluded that the rotational modulation is probably due to a combination of occultation of a large emission region and absorption in the accre tion flow associated solely with “the dip” . The absence of a soft X-ray excess they attributed to homogeneous accretion.
2.2.4
A ccretion
CHAPTER 2. THE PARTICIPANTS 49
addition, he suggests that the orbital S-waves arise from the impact of the accretion stream with a disc (Section 1.2.1).
The spin-down condition implies that m atter is being threaded (Section 1.2.2) outside the co-rotation radius (Section 1.2.2.2) so that the resulting torques act to slow down the rotation rate of the white dwarf. If this is the case, then it runs contrary to the Ghosh and Lamb standard accretion model (Section 1.2.2 & Figure 1.5). However, as stated in Chapter 1, this model pertains to an aligned rotator; whereas there is evidence from the polarimetric analysis of Piirola et al. (1994) and Potter et al. (1997) th at PQ Gem is an oblique rotator.
The width of “the dip” at 0.4 spin cycles (Duck et al. 1994) and 40° (Howell et al. 1997) favour the accretion curtain model as the means of transport for material from the inner edge of the disc to the accretion impact site. In addition the extension of the accretion arcs towards the orbital plane (cyclotron modelling results) implies that the threading takes place over a range of radii (Potter et al. 1997). Further more, the phase lag of 0.11 spin cycles between “the dip” and the maximum from the
10-20keV light curve indicates that the accreting material impacts the white dwarf at 35°-40°, i.e. the magnetic field lines are twisted (Figure 2.3, reproduced from figure 6, Mason 1997). Doppler tomograms of optical emission lines also show that the accretion curtain is 30°-50° ahead of the impact site (Hellier 1997) as does the cyclotron modelling of Potter et al. (1997). An extended accretion area on or near to the white dwarf surface is indicated by the lack of Lyman absorption lines and the flat continuum (FUV) (Cash et al. 1998). All these factors plus the flickering effects visible in the light curves are symptomatic of inhomogeneous accretion (Sec tion 1.2.2.1) and hence belie the homogeneous accretion model suggested by Duck et al. (1994).
2.2.5
W hy is P Q G em so Special?
CHAPTER 2. THE PARTICIPANTS 50
Flux maximum Dip minimum
Figure 2.3: Inferred geom etry of m agnetic field lines along which m a tte r is accreting
in PQ Gem. T he system is drawn a t an orbital inclination of 60° and w ith a dipole
offset of 30°, these being the best fit values deduced by P o tte r et al. (1997) from
m odelling the polarisation light curves. Only held lines which lie ahead of the
m agnetic pole in the spin cycle are shown and the s ta r is ro tatin g in a clockwise
direction as seen from above the o rb ital plane. T he two views are sep arated by
30° in spin phase and show the expected geom etry a t the m iddle of the soft X-ray
dip and the phase of m axim um X-ray light respectively. R eproduced from hgure 6,
CHAPTER 2. THE PARTICIPANTS 51
an “intermediate” polar. However, PQ Gem has many other unusual characteristics which are unrelated to typical polar attributes; for example, the double peaked spin pulse which is seen not only in the X-ray band, but also in the I- and R-bands, as well as its relatively high rate of spin-down. Nevertheless, the long list of PQ Gem’s properties which map to typical IP attributes serve to emphasize the correctness of its IP classification. It is probably truer to state th at it is the wide range of exceptional properties which makes PQ Gem so special rather than just its potential to bridge the IP and polar MCV classes.
2.3
V 405 Aur or R X J0558-I-53
The IP V405 Aur (RX J0558-I-53) was also discovered by the RO SAT Galactic Plane Survey project (Haberl & Motch 1995). Its position is RA (2000.0) 05^ 58^ 0.1* Dec (2000.0) -1-53° 53' 58.9" with an error radius 9" (68% confidence) (Haberl et al. 1994).
2.3.1 S ystem Param eters
The spin period of V405 Aur was initially identified as 272.744:0.02s from the ROSAT PSPC data (Haberl et al. 1994), but subsequently a pulse at half this frequency, i.e. a period of 545.4556±4.32xl0“^s, was discovered in optical data (Allan et al. 1996). These data were used to calculate an optical spin ephemeris of
HJDmax = 2449681.46394(6) + 0.006313143(5) x E (2.2)
The epoch corresponds to the pulse maximum preceding the deeper of the two minima seen in the optical light curves (Figure 2.4). The orbital period was determined at 4.15h (Allan et al. 1996), and the beat period was calculated to be 565.8s (Harlaftis & Horne 1999).
CHAPTER 2. THE PARTICIPANTS 52
Figure 2.4: Spin phase-folded light curves of V405 A ur for optical waveband (left-
hand figure) and the ’soft’ (0.1-0.5keV) and ’h a rd ’ (0.6-2.0keV) R O S A T P S P C
spectral bands (right-hand figure, top and b o tto m plots respectively). R epro
duced from Allen et al. (1996), figures 2 & 4.
Soft X-m y (0 .1 -O J k#V)
1.5
CHAPTER 2. THE PARTICIPANTS 53
& Motch 1995) suggest that B is much closer to that of PQ Gem, because of their similar hard bremsstrahlung to soft blackbody component flux ratios (Ramsay et al. 1994). This is supported by the reported detection of periodic variations in circular polarisation on the 544.4s ± 4.8s period and possibly that corresponding to 2lu (1st harmonic of the spin frequency) by Shakhovskoj & Kolesnikov (1997). The mass of the white dwarf has been calculated at 1.1 M q using data from R X T E and a stratifled-accretion-column model (Ramsay 2000).
2.3.2
X -ray Light Curves
The RO SAT “soft” X-ray (0.1-0.5keV) light curve (Figure 2.4) shows the very dis tinct double peaked emission which lead to the initial misidentiflcation of the spin period at 272s. Allan et al. (1996) proposed the weak magnetic fleld/fast'rotator model (Section 1.3.4) as an explanation for the observed double pulse in the optical and ROSAT 0.1-0.5keV light curve. On the other hand, the RO SAT “hard” X-ray (0.7-2.0keV) light curve (Figure 2.4) is more or less single peaked (Haberl et al. 1994).
2.3.3
X-ray S pectroscopy
CHAPTER 2. THE PARTICIPANTS 54
this was a typical expected temperature for an IP. Not only did the normalisation of this component vary very little over the 272s period, but it was also possible to model the absorption by a fixed column density of 6x10^° H cm“^.
2.3.4
A ccretion Scenario
Accretion via disc overflow has been suggested by two authors: by Harlaftis & Horne (1999), due to the presence in the emission lines of their optical data of the 2[u)-Et) and 2uj pulses, but without a (2cj-f^) pulse [uj is the spin frequency, Q is the orbital frequency and (w-f2) is the beat frequency), and by Still et al. (1998), because their data showed double peaks in Ha line profiles together with the absence of a beat pulse. On the other hand, Allan et al. (1996) suggested that the lack of orbital modulation in their data implies a system of moderate to low inclination with accretion through a disc. Both Harlaftis & Horne (1999) and Still et al. (1998) find evidence for accretion onto both poles.
2.4
R X J1712.6-2414
RX J1712.6-2414 is one of the six IPs discovered by the RO SAT Galactic Plane Survey project (Haberl & Motch 1995). Its position is RA (2000.0) 17^ 12"^ 35.94^ Dec (2000.0) -24° 14' 41" within a statistical error radius of 6" (Buckley et al. 1995).
The emphasis of previous research on RX J1712.6-2414 has concentrated on distinguishing and establishing the values of the beat and spin period as well as using the results from photometry, polarimetry and spectroscopy to determine the most probable system orientation, the mode of accretion and the magnetic field strength.