Article
1
Trust and Distress Prediction in Modal Shift
2
Potential of Long-Distance Road Freight in
3
Containers: Modelling Approach in Transport
4
Services for Sustainability
5
Elżbieta Szaruga 1 , Elżbieta Skąpska 2,* , Elżbieta Załoga 3 and Wiesław Matwiejczuk 4
6
1 University of Szczecin, Faculty of Management and Economics of Services, Department of Quantitative
7
Methods; Cukrowa 8 Street, 71-004 Szczecin, Poland; [email protected] (ESZ)
8
2 Bialystok University of Technology, Faculty of Management Engineering; Division of Managerial
9
Economics; 2 Ojca Tarasiuka Street, 16-001 Kleosin, Poland; [email protected] (ES)
10
3 University of Szczecin, Faculty of Management and Economics of Services, Department of Policy and
11
Transport Systems; Cukrowa 8 Street, 71-004 Szczecin, Poland; [email protected] (EZ)
12
4 Bialystok University of Technology, Faculty of Management Engineering; Department of Production
13
Management; 2 Ojca Tarasiuka Street, 16-001 Kleosin, Poland; [email protected] (WM)
14
* Correspondence: [email protected]; Tel.: +48-500-227-183
15
16
Abstract: Confidence in intermodal transport has not yet been defined. There are many different
17
approaches to the concept of trust. However, the authors embedded them in the light of the
18
challenges of sustainability, linking with the shift paradigm. The objective of the article is to indicate
19
the directions and criteria for the implementation of the shift paradigm, inscribed in the idea of
20
sustainable transport. The auxiliary objective is to predict which countries in a given year will have
21
the TRUST status, i.e. implement the shift paradigm, and which will not implement it (DISTRESS).
22
The article uses taxonometric techniques and built a model using General Discriminant Analysis.
23
On their basis, the utility function was approximated, including the directions of implementation of
24
the shift paradigm depending on the scale of the environmental load of transport. In the course of
25
the research, an original and innovative econometric model was constructed, pointing to three
26
variables, which had the greatest impact on trust. Thanks to the cognitive value of the model, it is
27
possible to identify individuals who deserve the trust, i.e. it will implement the shift paradigm, with
28
93% probability. In the future, it is worth expanding the research by models for each country.
29
Keywords: sustainability; trust; distress; transport services; road freight transport; modal shift
30
potential; shift paradigm; modelling; prediction; General Discriminant Analysis
31
32
1. Introduction
33
The article focuses on an extremely important subject of trust and distress prediction in modal
34
shift potential of long-distance road freight in containers. An attempt was made to define the concept
35
of trust in the context of the modeling approach in transport services, including the concept of
36
sustainability and the shift paradigm. For the purposes of the article, the main hypothesis was
37
formulated: trust and distress in the implementation of the shift paradigm (based on cooperation)
38
depends on the scale of the environmental burden of transport (production and consumption
39
patterns). Expanding, it can be considered that quantitative predictors express the environmental
40
burden of transport. The aim of the article is to indicate the directions and criteria for the
41
implementation of the shift paradigm, inscribed in the idea of sustainable transport. The auxiliary
42
goal is to predict which countries in a given year will have the TRUST status, i.e. implement the shift
paradigm, and which will not implement it (DISTRESS status). The structure of work is subordinated
44
to these purposes, which consists of 5 main parts: first – introduction; second – literature background,
45
where the literature review was done: the concept of trust was discussed, interpretation of sustainable
46
development and the shift paradigm were given. The third part describes the test methods used and
47
presents the research stages. The fourth part presents innovative, original research - econometric
48
model (GDA) along with utility profiles. The article ended with a discussion.
49
2. Literature background
50
Every economic relationship is linked to trust, which is an essential link of services, especially
51
transport. The complexity and dynamics of the real economic sphere requires, on the one hand,
52
cooperation and trust, on the other, it creates an economic distress. Therefore, the semantic
53
delimitation of the term "trust" for classic and innovative approaches is necessary. The first one is
54
associated with a subjective measure, a repeating pattern. The second one takes into account new
55
criteria. Selected literature items were used in terms of the economic environment. Traditionally, trust
56
means a way to deal with social uncertainty and complexity [1]. Confidence is a higher value and
57
increases efficiency. This is a phenomenon that in economics is called external effects [2]. Thus, they
58
can be formulated as an expectation that is formed in a community about the regular, honest and
59
cooperative behavior of other members of the community based on commonly recognized norms [3].
60
In addition, it is the expectation that the partner can be relied on and that he will keep his
61
commitments in a predictable way and that he will act honestly in the face of various possibilities [4].
62
Trust imposes on the person of trust the obligation to keep the promise. What counts is the attitude
63
of keeping the promise, the oath as honoring your own declaration of will [5], thus convincing one
64
party of the relationship that the other party will not act against your interests, accepted without
65
doubts and suspicions in the absence of detailed information about the other party's actions [6]. To
66
respect the principles of many people in response to the need for a complex society. Trust is also the
67
conviction that a business partner will take care not only of his or her interest to maintain the
68
exchange relationship [7]. It is also a belief based on moral obligations [8]. Kramer dissociates himself
69
from the recognition of trust as a belief, treating it as a compatible decision with ethical expectations
70
[9]. It is an expression of free will.
71
Then, the literature recognizes the context of the approach to trust, e.g. from the side of the
72
consumer, manager or the whole organization. On the one hand, it means the regulator of decisions
73
made by consumers on the market [10] and the consumer's expectation that his weaknesses will not
74
be used in a situation considered risky [11]. On the other hand, the manager's faith in the strength
75
and capabilities of his subordinates [12]. It is also a factor enabling organizations to face the
76
complexity and changeability of economic reality [13]. A component of customer relations in the logic
77
of service dominance in the concept of managing a promise [14]. A directed relation between two
78
units: trusting and a trustee with risks [15]. Social aspect of the relations connecting participants of
79
economic life [16]. The capital of credibility is the sum of the resources of economic and social benefits.
80
The plant is made about uncertain future actions of people is a key factor in the relationship [17].
81
Consumer confidence the reliability and integrity of online resellers that lead to a successful
82
transaction (via the Internet) [18]. Believing that a trustworthy person is motivated by good intentions
83
and that he is capable of fulfilling what is expected of him [19]. Trust is organizational value, which
84
requires strong ethical foundations [20]. On the one hand (rational) means the assessment of
85
competence and credibility and the possibility of relying on the other person; on the other (affective))
86
- is the result of emotional ties created between cooperating people [21].
87
An innovative approach to trust captures them as a balance of strategic interaction (moral hazard
88
and uncertainty in political activities) between agents and policy makers with incentives for
89
deviations [22]. A key element of society playing a key role in creating interaction and relationships
90
in the context of a platform and service peer-to-peer [23]. Derivative of the personality of the
91
individual and perceived object reliability [24]. Faith to others in providing accurate assessments due
92
to the preferences of the active user. Global trust is the average opinion of the whole community
93
about the credibility of the user [25]. Relying on others not to be used. On the other hand, being
trustworthy means that you do not use others for lack of satisfaction [26]. Confidence is influenced
95
by intensively and dynamically diverse factors that appear in diverse environments, by the
96
environment of the economic entity and the individual. For example, citizens' trust in local
97
government authorities. The level of attachment to tourist events affects perception and emotional
98
reactions, creating support based on the theory of social exchange and cognitive theory of assessment
99
[27]. The main difference in the perception of trust in traditional and modern style is the distinction
100
of relationships.
101
Modern global trust models include user reputation calculations, and almost historically local
102
trust models define trust between two users based on their previous interactions. Confidence in
103
classical interpretation usually means expectation, conviction. In turn, in the novel approach -
104
promise. A common element in the various definitions of trust is the intention to accept sensitivity
105
based on positive expectations. A look at trust in transport services requires taking into consideration
106
at least two points of view: the client's perspective and the perspective of the carrier, and the type of
107
transport and the content of transport, i.e. passengers, freight. Taking into account the definitions of
108
trust for the purposes of this article, the authors created a definition referring to the specificity of
109
transport as close to Di Maggio [28] and Bachmann, Zaheer [13] treating trust as a factor enabling
110
enterprises to better use the opportunities created by a variable security-based environment the flow
111
of goods and people XXX is therefore a condition enabling organizations to face the complexity and
112
volatility of economic reality. Furthermore, trust is based on the honoring of commitments and is a
113
factor in facilitating the use of new opportunities provided by the changing environment [28].
114
Trust-related values are characteristics of service providers in relation to rational action, in
115
accordance with the Order of relations assigned to human-focused services. Among these traits, it
116
should distinguish between compulsiveness, accountability, credibility and a sense of mission
117
[background of my new "Connecting thoughts": The value in combination with trust is the
118
characteristics of service providers towards rational action, according to the Order of relationship,
119
assigned to human-oriented services. Among these traits are dutifulness, accountability, credibility,
120
a sense of mission – ed.]. The desired direction depending on the idea of Ordo is to shape the order
121
corresponding to the human nature, without which it is difficult or impossible to provide services
122
[29].
123
On the background of the presented positions, it is, in particular, important to place the issue of
124
trust in transport. The problem of transport trust is raised in the studies by Ivuts and Matwiejczuk,
125
paying special attention to the contemporary complexity and multidimensionality of the transport
126
process as well as delivery time, which is considered one of the key factors determining the quality
127
of transport services. The attractiveness of freight traffic is a fairly complex process, including services
128
of various types of transport, forwarding services, handling of cargoes and their storage at terminals,
129
etc. [30]. However, future-oriented, modern processes, including transport, require a continuous flow
130
of information in order to constantly develop knowledge [31]. But with regard to the movement of
131
goods, services and manpower there are still many untapped possibilities for changing and extending
132
economic activity. One of the solutions that can help to improve the business environment and
133
economic growth is to ensure a unitary market [32].
134
As notes by Załoga, in the context of the socio-economic and political integration of the EU,
135
liberalization is an appropriate method for the creation of a unitary market for transport services [33].
136
Regulation of the EU's transport services market mainly relied on economic regulation of a structural
137
nature (conditions for market access and the occupation of the carrier), which influenced the shaping
138
of the supply side of services [33]. However, the interest in social regulation has increased in recent
139
years. It has been caused by concern for the environment in a global sense, the need to ensure the
140
safety of transport and its users. As added by Załoga, economic and social regulations often seek to
141
exclude and even conflicting objectives [33]. Sustainability is based on the principle of harmonization
142
of objectives (economic, environmental and social) and long-term actions with short-term decisions.
143
Sustainability is linked to the need for development programming [34]. Alleviating these conflicting
144
objectives is conducive to sustainable transport policies, derived from the idea of sustainable
145
development [33]. One of the paradigms of sustainable transport is the shift paradigm, so-called
modal shift. This paradigm is the expression of new patterns of production and consumption of
147
services, relevant to environmental constraints [33]. Załoga notes the three conditions for the
148
adoption of this paradigm in EU transport policy [33]:
149
1. The need to halt the dominance of road transport in the transport needs of society and the
150
economy- road transport is characterized by a relatively high environmental impact and affects
151
the barriers to supply of services of modals (congestion, occupancy of area).
152
2. Convinced of the occurrence of high-substitutability services of inland (road and rail) and water
153
transport.
154
3. Conviction of high complementarity between modals and means of transport.
155
In principle, the shift paradigm refers to two types of shifts [33]:
156
• freight - from road transport to water or rail transport;
157
• people/passengers - from the use of passenger cars for public transport.
158
From a shift paradigm perspective, the functionality of complementary transport is important.
159
Land transport (road and rail) is a condition for the operation of air and water transport, as it links
160
these transport modals with their target markets [35]. Therefore, the question of cooperation and trust
161
plays an important role.
162
According to Kożuch and Sienkiewicz-Małyjurek, the phenomenon of cooperation between
163
organizations derives from the necessity of cooperation, goodwill, commitment and trust [36]. This
164
approach should in principle serve as a basis for the implementation of the paradigm of shift. Moreover,
165
in addition-from an analytical perspective-may be the approach of Jabłoński [37]. He points out that
166
when performing multidimensional analysis, attention should be paid to the importance of public
167
trust in value building. Trust becomes a determinant of the relationship between individual
168
stakeholders and the audience of public value development [37]. These groups may be referred to all
169
transport users, including shift paradigm implementers and recipient services formed by the
170
realization of this paradigm.
171
Therefore, the study of modal shift potential of long distance road freight in containers seems to
172
be quite interesting in this context. There have not yet been any author's studies in which this research
173
object was examined in relation to the trust modelling.
174
175
3. Data, Methods & Steps
176
In order to carry out the study on trust and distress prediction in modal shift potential of
long-177
distance road freight in containers, the secondary data from Eurostat [38] and OECD.Stat [39]
178
databases were used. It was assumed that the research period is 2011-2015. The beginning of the
179
research period coincides with the year of publication of the final "White Paper: Roadmap to a Single
180
European Transport Area – Towards a competitive and resource efficient transport system" [40] and end of
181
this period-last updated data. Sixteen countries were included: Bulgaria, Czech Republic, Finland,
182
France, Hungary, Latvia, Lithuania, Luxembourg, Netherlands, Poland, Portugal, Slovak Republic,
183
Slovenia, Spain, Sweden, United Kingdom. The choice of countries was deliberate by reason of the
184
European territory and was dictated by the quality, completeness and availability of the data during
185
the analysis period. The following designations and abbreviations for the representative variables
186
used in the paper have been adopted1:
187
Trust: one of the dichotomous values for the DT variable for trust status, corresponds with
188
value equal to 1;
189
Distress: one of the dichotomous values for the DT variable for distress status, corresponds with
190
value equal to 0;
191
DT: qualitative dependent variable with vector-encoded (dummy variable); takes value
192
equal to “Trust” (trust status, not distress) or “Distress” (distress status, not trust); to
193
specify the value, the data from Eurostat database for modal shift potential of
long-194
distance road freight in containers [tran_im_mosp] were used (percentage of total tkm).
195
In the event that this structure ratio has not increased in relation to the reference period
196
(2011), the variable DT was equal to "Trust" (1); if it increased, then it took the value
197
equal to "Distress" (0);
198
TS: continuous predictor; modal shift potential of long-distance road freight in containers
199
(in percentage of total tkm); data from Eurostat database [tran_im_mosp];
200
RFTG: continuous predictor; road freight transport (in tkm per 1000 units of current USD GDP);
201
data from OECD.Stat [..IND-Meas-Roadgood-GDP];
202
SRFT: continuous predictor; share of road freight transport in total inland freight transport (in
203
percentage); data from OECD.Stat [..IND-Meas-Roadgood-Share];
204
CO2EG: continuous predictor; CO2 emissions from transport (in tonnes per 1 000 000 units of
205
current USD GDP); data from OECD.Stat [..IND-Ene-GDP];
206
SCO2: continuous predictor; share of CO2 emissions from road in total CO2 emissions from
207
transport (in percentage), data from OECD.Stat [..IND-Ene-Road];
208
ENRTG: continuous predictor; motor fuel deliveries (in tonnes per 1 000 000 units of current USD
209
GDP); data from OECD.Stat [..IND-Ene-Fuel-GDP].
210
Mainly, taxonometric methods and Generalized Discriminant Analysis (GDA) were used in this
211
paper (in-depth research using these methods was carried out by: Zioło, Porada-Rochoń & Szaruga
212
[41]).
213
The first step in the study is to identify the status (trust/distress) of each country and year on the
214
basis of the criterion described above [Table 1]. It has been assumed that EU countries that implement
215
the shift paradigm (in the sense of year to 2011), which are inscribed in the sustainable transport
216
policy, can be called the TRUST. Those that do not realize it (in the sense of year to 2011), and the
217
name DISTRESS.
218
Table 1. Countries and years with trust status and distress status in modal shift potential of
long-219
distance road freight in containers for selected European countries
220
Country 2011 2012 2013 2014 2015
Bulgaria Trust Trust Trust Trust Trust
Czech Republic Trust Distress Distress Trust Trust
Finland Trust Distress Trust Distress Trust
France Trust Trust Distress Distress Trust
Hungary Trust Distress Distress Distress Distress
Latvia Trust Distress Trust Trust Trust
Lithuania Trust Distress Distress Distress Trust
Luxembourg Trust Distress Trust Trust Trust
Netherlands Trust Trust Trust Trust Trust
Poland Trust Trust Distress Distress Trust
Portugal Trust Trust Trust Trust Trust
Slovak Republic Trust Trust Trust Trust Trust
Slovenia Trust Distress Trust Trust Distress
Spain Trust Trust Distress Trust Trust
Sweden Trust Trust Distress Trust Trust
United Kingdom Trust Distress Trust Trust Trust
Source: own elaboration based on data from Eurostat [tran_im_mosp]
221
http://ec.europa.eu/eurostat/data/database (access: 02/05/2018).
222
As indicated in Table 1, Bulgaria, Netherlands, Portugal and Slovak Republic had a trust status
224
throughout the entire period considered, which means that they implemented the principles of the
225
shift paradigm in 2011-2015. Hungary, which in the years 2012-2015 had distress status relative to the
226
shift paradigm, remains in that context. Among the countries that were marked with the distress
227
status in only one calendar year were: Latvia, Luxembourg, Spain, Sweden and United Kingdom.
228
Apart from the reference year, the year 2011 was characterized by the highest number of states with
229
the status of trust (87.5%), the situation was bad in 2012 - as much as 50% of analyzed countries with
230
the status of distress.
231
The next stage of the study consisted in classifying the examined countries into clusters due to
232
similar features. For this purpose, the k-means algorithm was used (taking into account
233
standardization, the measure of Euclidean distance and maximization of cluster distances from initial
234
centers). Previously conducted test using a test sample, where it was assumed that the minimum
235
number of clusters is 1, and the maximum is 16; the minimum decrease is 5%. As a result of the
236
clustering properties assessment, only one cluster was verified and the distances from the center of
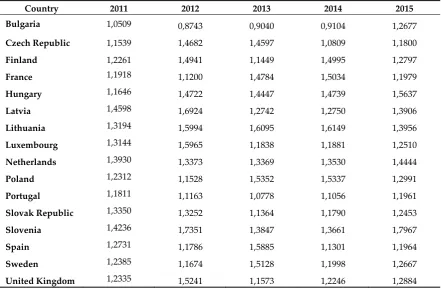
237
the cluster were estimated (Table 2).
238
Table 2. Distance from the center of the cluster
239
Country 2011 2012 2013 2014 2015
Bulgaria 1,0509 0,8743 0,9040 0,9104 1,2677
Czech Republic 1,1539 1,4682 1,4597 1,0809 1,1800
Finland 1,2261 1,4941 1,1449 1,4995 1,2797
France 1,1918 1,1200 1,4784 1,5034 1,1979
Hungary 1,1646 1,4722 1,4447 1,4739 1,5637
Latvia 1,4598 1,6924 1,2742 1,2750 1,3906
Lithuania 1,3194 1,5994 1,6095 1,6149 1,3956
Luxembourg 1,3144 1,5965 1,1838 1,1881 1,2510
Netherlands 1,3930 1,3373 1,3369 1,3530 1,4444
Poland 1,2312 1,1528 1,5352 1,5337 1,2991
Portugal 1,1811 1,1163 1,0778 1,1056 1,1961
Slovak Republic 1,3350 1,3252 1,1364 1,1790 1,2453
Slovenia 1,4236 1,7351 1,3847 1,3661 1,7967
Spain 1,2731 1,1786 1,5885 1,1301 1,1964
Sweden 1,2385 1,1674 1,5128 1,1998 1,2667
United Kingdom 1,2335 1,5241 1,1573 1,2246 1,2884
Source: own calculation based on data from Eurostat [tran_im_mosp] http://ec.europa.eu/eurostat/data/database
240
and OECD.Stat [Meas-Roadgood-GDP; Meas-Roadgood-Share; Ene-GDP;
..IND-241
Ene-Road; ..IND-Ene-Fuel-GDP] http://stats.oecd.org/ (access: 02/05/2018).
242
243
By means of estimated Euclidean distances from the center of the cluster using the k-means
244
method, it can be concluded that in no year did any of the countries significantly differ from each
245
other due to the studied statistical features. No outliers were noticed either. Therefore, all years and
246
all countries can be included in one model without the need to divide the sample into smaller ones.
247
The next stage of the research is the evaluation of the variability of the variables under
248
investigation, and then the estimation of the model parameters using GDA. After positive verification
249
of the model - for the desired properties, an approximation of the utility function should be made. To
250
this end, the utility function for TRUST has been defined:
251
• low - for 0.00, utility is 0.00,
• indirect: for 0.50, utility equal to 0.5,
253
• high: for 1.00, utility 1.00,
254
whereby optimum values have been given to the factors. The curvature of s (low) is equal to 1.00 and
255
t (high) is equal to 1.00. The inverse range would have the usability function for DISTRESS-for low
256
value high usability, and for high value of low usability. In practice, it only means replacing colors
257
on the service contour profiles of scenarios [see part 3 of paper]. The test culminates in obtaining
258
profiles for posteriori and utility probabilities. Empirical results are shown in the following section.
259
260
4. Empirical results
261
Table 3 shows the basic descriptive statistics for the variables examined. The data shows that the
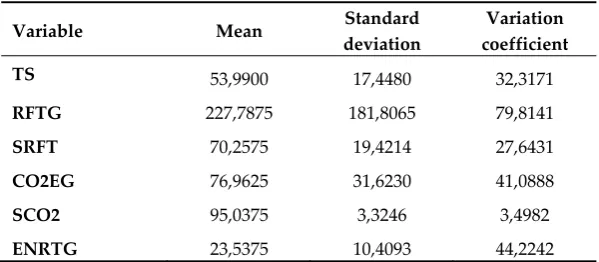
262
greatest variability (in the spatial-temporal dimension) characterized the variable RFTG, and the
263
smallest SCO2. The variability in the spatial-temporal dimension of the remaining variables was at a
264
predictable level of 30-40%.
265
266
Table 3. Basic descriptive statistics for cluster
267
Variable Mean Standard
deviation
Variation coefficient
TS 53,9900 17,4480 32,3171
RFTG 227,7875 181,8065 79,8141
SRFT 70,2575 19,4214 27,6431
CO2EG 76,9625 31,6230 41,0888
SCO2 95,0375 3,3246 3,4982
ENRTG 23,5375 10,4093 44,2242
Source: own calculation based on data from Eurostat [tran_im_mosp] http://ec.europa.eu/eurostat/data/database
268
and OECD.Stat [Meas-Roadgood-GDP; Meas-Roadgood-Share; Ene-GDP;
..IND-269
Ene-Road; ..IND-Ene-Fuel-GDP] http://stats.oecd.org/ (access: 02/05/2018).
270
271
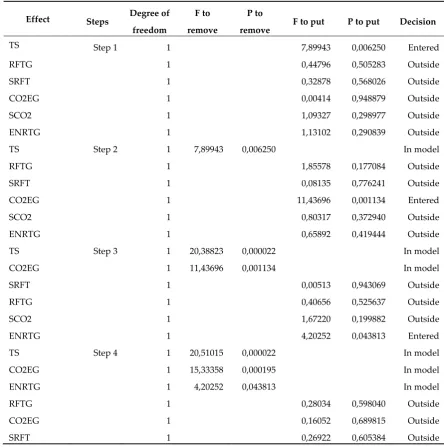
Table 4 provides summary of multiple regression (stepwise progressive). In four stages it was
272
possible to determine the variables included in the model and excluded from it. Only three variables
273
were significant from the point of view of the conducted study, i.e. TS, CO2EG, ENRTG. Therefore,
274
the parameters of General Discriminant Analysis (GDA) were evaluated further with all effects in
275
next stage.
Table 4. Multiple regression summary (stepwise progressive)
278
Effect Steps Degree of freedom
F to
remove
P to
remove F to put P to put Decision
TS Step 1 1 7,89943 0,006250 Entered
RFTG 1 0,44796 0,505283 Outside
SRFT 1 0,32878 0,568026 Outside
CO2EG 1 0,00414 0,948879 Outside
SCO2 1 1,09327 0,298977 Outside
ENRTG 1 1,13102 0,290839 Outside
TS Step 2 1 7,89943 0,006250 In model
RFTG 1 1,85578 0,177084 Outside
SRFT 1 0,08135 0,776241 Outside
CO2EG 1 11,43696 0,001134 Entered
SCO2 1 0,80317 0,372940 Outside
ENRTG 1 0,65892 0,419444 Outside
TS Step 3 1 20,38823 0,000022 In model
CO2EG 1 11,43696 0,001134 In model
SRFT 1 0,00513 0,943069 Outside
RFTG 1 0,40656 0,525637 Outside
SCO2 1 1,67220 0,199882 Outside
ENRTG 1 4,20252 0,043813 Entered
TS Step 4 1 20,51015 0,000022 In model
CO2EG 1 15,33358 0,000195 In model
ENRTG 1 4,20252 0,043813 In model
RFTG 1 0,28034 0,598040 Outside
CO2EG 1 0,16052 0,689815 Outside
SRFT 1 0,26922 0,605384 Outside
Source: own calculation based on data from Eurostat [tran_im_mosp] http://ec.europa.eu/eurostat/data/database
279
and OECD.Stat [Meas-Roadgood-GDP; Meas-Roadgood-Share; Ene-GDP;
..IND-280
Ene-Road; ..IND-Ene-Fuel-GDP] http://stats.oecd.org/ (access: 02/05/2018).
281
282
The analysis of standardized coefficient β (beta) shows that the strongest influence on the
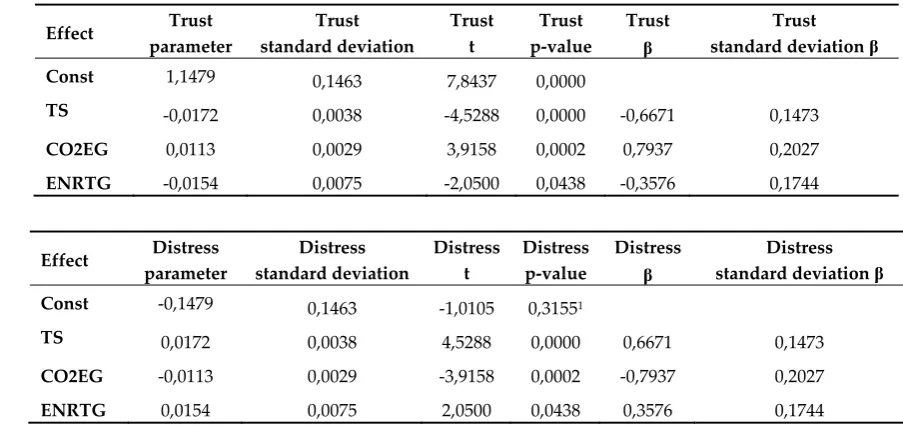
283
recognition of countries with the status of trust or distress is expressed by CO2EG, then TS and
284
ENRTG. Standardized coefficient shows which variables are the most efficient in discriminating
285
between trust and distress countries. Contribution in discriminating between trust and distress class
286
is distributed as follows: approx.. 66,82% from TS, 79,37% from CO2EG and 355,76% from ENRTG.
287
The correct recognition of countries as trust units with the positive contribution has CO2EG and with
288
negative - TS and ENRTG. Opposite influence with the same level of efficient in discriminating noted
289
for distress units.
Table 5. The parameters evaluation of GDA for 16 analyzed countries (cluster)
291
Effect Trust parameter
Trust standard deviation
Trust t
Trust p-value
Trust
β
Trust
standard deviation β
Const 1,1479 0,1463 7,8437 0,0000
TS -0,0172 0,0038 -4,5288 0,0000 -0,6671 0,1473
CO2EG 0,0113 0,0029 3,9158 0,0002 0,7937 0,2027
ENRTG -0,0154 0,0075 -2,0500 0,0438 -0,3576 0,1744
292
Effect Distress parameter
Distress standard deviation
Distress t
Distress p-value
Distress
β
Distress standard deviation β
Const -0,1479 0,1463 -1,0105 0,31551
TS 0,0172 0,0038 4,5288 0,0000 0,6671 0,1473
CO2EG -0,0113 0,0029 -3,9158 0,0002 -0,7937 0,2027
ENRTG 0,0154 0,0075 2,0500 0,0438 0,3576 0,1744
1 no statistical significance
293
Source: own calculation based on data from Eurostat [tran_im_mosp] http://ec.europa.eu/eurostat/data/database
294
and OECD.Stat [Meas-Roadgood-GDP; Meas-Roadgood-Share; Ene-GDP;
..IND-295
Ene-Road; ..IND-Ene-Fuel-GDP] http://stats.oecd.org/ (access: 02/05/2018).
296
297
Table 6 presents descriptive statistics for individual classes. Countries with the status of trust
298
had, on average, lower energy intensity than countries with the distress status, to greater extent used
299
other transport modes than the road (difference of 12 percentage points) in long-distance freight
300
transport in containers, but also had a higher intensity of carbon dioxide than states with distress
301
status. However, it should be noted that the trust class has as much as 72.5% of observations and the
302
distress class is the remaining 27.5%, so the difference in the intensity of carbon dioxide emission is
303
insignificant.
304
305
Table 6. Basic descriptive statistics of predicates in classes
306
Variable Mean Standard
deviation
Variation
coefficient Mean
Standard deviation
Variation coefficient
Trust (p=0,7250) Distress (p=0,2750)
TS 50,7517 17,6560 34,7890 62,5273 13,9207 22,2634
CO2EG 77,1035 34,0808 44,2014 76,5909 24,6802 32,2234
ENRTG 22,7759 10,8871 47,8010 25,5455 8,9481 35,0281
Source: own calculation based on data from Eurostat [tran_im_mosp] http://ec.europa.eu/eurostat/data/database
307
and OECD.Stat [Meas-Roadgood-GDP; Meas-Roadgood-Share; Ene-GDP;
..IND-308
Ene-Road; ..IND-Ene-Fuel-GDP] http://stats.oecd.org/ (access: 02/05/2018).
309
310
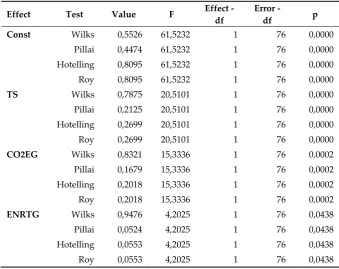
Table 7 presents the tests of decomposition of effective hypotheses, verifying the significance of
311
the variables used to identify trustworthy and unreliable units. Verification tests of Wilks, Pillai,
312
Hotteling and Roy shows that all variables were significant.
Table 7. Multivariate tests of significance
315
Effect Test Value F Effect -
df
Error -
df p
Const Wilks 0,5526 61,5232 1 76 0,0000
Pillai 0,4474 61,5232 1 76 0,0000
Hotelling 0,8095 61,5232 1 76 0,0000
Roy 0,8095 61,5232 1 76 0,0000
TS Wilks 0,7875 20,5101 1 76 0,0000
Pillai 0,2125 20,5101 1 76 0,0000
Hotelling 0,2699 20,5101 1 76 0,0000
Roy 0,2699 20,5101 1 76 0,0000
CO2EG Wilks 0,8321 15,3336 1 76 0,0002
Pillai 0,1679 15,3336 1 76 0,0002
Hotelling 0,2018 15,3336 1 76 0,0002
Roy 0,2018 15,3336 1 76 0,0002
ENRTG Wilks 0,9476 4,2025 1 76 0,0438
Pillai 0,0524 4,2025 1 76 0,0438
Hotelling 0,0553 4,2025 1 76 0,0438
Roy 0,0553 4,2025 1 76 0,0438
Source: own calculation based on data from Eurostat [tran_im_mosp] http://ec.europa.eu/eurostat/data/database
316
and OECD.Stat [Meas-Roadgood-GDP; Meas-Roadgood-Share; Ene-GDP;
..IND-317
Ene-Road; ..IND-Ene-Fuel-GDP] http://stats.oecd.org/ (access: 02/05/2018).
318
319
Table 8 contains the percentages of correctly classified countries to the trust or distress class. The
320
model allowed to classify up to 80% of cases into two groups. The model was more accurate for
321
trusted units than untrusted ones. On the basis of it, the units with the status trust can be selected
322
with greater probability than with the status of distress. As many as 93% can correctly identify those
323
units that will meet the criteria for achieving a trust, but only in 45% can be selected those units that
324
will change direction to the status of distress.
325
Table 8. Classification matrix to trust (1) or distress (0) for cluster
326
Class Percent - Correct Trust Distress
Trust 93,10345 54,00000 4,00000
Distress 45,45455 12,00000 10,00000
Totality 80,00000 66,00000 14,00000
Source: own calculation based on data from Eurostat [tran_im_mosp] http://ec.europa.eu/eurostat/data/database
327
and OECD.Stat [Meas-Roadgood-GDP; Meas-Roadgood-Share; Ene-GDP;
..IND-328
Ene-Road; ..IND-Ene-Fuel-GDP] http://stats.oecd.org/ (access: 02/05/2018).
329
330
Figure 1 shows utility ranges of the examined criteria for the assessment of trust or distress in
331
modal shift potential of long-distance road freight in containers for selected European countries
332
(scenarios). Red fields mean high utility - desired (TRUST) and green low - undesirable (DISTRESS).
333
Which means that there is not one optimal scenario for the implementation of the shift paradigm, and
334
there are infinitely many of them. Similarly when it comes to DISTRESS.
> 1 < 1 < 0,8 < 0,6 < 0,4 < 0,2 < 0 < -0,2 < -0,4 < -0,6 (a)
336
> 1 < 0,95 < 0,85 < 0,75 < 0,65 < 0,55 < 0,45 (b)
337
> 1 < 0,9 < 0,7 < 0,5 < 0,3 < 0,1 (c)
339
Figure 1. Utility ranges of the examined criteria for the assessment of trust or distress in modal shift
340
potential of long-distance road freight in containers for selected European countries
341
Source: own calculation based on data from Eurostat [tran_im_mosp] http://ec.europa.eu/eurostat/data/database
342
and OECD.Stat [Meas-Roadgood-GDP; Meas-Roadgood-Share; Ene-GDP;
..IND-343
Ene-Road; ..IND-Ene-Fuel-GDP] http://stats.oecd.org/ (access: 02/05/2018).
344
345
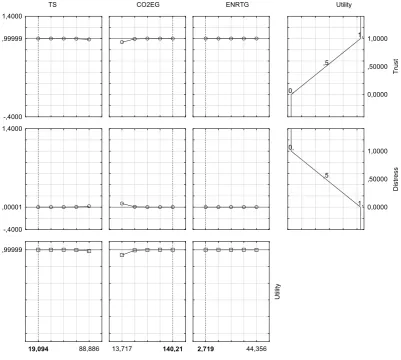
In the summary of the investigation appear the profiles for posteriori and utility probabilities. It
346
can be shown that the selected variables for the identification of EU countries with the status of
347
TRUST were well-founded. Total utility oscillated within the limits of 0.99. Furthermore, it is
348
noteworthy to underline that the aggregate probabilities are 1.00, which indicates a properly
349
conducted study.
350
351
TS
-,4000 ,99999 1,4000
CO2EG ENRTG Utility
0,
,5
1,
0,0000 ,50000 1,0000
Tr
ust
-,4000 ,00001 1,4000
1, ,5
0,
0,0000 ,50000 1,0000
Di
st
re
ss
19,094 88,886
,99999
13,717 140,21 2,719 44,356
U
tility
353
Figure 2. Profiles for posteriori and utility probabilities
354
Source: own calculation based on data from Eurostat [tran_im_mosp] http://ec.europa.eu/eurostat/data/database
355
and OECD.Stat [Meas-Roadgood-GDP; Meas-Roadgood-Share; Ene-GDP;
..IND-356
Ene-Road; ..IND-Ene-Fuel-GDP] http://stats.oecd.org/ (access: 02/05/2018).
357
358
5. Discussion
359
The conducted research confirms that the quantitative approach to the issue of trust
(non-360
quantitative) is worth deepening and developing. There are not many quantitative studies on trust
361
in economics, a negligible number in transport. However, no research was done on modal shift
362
potential of long-distance road freight in containers (expresses the scope of intermodal transport
363
activities). The authors managed to combine three very broad terms: trust, sustainability, shift, and
364
propose methodology and the results of the author's research. The hypothesis has been verified and
365
the goals achieved.
366
Only three predictors were significantly different from zero. TS, CO2EG and ENRTG [table 4].
367
It means that the standardized coefficient β indicates which variables are the most efficient in
368
discriminating between trust and distress countries [table 5]. The most efficient in discriminating
369
between these two groups CO2EG (contribution above 20%), next ENRTG - contribution is above
370
17% and TS - contribution approx. to 15%. In this discriminatory analysis all variables in analysis
371
were important, what the results indicate by Wilks, Pillai, Hotelling, Roy tests [table 7]. On the basis
372
of the model, it is possible to predict units that will implement the shift paradigm (probability of
373
about 93%) than those that will be characterized by the erosion of confidence in the shift paradigm
(45% probability). Which may mean that it is more likely to correctly identify trustworthy units than
375
those that will lose our trust [table 8].
376
The model enables correct classification of 80.00% cases to trust and distress group (both).
377
Regarding the usability ranges of the examined criteria for the assessment of trust or distress
378
regarding the possibility of modal shift of long-distance road transport in containers for selected
379
European countries [figure 1], it should be noted that the choice of the optimal scenario depends only
380
on the utility value that satisfies the decision maker. Optimal scenarios are infinitely many,
381
depending on the extent of the burden on the environment, you can assess how strong changes can
382
be made to be able to implement the idea of sustainable development. The impedance range of the
383
shift paradigm is very flexible, thanks to which it allows adapting to dynamically changing
384
macroeconomic conditions, sometimes even turbulent ones. Therefore, the authors are deeply
385
convinced that the proposed approach is a contribution to the creation of a comprehensive
386
methodology of trust and distress prediction in intermodal transport in the light of the challenges of
387
sustainable development.
388
Based on the results and conclusions of the research, the own definition of trust in intermodal
389
transport was formulated. Trust in modal shift potential of long-distance road freight in container is
390
based on the implementation of the shift paradigm, inscribed in the idea of sustainable transport. It
391
is expressed by the scale of the environmental burden of transport activity, using a vector: modal
392
shift potential of long-distance road freight in containers, CO2 emissions from road in total CO2
393
emissions from transport and motor fuel deliveries [own definition – ESZ & EZ]. Ensuring safety in
394
the implementation of the shift paradigm is therefore an integral element of trust and a form of
395
protection against the threat. This applies in transport to ensuring continuity in meeting transport
396
needs with various transport modals [own definition – ES & WM].
397
In the future, it is worth expanding the research by models for each country, taking into account
398
the wider range of macroeconomic conditions and the drifting of the economy. An inseparable
399
element of the drifting drift is structural shocks, which may indicate the participation of the main
400
factors of disruption / erosion of trust.
401
402
Author Contributions: All the authors contribute equally to this paper.
403
Funding: This research was funded by [name of funder - will be given at a later date] grant number [will be
404
given at a later date].
405
Conflicts of Interest: The authors declare no conflict of interest.
406
References
407
1. Luhmann, N. Trust and Power; J. Willey, Chichester & Sons: New York, USA, 1979; pp. 66-70, ISBN
408
9780471997580.
409
2. Arrow, K.J. Granice organizacji (into English: The limits of organization); Wydawnictwo Naukowe PWN
410
(into English: Polish Scientific Publishers): Warszawa, Poland, 1958; pp. 16-17, ISBN 9788374176668.
411
3. Fukuyama, F. Trust. The Social Virtues and the Creation of Prosperity; Free Press, A Division of Simon
412
Schuster: New York, USA, 1995; p. 26, ISBN 9780029109762.
413
4. Zaheer, A.; McEvily, B.; Perrone, V. Does Trust Matter? Exploring the Effects of Interorganizational
414
and Interpersonal Trust on Performance. Organization Science 1998, Volume 9, Issue 2, pp. 141-159, DOI:
415
10.1287/orsc.9.2.141.
416
5. Seligman, A.B. The Problem of Trust; Princeton University Press: Princeton, New Jersey, USA, 2000;
417
p. 15, ISBN 9780691050201.
418
6. Tomkins, C. Interdependencies, trust and information in relationships, alliances and networks.
419
Accounting. Organizations and Society 2001, Volume 26, Issue 2, pp. 161-191, DOI:
10.1016/S0361-420
3682(00)00018-0.
421
7. Lin, N. Social Capital: A Theory of Social Structure and Action; Cambridge University Press: Cambridge,
422
8. Hardin, R. Conceptions and Explanations of Trust. In: Trust in Society; Cook, K.S., Ed.; Russel Sage
424
Foundation: New York, USA, 2001; Volume 2, p. 3, ISBN 9780871541819.
425
9. Messick, D.M., Kramer R.M., Trust as a Form of Shallow. In: Trust in Society; Cook, K.S., Ed.; Russel
426
Sage Foundation: New York, USA, 2001; Volume 2, p. 89, ISBN 9780871541819.
427
10. Lewicka-Strzałecka, A. Zaufanie w relacji konsument-biznes (into English: Trust in the
consumer-428
business relationship). Prakseologia (into English: Praxeology) 2003, Volume 143, pp. 195-208.
429
11. Corritore, C.L.; Kracher, B.; Wiedenbeck, S. On-line trust: concept, evolving themes, a model.
430
International Journal of Human-Computer Studies 2003, Volume 58, Issue 6, pp. 737-758 , DOI:
431
10.1016/S1071-5819(03)00041-7.
432
12. Andersen, J.A. Trust in managers: a study of why Swedish subordinates trust their managers. Business
433
Ethics. A European Review 2005, Volume 14, Issue 4, pp. 392-404, DOI: 10.1111/j.1467-8608.2005.00420.x.
434
13. Bachmann, R.; Zaheer, A. Handbook of Trust Research; Edward Elgar Publishing Limited: Cheltenham,
435
Northampton, United Kingdom, 2006; pp. 357-358, ISBN 9781843767541.
436
14. Grönroos, C. In Search of New Logic for Markeing: Foudations of Contemporary Theory; John Wiley & Sons
437
Ltd.: London, United Kingdom, 2007; pp. 203-204, ISBN 9780470061299 .
438
15. Grudzewski, W.M.; Hejduk, I.K.; Sankowska, A.; Wańtuchowicz, M. Zarzadzanie zaufaniem w
439
organizacjach wirtualnych (into English: Management of trust in virtual organizations); Difin: Warszawa,
440
2007; pp. 13-17, ISBN 9788372516862.
441
16. Schoorman, F.D.; Mayer R.C.; Davis J.H. An Integrative Model of Organizational Trust: Past, Present,
442
and Future. Academy of Management Review 2007, Volume 32, Issue 2, pp. 344-354, DOI:
443
10.5465/amr.2007.24348410.
444
17. Sztompka, P. Zaufanie. Fundament społeczeństwa (into English: Trust. Foundation of society); Znak (into
445
English: Sign): Kraków, Poland, 2007; pp. 67-68, ISBN 9788324008506.
446
18. Angriawan, A.; Thakur R. A Parsimonious model of the Antecedents and Consequence of Online
447
Trust: An Uncertainty Perspective. Journal of Internet Commerce 2008, Volume 7, Issue 1, pp. 74-94, DOI:
448
10.1080/15332860802004337.
449
19. Hardin, R. Zaufanie (into English: Trust); Sic!: Warszawa, Poland, 2009; pp. 25-26, ISBN 9788360457771.
450
20. Bugdol, M. Wymiary i problemy zarządzania organizacją opartą na zaufaniu (into English: Dimensions and
451
problems of managing an organization based on trust); Wydawnictwo Uniwersytetu Jagiellońskiego (into
452
English: Publisher of the Jagiellonian University): Kraków, Poland, 2011; p. 158, ISBN 9788323330257.
453
21. Dowell, D.; Morrison, M.; Heffernan, T.W. The changing importance of affective trust and cognitive
454
trust across the relationship lifecycle: A study of business–to–business relationships. Industrial
455
Marketing Management 2015, Volume 44, pp. 119-130, DOI: 10.1016/j.indmarman/2014.10.016.
456
22. Bursian, D.; Faia, E. Trust in the monetary authority. Journal of Monetary Economics 2018, In Press,
457
Corrected Proof, pp. 1-14, DOI: 10.1016/j.jmoneco.2018.04.009.
458
23. Hawlitschek, F.; Notheisen, B.; Teubner, T. The limits of trust-free systems: A literature review on
459
blockchain technology and trust in the sharing economy. Electronic Commerce Research and Applications
460
2018, Volume 29, pp. 50-63, DOI: 10.1016/j.elerap.2018.03.005.
461
24. Hallikainen, H.; Laukkanen, T. National culture and consumer trust in e-commerce. International
462
Journal of Information Management 2018, Volume 38, Issue 1, pp. 97-106, DOI:
463
10.1016/j.ijnfomgt.2017.07.002.
464
25. Faezeh, S.; Fereidoon, S.A., Hassan, H. A new confidence-based recommendation approach:
465
Combining trust and certainty. Information Sciences 2018, Volume 422, pp. 21-50, DOI:
466
10.1016/j.ins.2017.09.001.
467
26. Goeschl, T.; Jarke, J. Trust, but verify? Monitoring, inspection costs, and opportunism under limited
468
observability. Journal of Economic Behavior & Organization 2017, Volume 142, pp. 320-330, DOI:
469
10.1016/j.jebo.2017.07.028.
470
27. Ouyang, Z.; Gursoy, D.; Sharma, B. Role of trust, emotions and event attachment on residents’ attitudes
471
toward tourism. Tourism Management 2017, Volume 63, pp. 426-438, DOI: 10.1016/j.tourman.2017.06.026.
472
28. Di Maggio, P. The Futures of Business Organization and Paradoxes of Change. In The Twenty – First –
473
Century firm: changing economic organization in International perspective, Di Maggio, P., Ed.; Princeton
474
29. Skąpska, E. Services in Theory of Economic Order. Ordo Perspective. In Smart and Efficient Economy:
476
Preparation for the Future Innovative Economy; Simberova, I.; Zizlavsky, O.; Milichovsky, F.,Eds.; Brno
477
University of Technology: Brno, Czech Republic, 2016, s. 403-408; ISBN 9788021454132.
478
30. Ivuts, R.; Matwiejczuk, W., Development of transboundary transport-logistic systems of Poland and
479
Belarus. In Energia w nauce i technice (into English: Energy in science and technology); Jaroszewicz J.,
480
Ed; Oficyna Wydawnicza Politechniki Białostockiej (into English: Publishing House of the Białystok
481
University of Technology): Białystok, Poland 2013; pp. 192-205, ISBN 9788362582457.
482
31. Matwiejczuk, T.; Matwiejczuk, W. Virtual forms of cooperation as the sources of regional
483
development. In Šiuolaikines tarporganizacines sąveikos formos viešajame sektoriuje; Puškorius, S., Ed;
484
Mykolo Romerio Universitetas: Vilnius, Lithuania, 2006, pp. 95-98; ISBN 9955190442.
485
32. Skąpska, E. Development of the Service Sector in Poland at the turn of the century. Tendencies, determinants,
486
perspectives; LAP Lambert Academic Publishing: Saarbrücken, Germany, 2014, p. 165.; ISBN
487
9783659626494.
488
33. Załoga, E. Trendy w transporcie lądowym Unii Europejskiej (into English: Trends in the European Union’s
489
land transport; Wydawnictwo Naukowe Uniwersytetu Szczecińskiego (into English: Scientific
490
Publisher of University of Szczecin): Szczecin, Poland, 2013; pp. 60, 62, 85, 112-113, ISBN
491
9788372419330.
492
34. Litman, T. (Victoria Transport Policy Institute, Victoria, Canada). Well Measured: Developing
493
Indicators for Sustainable and Livable Transport Planning, 2016.. Available online:
494
http://www.vtpi.org/wellmeas.pdf (accessed on 30 May 2018).
495
35. Załoga, E. Nowa polityka transportowa Unii Europejskiej (into English: New transport policy of the
496
European Union). In Transport: nowe wyzwania (into English: Transport: new challenges);
Wojewódzka-497
Król, K.; Załoga, E.; Wydawnictwo Naukowe PWN (into English: Polish Scientific Publishers):
498
Warszawa, Poland, 2016, p. 510. ISBN 9788301184629.
499
36. Kożuch, B.; Sienkiewicz-Małyjurek, K. Factors of effective inter-organizational collaboration: A
500
framework for public management. Transylvanian Review of Administrative Sciences 2018, No. 47 E, p.
501
105.
502
37. Jabłoński, A. Public Service Design and Public Trust: Conceptualizing the Sustainability. In Managing
503
Public Trust; Kożuch, B.; Magala, S.J.; Paliszkiewicz, J., Eds.; Palgrave MacMillan: Cham, Switzerland,
504
2018; p. 166, ISBN 9783319704845.
505
38. Database - Eurostat - European Commission. Available online:
506
http://ec.europa.eu/eurostat/data/database (accessed on 02 May 2018).
507
39. OECD Statistics. Available online: http://stats.oecd.org (accessed on 02 May 2018).
508
40. White Paper on transport: Roadmap to a single European transport area – towards a competitive and
resource-509
efficient transport system; European Union, 2011; ISBN 9789279182709.
510
41. Zioło, M.; Porada-Rochoń, M.; Szaruga, E. The Financial Distress of Public Sector Entities, Causes and
511
Risk Factors. Empirical Evidence from Europe in the Post-crisis Period. In Risk Management in Public
512
Administration; Raczkowski, K., Ed.; Palgrave MacMillan: Cham, Switzerland, 2017, pp. 315-360, ISBN