IJEDR1401077
International Journal of Engineering Development and Research (www.ijedr.org)440
Implementation of Taguchi Design of Experiment for
Better Surface Finish in Milling Operations
1
L.S.Shirsat,
2N.D.Khutafale,
3R.A.Tamboli
1,2Lecturer, 3Principal1Department of Mechanical Engg. S.D.M.P. 2
Department of Mechanical Engg. S.D.M.P. Nagpur 3 S.D.M.P. Nagpur Nagpur,
,
2[email protected],
3[email protected]_____________________________________________________________________________________________________
Abstract- Surface roughness is one of the most common performance measures in machining and an effective parameter in representing the quality of machined surface. Surface roughness is influenced by controlled machining parameters such as feed rate, cutting speed and depth of cut. The paper aims is to present overview on the non conventional approaches that have been used for the prediction of surface roughness. The procedures of applying the techniques classified as non-conventional approaches and application potentials are discussed and concluded in relation to the prediction of surface roughness performance measures of milling machining processes.
Keywords: average effect response, factor level combination, optimum performance, process parameter, performance measurement, roughness, S/n ratio.
I. INTRODUCTION
The increase of consumer needs for quality metal cutting related products has driven the metal cutting industry to continuously improve quality control of metal cutting processes. Within these metal cutting processes, the end-milling process is one of the most fundamental metal removal operations used in the manufacturing industry. Surface roughness, which is used to determine and evaluate the quality of a product, in one of the major quality attributes of an end-milled product.
In order to obtain better surface roughness, the proper setting of cutting parameters is crucial before the process takes place. As a starting point for determining cutting parameters, technologist could use the hands on data tables that are furnished in machining data hand book. Lin (1994) suggested that a trail – and- error approach could be followed in order to obtain the optimal machining condition for a particular operation. Consequently, it is a very time consuming processes of identifying the optimum cutting condition for a particular operation. A Design of experiment (DOE) has been implemented to select manufacturing process parameters that could result in a better quality product.
The DOE is an effective approach to optimize the throughput in various manufacturing – related processes (Fidan, Kraft, Ruff, &Derby, 1998). In their study, three independent variables, each with three level, had total of (33) =27 experimental runs. Oftentimes, the optimum metal cutting process required studying more than three factors for the cutting parameters. For example, if a DOE set up considered four or five independent variables, each with at least three levels, then (34) =81 runs or (35)=243 runs were required in the experiment. Imagine the total cost of these experimental runs one could conclude that is was very costly for the industry. In addition, the time of these runs could delay any quality resolving action for the industry.
More industrial technology (IT) graduates are facing challenges to improve the quality of product & processes with minimum cost and time constraint in their careers. The Taguchi parameter design techniques have been proved to be successful in meeting this challenge over the past 15 years (Antony & Kayee, 1999). Therefore, there is a need to not only introduce our IT graduates to DOE but also Taguchi parameter design. This paper attempts to introduce how Taguchi parameter design could be used in identifying the significant processing parameter & optimizing the surface roughness of end- milling operations. This systematic approach of implementing Taguchi parameter design could be sought for IT curriculum (Foster, 2000).
II. PURPOSE OF STUDY
There were two purpose of this research. The first was to demonstrate a systematic procedure of using Taguchi parameters design in process control of individual milling machines. The second was to demonstrate the use of the Taguchi parameter design in order to identify the optimum surface roughness performance with a particular combination of cutting parameters in an end-milling operation.
III. III.TAGUCHI PARAMETER DESIGN
IJEDR1401077
International Journal of Engineering Development and Research (www.ijedr.org)441
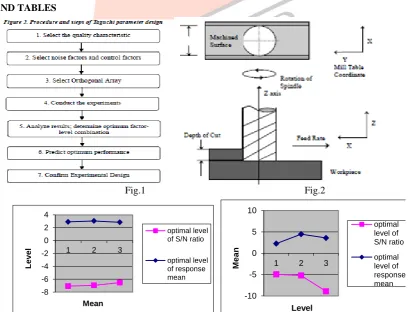
used to estimate the effects of each factor independent of the other factors. Therefore, the information about the design parameters can be obtained with minimum time and resources (Antony & Kaye, 1999). The signal-to-noise ratio is simply a quality indicator by which the experimenters and designers can evaluate the effect of changing a particular design parameter on the performance of the process or product. Figure 2 demonstrates the procedure and steps of Taguchi parameter design (Fowlkes & Creveling, 1997).IV. IV.EXPERIMENTAL DESIGN, SETUP, AND RESULTS
The study was carried out using a XL MILL ATC with multiple tool-change capabilities (max number of tools = 6) and with Programmable spindle speed 150- 4000 rpm. The machine is capable of a three-axis movement (along the x y and z planes). CNC programs can be developed in the XL MILL CPU.The experimental design, setup, and results are presented as follows:
A. Selection of the quality characteristic
There are three types of quality characteristics in the Taguchi methodology, such as smaller-the-better, larger the-better, and nominal-the-best. For example, smaller-the-better is considered when measuring fuel consumption of an automobile or shrinkage of a plastic component (Antony & Kaye, 1999). The goal of this research was to produce minimum surface roughness (Ra) in an end-milling operation. Smaller Ra values represent better or improved surface roughness. Therefore, a smaller-the-better quality characteristic was implemented and introduced in this study.
B. Selection of noise factors and control factors
Depth of cut, cutting speed, and feed rate had significant effects on surface roughness in the end milling operations. In this study, the controllable factors are depth of cut (A), cutting speed (B), feed rate (C), which were selected because they can potentially affect surface roughness performance in end-milling operations. Since these factors are controllable in the machining process, they are considered as controllable factors in the study. One of the important attributes of Taguchi parameter design is it could also consider uncontrollable (Noise) factors in the analysis. One of the noise factors used in this study is the measurement location of the work piece. It is very difficult to control the surface roughness measurement because it is different at separate locations. In this study, the measurement location of the finished surface was considered as a noise factor and was measured at eight different locations. Table 1 listed all the Taguchi design parameters and levels.
C. Selection of Orthogonal Array
There are 18 basic types of standard Orthogonal Arrays (OA) in the Taguchi parameter design (Torng, Chou, & Liu, 1997). Since three factors were studied in this research, three levels of each factor were considered. Therefore, an L9 Orthogonal Array was selected for this study. The layout of this L9 OA is shown in Table 2. Each run will have eight data collected. Therefore, a total of (9*8) = 72 data values were collected, which were conducted for analysis in this study.
D. conducting the experiments
Figure 2 illustrates the experimental settings in this study for work piece and end-milling operations. The tool used in this experiment was a 05 mm, high-speed steel end mill. The materials used for the experiment were 100 x 100 x 10 mm blocks of aluminum. The 09 experiments, shown in table 2, were randomly run by the XL Mill. Also, eight measured surface roughness data values were collected using the SJ-201 surface roughness tester to measure the finished work pieces after end milling was completed. After the data were collected and recorded in Table 3, signal-to-noise ratios of each experimental run were calculated based on the following equation, which are listed in Table 3 with the data.
1
)
2
1
log(
10
)
(
/
i
yi
n
n
x
N
S
(2)
Where n = number of measurements in a trial/row, in this case, n=3 and Yi is the ith measured value in a run/row.
The average response values were also calculated and recorded in Table 3.
E. Analyzing the results and determining the optimum cutting conditions
Analysis of Raw Data and S/N Ratios
After raw data were collected (Table3), average effect response values (Table 4) and S/N response ratios (Table 5), respectively, were calculated based on Table 3. The calculation of average effect response values and S/N ratios were based on the following procedure. For example, the average effect for level one of depth of cut was computed using data from experimental numbers 1-3 of Table 3. The average effect for level two of depth of cut was computed using experimental numbers 4-6 of Table 3. The average effect for level three of depth of cut was computed using experimental numbers 7-9 of Table 3. Similarly, the average effect of cutting speed and feed rate was computed for all other cutting levels. The S/N ratio is calculated in the same way. The average effects and S/N ratios for each level of cutting parameters are summarized and referred to in the average effects response table and S/N ratios response table for surface roughness (Ra), as shown in Tables 4 and 5.
Determination of the Optimum Factor-Level Combination
IJEDR1401077
International Journal of Engineering Development and Research (www.ijedr.org)442
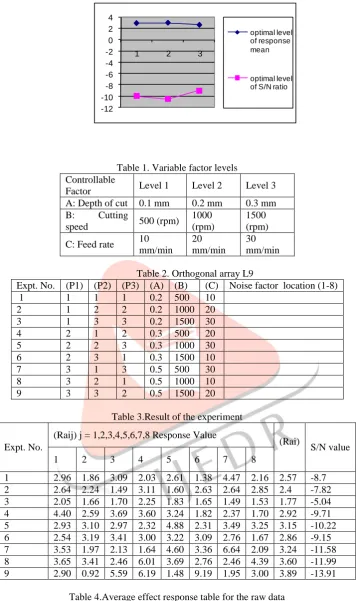
highest S/N ratio always yield the optimum quality with minimum variance (Antony & Kaye, 1999). Consequently, the level that has a higher value determines the optimum level of each factor. For example, in Figure 4, level one for depth of cut (A1= 0.02 mm) has the highest S/N ratio value, which indicated that the machining performance at such level produced minimum variation of the surface roughness. In addition, the lower surface roughness value had a better machining performance. Furthermore, level one of depth of cut (A1 = 0.02 mm) has indicated the optimum situation in terms of mean value. Similarly, the level three of cutting speed (B3=1500 rpm) and the level three of feed rate (C3=30 mm/min) have also indicated the optimum situation in terms of S/N ratio and mean value. Therefore, the optimum cutting condition will be (depth of cut=0.02mm (A1), cutting speed=1500rpm (B3), and feed rate=30 mm/min (C3), was determined to be able to produce the optimum surface roughness within the specific cutting condition range.F. Predicting Optimum Performance
Using the aforementioned data, one could predict the optimum surface roughness performance using the cutting conditions as: Predicted Mean
)
(
2
3
3
1
B
C
Y
A
= 2.25+2.84+2.72-2 (3.13) = 1.54
m
Similarly, the S/N ratio could be predicted as: Predicted S/N =
A
1
B
3
c
3
2
(
)
= -7.19-9.37-8.95-2 (-8.50)= - 8.51.
With this prediction, one could
Conclude that the machine creates the best surface roughness (Ra =1.54
m
) within the range of specified cutting conditions (Table 1). A confirmation of the experimental design was necessary in order to verify the optimum cutting conditions.G. Establishing the design by using a confirmation experiment
The confirmation experiment is very important in parameter design, particularly when screening or small fractional factorial experiments are utilized. The purpose of the confirmation experiment in this study was to validate the optimum cutting conditions (A2B3C) that were suggested by the experiment that corresponded with the predicted value. In this research, the confirmation runs with the optimum cutting condition A2B3C1 resulted in response values of 1.64, 1.43, 1.53 & 1.54
m
. Thus the mean (=1.53
m
), And the S/N ratio (= -5.04 ) were calculated. Since the Mean and S/N ratio of the four confirmation runs were all within the 95% confidence interval, the optimum cutting condition has been verified. Therefore, the optimum surface roughness (Ra =1.53
m
) can be obtained under the above-mentioned cutting condition in the XL MILL machine.V. FIGURES AND TABLES
Fig.1 Fig.2
-8 -6 -4 -2 0 2 4
1 2 3
L
evel
Mean
optimal level of S/N ratio
optimal level of response mean
-10 -5 0 5 10
1 2 3
M
e
a
n
Level
optimal level of S/N ratio optimal level of response mean
IJEDR1401077
International Journal of Engineering Development and Research (www.ijedr.org)443
-12 -10 -8 -6 -4 -2 0 2 4
1 2 3
optimal level of response mean
optimal level of S/N ratio
Depth of cut (A) Cutting Speed (B)
Table 1. Variable factor levels Controllable
Factor Level 1 Level 2 Level 3
A: Depth of cut 0.1 mm 0.2 mm 0.3 mm B: Cutting
speed 500 (rpm)
1000 (rpm)
1500 (rpm) C: Feed rate 10
mm/min 20 mm/min
30 mm/min
Table 2. Orthogonal array L9
Expt. No. (P1) (P2) (P3) (A) (B) (C) Noise factor location (1-8)
1 1 1 1 0.2 500 10
2 1 2 2 0.2 1000 20
3 1 3 3 0.2 1500 30
4 2 1 2 0.3 500 20
5 2 2 3 0.3 1000 30
6 2 3 1 0.3 1500 10
7 3 1 3 0.5 500 30
8 3 2 1 0.5 1000 10
9 3 3 2 0.5 1500 20
Table 3.Result of the experiment
Expt. No.
(Raij) j = 1,2,3,4,5,6,7,8 Response Value
(Rai)
S/N value
1 2 3 4 5 6 7 8
1 2.96 1.86 3.09 2.03 2.61 1.38 4.47 2.16 2.57 -8.7 2 2.64 2.24 1.49 3.11 1.60 2.63 2.64 2.85 2.4 -7.82 3 2.05 1.66 1.70 2.25 1.83 1.65 1.49 1.53 1.77 -5.04 4 4.40 2.59 3.69 3.60 3.24 1.82 2.37 1.70 2.92 -9.71 5 2.93 3.10 2.97 2.32 4.88 2.31 3.49 3.25 3.15 -10.22 6 2.54 3.19 3.41 3.00 3.22 3.09 2.76 1.67 2.86 -9.15 7 3.53 1.97 2.13 1.64 4.60 3.36 6.64 2.09 3.24 -11.58 8 3.65 3.41 2.46 6.01 3.69 2.76 2.46 4.39 3.60 -11.99 9 2.90 0.92 5.59 6.19 1.48 9.19 1.95 3.00 3.89 -13.91
Table 4.Average effect response table for the raw data
Levels Depth of cut (A) Cutting Speed (B) Feed rate (C)
1 2.25 2.91 3.01
2 4.47 3.05 3.07
3 3.58 2.84 2.72
Max-Min 2.22 0.21 0.35
Rank 1 3 2
Table 5.Average effect response table for S/N ratio
Levels Depth of cut (A) Cutting Speed (B) Feed rate (C)
IJEDR1401077
International Journal of Engineering Development and Research (www.ijedr.org)444
2 -9.69 -10.01 -10.48
3 -12.49 -9.37 -8.95
Max-Min 5.3 -0.64 1.53
Rank 1 3 2
VI. CONCLUSION
In this study, the analysis of confirmation experiments has shown that Taguchi parameter design can successfully verify the optimum cutting parameters, which are A2B3C12 [depth of cut=0.02 mm (A1), cutting speed=1500rpm (B3), feed rate=300 mm/ min (C13).
The material used for the experiment was Aluminum. In order to set the cutting parameters, four confirmation runs were conducted. The average value of surface roughness [Mean (=1.53
m
) and S/N ratio (= -5.04)] were calculated and were found to be within the 95% confidence interval. Therefore, the optimum surface roughness was verified in end-milling operations. Taguchi parameter design can provide a systematic procedure that can effectively and efficiently identify the optimum surface roughness in the process control of individual end milling machines. It also allows industry to reduce process or product variability a nd minimize product defects by using a relatively small number of experimental runs and costs to achieve superior-quality products. This research not only demonstrates how to use Taguchi parameter design for optimizing machining Performance with minimum cost and times to industrial readers but also shows the Industrial Technology educator a project exercise in any Taguchi-related curricula. Further study could consider more factors (e.g. materials, lubricant, etc.) in the research to see how the factors would affect surface roughness. Also, further study could consider the outcomes of Taguchi parameter design when it is implemented as a part of management decision-making processes.REFERENCES
[1] Antony, J. & Kaye, M., (1999), Experimental quality—A strategic approach to achieve and improve Quality, Norwell, Massachusetts, Kluwer Academic Publishers.
[2] Fidan, I., Kraft, R. P., Ruff, L. E. & Derby, S. J., (1998), ―Designed experiments to investigate the solder joint quality output of a prototype automated surface mount replacement system‖, Components, Packaging, and Manufacturing Technology Part C: Manufacturing, IEEE Transactions, V.21, No. 3, p. 172-181.
[3] Foster, W. Tad, (2000), ―Basic Taguchi design of experiments‖, National Association of Industrial Technology Conference, Pittsburgh, PA.
[4] Fowlkes, W. Y. & Creveling, C. M., (1997), Engineering methods for robust product design—using Taguchi methods in technology and product development, Reading, Massachusetts, Addison Wesley.Lin, S. C., (1994), Computer Numerical Control—from programming to networking, Albany, New York.
[5] Lou, M. S. & Chen, J. C., (1999), ―In process surface roughness recognition system in end-milling operations‖, International Journal of Advanced Manufacturing Technology,15, p. 200-209.
[6] Lou, M. S., Chen, J. C. & Li, C., (1998), ―Surface roughness prediction technique for CNC milling‖, Journal of Industrial Technology, 15 (1), p. 1-6. Lou, S. J., (1997), ―Development of four in-process surface recognition systems to predict surface roughness in end milling‖,Dissertation, Iowa State University, p.1.
[7] Montgomery, D C., (1997), Design and analysis of experiments (4th ED.), New York, John Wiley & Sons.
[8] Savage, M. D., (1999), ―Multilevel online surface roughness recognition system in end milling operation‖,Dissertation, Iowa State University. Sullivan, L. P., (1987, June), ―The power of Taguchi method‖, Quality Process, p. 76-79.