Scholarship@Western
Scholarship@Western
Electronic Thesis and Dissertation Repository
4-24-2017 12:00 AM
Use of a Baffle to Enhance Distribution of a Liquid Sprayed into a
Use of a Baffle to Enhance Distribution of a Liquid Sprayed into a
Gas-Solid Fluidized Bed
Gas-Solid Fluidized Bed
Majid Jahanmiri
The University of Western Ontario
Supervisor Dr. Cedric Briens
The University of Western Ontario Joint Supervisor Dr. Franco Berruti
The University of Western Ontario
Graduate Program in Chemical and Biochemical Engineering
A thesis submitted in partial fulfillment of the requirements for the degree in Master of Engineering Science
© Majid Jahanmiri 2017
Follow this and additional works at: https://ir.lib.uwo.ca/etd
Part of the Chemical Engineering Commons
Recommended Citation Recommended Citation
Jahanmiri, Majid, "Use of a Baffle to Enhance Distribution of a Liquid Sprayed into a Gas-Solid Fluidized Bed" (2017). Electronic Thesis and Dissertation Repository. 4590.
https://ir.lib.uwo.ca/etd/4590
This Dissertation/Thesis is brought to you for free and open access by Scholarship@Western. It has been accepted for inclusion in Electronic Thesis and Dissertation Repository by an authorized administrator of
ii
Abstract
Bubbles in gas-solid fluidized beds are generally beneficial as they promote solids mixing,
heat transfer and mass transfer. In most fluidized beds, the local bubble gas flux varies
greatly over the cross-section. A novel triboelectric method is developed to measure the
bubble gas distribution in a fluidized bed. A correlation relates the local bubble gas flux to
the triboelectric signal generated by the impact of the gas bubbles on a triboprobe. Several
signal analysis tools, such as power spectrum, cycle analysis and signal moments, were
used to determine the best experimental fit for the profile of the bubble gas flux. The
triboelectric method is used to study the impact of baffle and fluxtube on the distribution
of the gas bubbles.
Efficient and uniform liquid feed distribution in Fluid CokersTM enhances the yield of
valuable products and the coker operability by reducing the formation of wet agglomerates.
A promising method to improve liquid distribution could be the modification of bed
hydrodynamics and mixing characteristics using simulated ring baffles with and without
fluxtubes. In small scaled-down fluidized bed, such a baffle changed the fluidized bed
hydrodynamics by redirecting gas bubbles above the baffle region, directed towards the jet
spray, which improved liquid distribution by reducing agglomerate formation. The
experimental results show that the best liquid distribution is obtained when the tip of the
liquid injection nozzle is aligned just above the baffle tip. As long as the baffle angle with
the vertical is less than 45o, this will also prevent the formation of any deposit on the baffle.
Key words: Triboelectricity, Bubble, Baffle, Power Spectrum, Triboprobe, Bubble Flux, Fluidized Bed, Agglomeration, Fluxtube, Bubble Distribution
iii
Co-Authorship Statement
Chapter 2 Chapter 3 Chapter 4 Article Title:Development of a Triboelectric method to monitor the local bubble gas flux in a fluidized bed
Authors:
Majid Jahanmiri, Cedric Briens, Franco Berruti, Jennifer McMillan, Francisco Javier Sanchez
Careaga
Article Status:
Submitted for possible publication in Measurement
Majid Jahanmiri conducted all the experimental work, analyzed the data and wrote the manuscript. This work was jointly supervised by Cedric Briens and Franco Berruti. Various drafts of the paper were reviewed by Cedric Briens, Jennifer McMillan and Franco Berruti. Jennifer McMillan provided technical advice throughout the project progress, ensuring the study is relevant to Fluid Coking and reviewed the final draft of the manuscript. F. Sanchez helped with data acquisition system setup.
Article Title:
Effect of a baffle on gas bubbles flow patterns and the distribution of liquid injected into gas-solid fluidized beds
Authors:
Majid Jahanmiri, Cedric Briens, Franco Berruti, Jennifer McMillan, Francisco J. Sanchez Careaga
Article Status:
Submitted for possible publication in Powder Technology
Majid Jahanmiri conducted all the experimental work, analyzed the data and wrote the manuscript. This work was jointly supervised by Cedric Briens and Franco Berruti. Various drafts of the paper were reviewed by Cedric Briens, Jennifer McMillan and Franco Berruti. Jennifer McMillan provided technical advice throughout the project progress, ensuring the study is relevant to Fluid Coking and reviewed the final draft of the manuscript. F. Sanchez helped with conductance circuit and data acquisition system setup.
Article Title:
Effect of a baffle with fluxtube on gas bubbles flow patterns and distribution of liquid feed injected into gas-solid fluidized beds
Authors:
Majid Jahanmiri, Cedric Briens, Franco Berruti, Jennifer McMillan
Article Status:
Submitted for possible publication in Powder Technology
iv
Dedication
I would like to dedicate this thesis to the loving memory of my uncle Professor Mehdi
Jahan-Miri who was my main source of inspiration to pursue my academic career after a
big 16 year gap. His words and encouragement kept my hopes alive during the hard and
long process of obtaining admission to this research study. His sudden death during the
period of my research came as a shock to me, but remembering his words and his image as
a special, true and unique human being, kept me motivated in completing my studies and
research.
This work is also dedicated to my parents Mohsen and Susan who always supported me
and were my well-wishers all through the process of accomplishing this task.
Last but not least, I would like to dedicate this work to my dear wife Elnaz who supported
me through all the ups and downs of this journey and made sure my mind is at peace to just
focus on my studies and research. My daughter Hasti and son Neil were a great source of
v
Acknowledgments
This research work is product of a group work which would have not been accomplished
without the support of many people who truly deserve my recognition and gratitude.
My first acknowledgement goes to Dr. Cedric Briens and Dr. Franco Berruti who showed
faith in me and provided me with this wonderful opportunity to pursue my academic career
at Western University and work at ICFAR. I am grateful to them for their constant support
and priceless guidance at all stages of this research work, who always welcomed me with
all my questions and enquiries.
I would also like to express my gratitude to Dr. Jennifer McMillan from Syncrude Canada
Ltd. for her invaluable thoughts and feedback during the progress of this research. I am
also thankful to ExxonMobil Research and Engineering (EMRE) Company and in
particular Brenda Raich for their valuable support.
Thank you to Francisco Sanchez for his technical support during my research experiments.
Special thanks to Tom Johnston and Christine Ramsden at ICFAR who were always
helpful. Thank you to Cole Handsaeme (CBE Graduate Coordinator) who was extremely
supportive and helpful especially during my “Thesis writing” period.
I would also like to thank my friends at ICFAR and UWO campus: Saber, Maryam Gh.,
Owais, Erfan, Ghazal, Yuan, Yohann, Chiara, and all those who helped me by any means
and appreciate their support.
I am indebted to my very good friends Farid, Arash and Homeira for their priceless support
and assistance from early days of my arrival in London.
My special gratitude to my father, Mohsen and my mother, Susan who constantly showed
their love and support throughout this challenging task.
Notable appreciation to my dear wife Elnaz for her remarkable patience, love and support
for all my endeavors. Thank you to my daughter Hasti and my son Neil who were my true
vi
Table of Contents
Abstract ... ii
Co-Authorship Statement... iii
Dedication ... iv
Acknowledgments... v
Table of Contents ... vi
List of Tables ... xi
List of Figures ... xii
Nomenclature ... xx
List of Appendices ... xxiv
Chapter 1 ... 1
Introduction and literature review ... 1
1.1 Introduction ... 1
1.2 LLDPE Process ... 2
1.3 Fluidized Catalytic Cracking (FCC) ... 5
1.4 Fluid CokingTM Process ... 5
1.4.1 Scrubber ... 8
1.4.2 Stripper ... 9
vii
1.5 FlexicokingTM ... 12
1.6 Review of local bubble flux characterization in gas-solid fluidized beds ... 12
1.7 Application of baffle in fluidized beds ... 16
1.8 Research objectives ... 18
1.9 References ... 19
Chapter 2 ... 26
Development of a triboelectric method to measure the local bubble gas flux in a fluidized bed ... 26
2.1 Abstract ... 26
2.2 Introduction ... 26
2.3 Experimental setup... 30
2.4 Development of Signal Analysis Methods ... 32
2.4.1 Single variable correlation ... 34
2.4.2 Double variable correlation... 43
2.4.3 Triple Variable Correlation ... 49
2.4.4 Comparison of models ... 53
2.4.5 Discussion ... 55
2.5 Results ... 56
viii
2.8 References ... 62
Chapter 3 ... 67
Effect of a baffle on gas bubbles flow patterns and the distribution of liquid injected into gas-solid fluidized beds... 67
3.1 Abstract ... 67
3.2 Introduction ... 67
3.3 Experimental Setup & Methodology ... 71
3.3.1 Triboelectric Method ... 73
3.3.2 Injection Nozzle Configuration ... 75
3.3.3 Conductance Technique ... 79
3.3.4 Gum Arabic Method ... 81
3.4 Results ... 82
3.4.1 Deposit formation on baffle ... 82
3.4.2 Effect of baffle on the lateral profile of the bubble gas flux ... 85
3.4.3 Impact of baffle on liquid distribution (Conductance Method) ... 92
3.4.4 Impact of nozzle penetration depth on liquid distribution (Gum Arabic Method) ... 94
3.4.5 Impact of GLR reduction on liquid distribution ... 102
3.5 Discussion ... 103
ix
Chapter 4 ... 110
Effect of a baffle with fluxtube on gas bubbles flow patterns and distribution of liquid feed injected into gas-solid fluidized beds ... 110
4.1 Abstract ... 110
4.2 Introduction ... 110
4.3 Experimental Setup & Methodology ... 113
4.4 Results & Discussion ... 116
4.4.1 Effect of baffle with fluxtube on the lateral profile of the bubble gas flux ... 116
4.4.2 Impact of nozzle penetration depth on liquid distribution ... 121
4.4.3 Impact of reverse nozzle penetration on liquid distribution ... 127
4.4.4 Effect of baffle with fluxtube in improving liquid distribution at various fluidization velocities ... 133
4.4.5 Impact of reduction in atomization gas on liquid distribution ... 134
4.4.6 Discussion ... 135
4.5 Conclusions ... 136
4.6 References ... 137
Chapter 5 ... 143
Conclusion and Recommendation... 143
x
5.3 Reference ... 145
Appendices ... 146
xi
List of Tables
Table 1.1: Dimensions of the Fluid Coker’s reaction zone designed by Pfeiffer et al. [18]
... 10
Table 1.2: Operating conditions of a typical Fluid Coker (Pfeiffer et al. 1959) [18] ... 11
Table 2.1: Local bubble flux analysis with single signal characteristic (experiment with
fluxtube) ... 40
Table 2.2: Local bubble flux analysis, combining two signal characteristics (experiment
with fluxtube) ... 44
Table 2.3: Local bubble flux analysis, combining three signal characteristics (experiment
with fluxtube) ... 50
Table 2.4: Statistical comparison of 3 variable correlation (Full model) and 2 variable
correlation (Reduced model) in experiments with fluxtube ... 54
Table 2.5: Statistical comparison of 2 variable correlation (Full model) and single variable
correlation (Reduced model) in experiments with fluxtube ... 55
Table 2.6: Power spectrum with two signal characteristics for 3 different fluidized bed
xii
List of Figures
Figure 1.1: LLDPE reaction loop... 3
Figure 1.2: Top & side view of liquid injection pattern in a LLDPE fluidized bed reactor 4 Figure 1.3: Simplified flow diagram of Fluid Coker (Adapted from Prociw [14]) ... 7
Figure 2.1: Schematic of the fluidized bed system and the tribo signal measuring locations ... 30
Figure 2.2: Schematic and image of the triboelectric probe ... 31
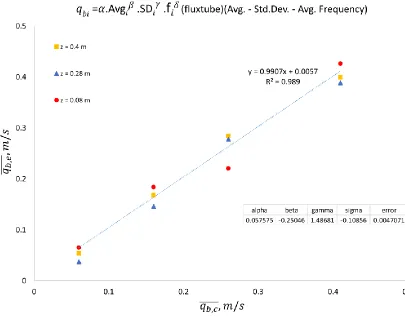
Figure 2.3: Example of power spectrum analysis of a typical signal measured with baffle and fluxtube at z = 0.4 m, Xt = 0.3 m and Vf = 0.2 m/s ... 33
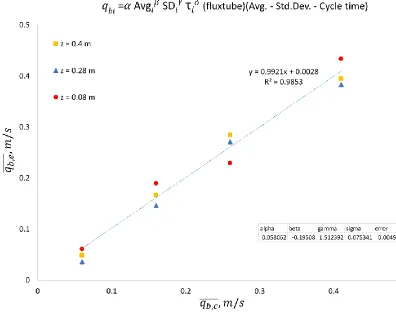
Figure 2.4: Example of cycle analysis of a typical signal measured with baffle and fluxtube at z = 0.08 m, Xt = 0.35 m and Vf = 0.45 m/s ... 34
Figure 2.5: Example of two typical signals measured at 2 extreme fluidization velocities with baffle and fluxtube at z = 0.4 m and Xt = 0.3 m ... 35
Figure 2.6: Example of two typical signals measured at 2 extreme fluidization velocities with baffle and fluxtube at z = 0.4 m and Xt = 0.3 m ... 38
Figure 2.7: Signal Analysis comparison of signals at 2 extreme fluidization velocities with baffle and fluxtube at z = 0.4 m and Xt = 0.3 m ... 39
Figure 2.8: Impact of Standard Deviation on calculating bubble gas flux ... 41
Figure 2.9: Impact of Absolute Deviation on calculating bubble gas flux ... 42
Figure 2.10: Impact of Power on calculating bubble gas flux ... 43
xiii
... 46
Figure 2.13: Impact of combining Signal Average & Standard Deviation on bubble gas
flux ... 47
Figure 2.14: Bubble profile for different Vf at z = 0.28 m with fluxtube - using Power
Spectrum ... 48
Figure 2.15: Bubble profile with average Vf at z = 0.28 m for 3 baffle configurations –
Power Spectrum (using power and average frequency as signal characteristics in
correlation (6) to calculate bubble flux) ... 49
Figure 2.16: Impact of combining Signal Average, Standard Deviation & Average
Frequency on bubble gas flux ... 51
Figure 2.17: Impact of combining Signal Average, Standard Deviation & Cycle Time on
bubble gas flux ... 52
Figure 2.18: Impact of combining Power, Average Frequency & Cycle Time on bubble
gas flux ... 53
Figure 2.19: Bubble profile with average Vf at z = 0.08 m for 3 configurations – Power
Spectrum (using power and average frequency as signal characteristics in correlation (6)
to calculate bubble flux)... 58
Figure 2.20: Bubble profile with average Vf at z = 0.4 m for 3 configurations – Power
Spectrum (using power and average frequency as signal characteristics in correlation (6)
to calculate bubble flux)... 59
Figure 2.21: Map showing bubble distribution using power spectrum for the baffle with
fluxtube configuration ... 60
Figure 3.1: Baffle & Injection nozzle configuration in a Fluid Coker (Wyatt, Jr. et al) [5]
xiv
length. The triboprobe orientation in the unit has been illustrated. ... 72
Figure 3.3: Orientation and lateral position of tribo rod in the fluidized bed ... 74
Figure 3.4: Injection Nozzle configuration with stable spray ... 75
Figure 3.5: TEB injection nozzle geometry ... 76
Figure 3.6: Pre-mixer with 2 geometry ... 78
Figure 3.7: Plexiglas unit with the electrodes for “Conductance” method ... 79
Figure 3.8: Plexiglas unit circuit to measure conductance ... 80
Figure 3.9: Effect of the moisture content on the slide angle of wet sand ... 83
Figure 3.10: Deposit formation with nozzle penetration at the tip of the bed (Xn = 0.02 m) ... 84
Figure 3.11: No deposit on baffle with nozzle penetration above Xn = 0.1 m ... 85
Figure 3.12: Lateral profile of the dimensionless bubble gas flowrate at different elevations from the grid (average of measurements at fluidization velocities ranging from 0.1 to 0.45 m/s) ... 86
Figure 3.13: Snapshots of bubble coalescence towards the bed center in the absence of baffle ... 87
Figure 3.14: Impact of baffle on lateral profile of bubble gas flowrate 0.4 m above grid (z = 0.4 m) ... 88
Figure 3.15: Pictures confirming bubble motion above the baffle region ... 89
xv
probe laterally facing the baffle (z = 0.28 m) – (Average of measurements at 8
fluidization velocities) ... 91
Figure 3.18: Comparison of the effect of baffle on conductance and agglomerate breakup
... 92
Figure 3.19: Nozzle penetration orientation related to baffle for Gum Arabic method ... 93
Figure 3.20: Impact of baffle on relative reduction in total mass of wet agglomerates
compared to “No baffle” at Vf = 0.3 m/s & 0.45 m/s ... 94
Figure 3.21: Impact of baffle on relative reduction in total amount of liquid trapped in
agglomerates compared to “No baffle” at Vf = 0.3 m/s and 0.45 m/s ... 95
Figure 3.22: Effect of Baffle and fluidization velocity on liquid trapped in agglomerates
for different nozzle penetrations at Vf = 0.3 m/s & GLR = 2%. All data is with baffle
unless otherwise indicated. ... 96
Figure 3.23: Effect of Baffle and fluidization velocity on liquid trapped in agglomerates
for different nozzle penetrations at Vf = 0.45 m/s & GLR = 2%. All data is with baffle
unless otherwise indicated. ... 97
Figure 3.24: Impact of fluidization velocity on the fraction of the injected water that is
trapped in agglomerates, without baffle (Gum Arabic method) ... 98
Figure 3.25: – Reduction in percentage of liquid trapped in agglomerates by increasing
fluidization velocity from 0.3 m/s to 0.45 m/s ... 99
Figure 3.26: Change of fluidization velocity at the baffle tip ... 100
Figure 3.27: Impact of baffle on cumulative reduction of water trapped in agglomerates
xvi
agglomerates at Vf = 0.45 m/s (the GLR is the ratio of the atomization gas mass flowrate
to the mass flowrate of injected liquid). ... 102
Figure 4.1 - Experimental Unit with the orientation of injection nozzle& tribo-rod in the
fluidized bed... 113
Figure 4.2: Impact of baffle with fluxtube on the lateral profile of the bubble gas flowrate
0.08 m above the grid (z = 0.08 m) – (Average of measurements at 4 fluidization
velocities) ... 117
Figure 4.3: Impact of baffle with fluxtube on lateral profile of bubble gas flowrate at 0.4
m above grid (z = 0.4 m) ... 118
Figure 4.4: Snapshots comparing bubble coalescence towards the bed center in the
absence of baffle with bubble accumulation above the baffle and fluxtube region at Vf =
0.45 m/s. (a) without baffle; (b) with baffle and fluxtube ... 119
Figure 4.5: Impact of baffle with fluxtube on bubble gas flowrate at 0.28 m above the
distributor and the probe laterally facing the baffle (z = 0.28 m) – (Average of
measurements at 4 fluidization velocities) ... 120
Figure 4.6: Nozzle penetration orientation related to baffle with fluxtube for Gum Arabic
method... 121
Figure 4.7: Impact of baffle with fluxtube on relative reduction in total mass of wet
agglomerates compared to “No baffle” at Vf = 0.3 m/s & 0.45 m/s ... 122
Figure 4.8: Impact of baffle with fluxtube on mass of agglomerates for different nozzle
penetrations at Vf = 0.45 m/s and GLR = 2 %. All data with the baffle and fluxtube,
unless otherwise indicated. ... 123
Figure 4.9: Impact of baffle with fluxtube on mass of agglomerates for different nozzle
penetrations at Vf = 0.3 m/s and GLR = 2 %. All data with the baffle and fluxtube, unless
xvii
trapped in agglomerates compared to “No baffle” at Vf = 0.3 m/s and 0.45 m/s ... 125
Figure 4.11: Effect of Baffle with Fluxtube on the proportion of the injected liquid that is
trapped in agglomerates for different nozzle penetrations at Vf = 0.3 m/s & GLR = 2%.
All data is with the baffle and fluxtube, unless otherwise indicated. ... 126
Figure 4.12: Effect of Baffle with Fluxtube on the proportion of the injected liquid that is
trapped in agglomerates for different nozzle penetrations at Vf = 0.45 m/s & GLR = 2%.
All data shown is with baffle and fluxtube, unless otherwise indicated. ... 127
Figure 4.13: Reverse injection nozzle penetration with baffle and fluxtube configuration
for Gum Arabic method. Xn represents the distance from the wall, where the injection
nozzle is penetrated ... 128
Figure 4.14: Impact of baffle with fluxtube while injecting reverse on relative reduction
in total mass of wet agglomerates compared to “No baffle” at Vf = 0.45 m/s ... 129
Figure 4.15: Impact of baffle with fluxtube while injecting reverse, on relative reduction
in total amount of liquid trapped in agglomerates compared to “No baffle” at Vf = 0.45
m/s ... 130
Figure 4.16: Impact of baffle with fluxtube on reduction of mass of agglomerates for
different reverse nozzle penetration at Vf = 0.45 m/s and GLR = 2 %. Xn is the distance
of nozzle from the wall where the injection nozzle is penetrated. ( Reverse injection
with baffle and fluxtube) ( Normal injection with baffle and fluxtube) ... 131
Figure 4.17: Impact of Baffle with Fluxtube on liquid trapped in agglomerates for
different reverse nozzle penetrations at Vf = 0.45 m/s & GLR = 2%. Xn is the distance of
nozzle from the wall where the injection nozzle is penetrated. ( Reverse injection with
baffle and fluxtube) ( Normal injection with baffle and fluxtube) ... 132
Figure 4.18: Reduction in mass of liquid trapped in agglomerates by increasing
xviii
liquid that is trapped in agglomerates for Vf = 0.45 m/s & Xn = 0.16 m (the GLR is the
ratio of the atomization gas mass flowrate to the mass flowrate of injected liquid). ... 134
Figure A-1: Comparison of 3 signal analysis methods for z = 0.08 m with fluxtube. (P
denotes Power, f is frequency, S.D. stands for standard deviation, τ shows cycle time and
Avg. is Signal Average)………146
Figure A-2: Comparison of 3 signal analysis methods for z = 0.28 m with fluxtube ... 147
Figure A-3: Comparison of 3 signal analysis methods for z = 0.4 m with fluxtube ... 148
Figure A-4: Map showing bubble distribution using 3 signal analysis methods for the
baffle with fluxtube configuration ... 149
Figure B-1: Impact of baffle on mass of agglomerates for different nozzle penetrations at
Vf = 0.3 m/s and GLR = 2 %. All data with the baffle, unless otherwise indicated………...153
Figure B-2: Impact of baffle on mass of agglomerates for different nozzle penetrations at
Vf = 0.45 m/s and GLR = 2 %. All data with the baffle, unless otherwise indicated. ...154
Figure B-3: Liquid to solid ratio for all agglomerate size cuts for two configurations:
without baffle and with baffle and fluxtube with a nozzle penetration of Xn = 0.16 m and
at a fluidization velocity of Vf = 0.45 m/s ...155
Figure D - 1 : Impact of Cycle Time on calculating bubble gas flux (Equation 1)…..….157
Figure D - 2: Impact of Signal Average on calculating bubble gas flux (Equation 1) ... 158
Figure D - 3: Impact of Vstatistic-max on calculating bubble gas flux (Equation 1) ... 159
Figure D - 4: Impact of Kurtosis on calculating bubble gas flux (Equation 1) ... 160
Figure D - 5: Impact of Average Frequency on calculating bubble gas flux (Equation 1)
xix
flux (Equation 6) ... 162
Figure D - 7: Impact of combining Signal Average and Kurtosis and on calculating
bubble gas flux (Equation 6) ... 163
Figure D - 8: Impact of combining Signal Average and Cycle Time on calculating bubble
gas flux (Equation 6) ... 164
Figure D - 9: Impact of combining Vstatistic-max and Cycle Time on calculating bubble gas
flux (Equation 6) ... 165
Figure D - 10: Impact of combining Standard Deviation, Cycle Time and Average
Frequency on calculating bubble gas flux (Equation 8) ... 166
Figure D - 11: Impact of combining Power and Average Frequency to determine the
bubble gas flux for the “No Baffle” Configuration ... 167
Figure D - 12: Impact of combining Power and Average Frequency to determine the
xx
Nomenclature
Chapter 1
𝑑𝐵 Bubble diameter (m)
𝑔 Gravitational acceleration (m/s2)
𝐾 Velocity coefficient
𝑈𝐵 Bubble rising velocity (m/s)
Chapter 2
𝐵𝑖 Undefined signal characteristic
𝐶𝑖 Undefined signal characteristic
𝐷𝑖 Undefined signal characteristic
𝐹 Full regression model
𝑓𝑖 Average frequency of local tribo signal (Hertz)
𝑃𝑖 Power of local tribo signal (V2)
𝑞
𝑏 Bubble gas flux (m/s)𝑞
𝑏,𝑖 Local bubble gas flux (m/s)𝑞
̅̅̅̅̅
𝑏,𝑐 Calculated Cross-sectional average bubble flux (m/s)𝑞
𝑏,𝑒̅̅̅̅̅
Experimental Cross-sectional average bubble flux (m/s)xxi
𝑉𝑓 Fluidization velocity (m/s)
𝑉𝑚𝑓 Minimum fluidization velocity (m/s)
𝑋𝑛 Injection nozzle horizontal penetration length into the fluidized bed
(m)
𝑋𝑡 Tribo rod horizontal penetration length inside the fluidized bed (m)
𝑧 Vertical distance from distributor to triboelectric probe (m)
𝛾 Empirical calibration constant
𝛽 Empirical calibration constant
𝛾 Empirical calibration constant
𝜏
𝑖 Signal cycle timeChapter 3 & 4
𝑑𝑎𝑔𝑔𝑙 Agglomerate diameter (µm)
𝑑ℎ Typical injection nozzle tip, hole diameter, used in commercial fluid
coker (mm)
𝑓𝑖 Average frequency of local tribo signal (Hertz)
𝐺𝑏𝑒𝑑 Conductance of fluidized bed (Siemens)
𝑃𝑖 Power of local tribo signal (V2)
𝑞
𝑏 Bubble gas flux (m/s)xxii
𝑞
𝑏,𝑐̅̅̅̅̅
Calculated Cross-sectional average bubble flux (m/s)𝑅𝑏𝑒𝑑 Fluidized bed resistance (Ω)
𝑅𝑚 Measurement resistance (Ω)
𝑉𝑓 Fluidization velocity (m/s)
𝑉𝑚 Applied Voltage (V)
𝑉𝑚𝑓 Voltage drop across measurement resistor (V)
𝑋𝑛 Injection nozzle horizontal penetration length into the fluidized bed
(m)
𝑋𝑡 Tribo rod horizontal penetration length inside the fluidized bed (m)
𝑧 Vertical distance from distributor to triboelectric probe (m)
𝛾 Empirical calibration constant
𝛽 Empirical calibration constant
𝛾 Empirical calibration constant
𝜏
Agglomerate moisture release time constant (s)Appendix B
𝑀<600𝜇𝑚 Total mass of bed after recovery of macro-agglomerates (g)
𝑀𝑑𝑦𝑒 Mass of blue dye (g)
xxiii
𝑚𝑝 Mass of particles trapped in agglomerates (g)
𝑚𝑅 Representative sample taken from m<600µm (g)
𝑀𝑠 Sand mass (g)
𝑀𝜇𝑎𝑔𝑔𝑙,𝑆𝑖 Mass of micro-agglomerates for an individual size cut in sample (g)
𝑀𝜇𝑎𝑔𝑔𝑙,𝑖 Total mass micro-agglomerates in the bed for a given size cut (g)
𝑋𝑓 Weight fraction of fines (g)
xxiv
List of Appendices
Appendix A: Comparison of the best signal characteristics combination ... 146
Appendix B: Characterization of agglomerates (Gum Arabic method) ... 150
Appendix C: Video of stable spray jet ... 156
Chapter 1
Introduction and literature review
The current research work presented in this thesis, studies the impact of a baffle to
enhance the distribution of a liquid that is sprayed into a gas-solid fluidized bed. Liquid
injection is the basis of several industrial processes utilizing fluidized beds with a vital goal
of improving production yield and lowering agglomeration. The motivation inspiring this
research work is to enhance the productivity of the present fluid coking processes.
This chapter covers a short summary of notable commercial processes involving
liquid injection with concise details about Fluid CokingTM which is the main focus of this
research work. The review of previous academic research on bubble characterization in a
gas-solid fluidized bed follows along with the few studies of baffles in fluidized beds.
Finally, the research objectives are outlined.
1.1
Introduction
Canada possesses large fields of oil sands that have proven to be a powerful boost
to the Canadian economy. These oil sands are significant due to the fact that light oil
reserves are diminishing worldwide [1]. Canada's oil sands are the third largest reserves of
crude oil in the world, with 166 billion barrels of recoverable oil. The oil sands are located
in different regions within the province of Alberta (Western Canada) and cover an area
over 142,000 square kilometers. Oil production from oil sands has been conducted
commercially for almost five decades. Initially oil sands were primarily accessed through
large open pit mining operations. Since the mid-1980s and especially over the last decade,
in situ technologies have played a growing role in oil sands production.
Oil sands are a mixture of 85% sand and clay, 5% water and 10% bitumen. Bitumen
is a black substance with a high carbon to hydrogen ratio that is too heavy or viscous to
flow or be pumped without being diluted or heated. The bitumen contains 50-60weight %
distillable fractions [2]. The vacuum residue has a high boiling point of above 525 °C [3]
which is due to the existence of long hydrocarbon chains in the bitumen and as a result, oil
refineries are unable to process bitumen in its raw form. Therefore, this bitumen requires
extensive processing and upgrading in order to produce transportation fuel and
petrochemical products that can be marketed.
Conventional commercial processes employed to convert bitumen into lighter
valuable hydrocarbon fractions which are considered carbon rejection processes are
Delayed Coking, FlexicokingTM and Fluid CokingTM that involve the production of carbon
rich coke solid, distillable liquid and light ends [2]. This research work aims at enhancing
the operation and production process of Fluid Cokers and thus focuses on Fluid CokingTM.
Even though Fluid Coking is a leading process for bitumen conversion in Canada,
there are many issues that hinder the smooth operation of Fluid Cokers. Ideally, efficient
and uniform liquid feed distribution would boost the Coker liquid yield and enhances its
operability span by reducing the formation of large agglomerates [4][5]. A new study is
the utilization of baffles inside Fluid Cokers connected downwardly and radially inwards
from the reactor wall to improve liquid distribution and avoid fouling [6][7]. This research
aims to study the impact of a baffle on the formation of large bubbles altering the bed
hydrodynamics, and also its effect on the interaction of injected liquid and solid particles
in a gas-solid fluidized bed.
A brief introduction to the major processes that involve injection of liquid into the
reactor is provided in the following sections:
1.2
LLDPE Process
The production of linear low density polyethylene which is a hydrogenation process
involves an exothermic reaction and the heat is removed by injection of a liquid which has
a neutral behavior in the reaction. In a LLDPE process licensed by BP (British Petroleum),
where a Ziegler-Natta catalyst is used, a fluidized bed reactor is utilized to process the
polyethylene reaction at a temperature ranging between 75 °C - 85 °C and a pressure of 2
by cooling the hot recycle gas at the reactor outlet and compressing it back into the reactor.
The reaction loop for the production of linear low density Polyethylene is shown in Figure
1.1.
Figure 1.1: LLDPE reaction loop
The issue with this process which limits the production rate, is restriction of the
rate at which the reaction heat is removed using heat exchangers in the gas recycle loop.
So an ideal solution to this issue that increases reactor productivity, is the injection of an
inert condensable hydrocarbon with a high heat capacity, such as Pentane, which instantly
removes the reaction heat by evaporation and allows for increased production rate. In order
to control the reaction at a desired temperature, an optimum injection rate of pentane should
be considered, since over-injection of pentane would not allow the pentane to evaporate in
This could cause uneven fluidization and lead to issues such as channeling, agglomeration
and bogging of the bed that would eventually shut down the reactor.
An optimum jet penetration length and jet angle should be considered for each
injection nozzle to achieve a uniform distribution and atomization of the liquid droplets,
which helps in quick vaporization of pentane and as a result, good control of the reaction
temperature. The nozzle tip geometry, nozzle penetration and elevation from the distributor
are other important factors in maintaining an efficient liquid distribution. The solids flow
pattern and the liquid penetration pattern in a typical LLDPE reactor are shown in Figure
1.2.
1.3
Fluidized Catalytic Cracking (FCC)
Powdered catalyst types introduction lead to the development of fluidized bed
catalytic cracking (FCC) in 1942 (United States) and has since been one of the most
significant and widely used processes in the petroleum refineries for the production of
gasoline and diesel from heavy distillates. FCC is also called the heart of a modern refinery
destined for maximum production of gasoline [8].
In the FCC process, hot (500 °C) heavy hydrocarbon and dispersion steam are
injected into the riser of reactor and are mixed with the hot reactivated zeolite catalyst
flowing down the regenerator standpipe. The feed is vaporized by the hot catalyst and the
mixture is lifted up the riser into the reactor, where the catalyst is segregated from the
vapors. The cracking reactions usually start in the riser and are completed in the reactor in
less than 3 seconds. The zeolite catalysts are designed to have extended surface area,
creating room for extra active sites which aid in enhancing the cracking reaction. The
cracking reaction being endothermic obtains its heat from the hot zeolite catalyst. A
disadvantage of this process is the zeolite catalyst being poisoned by heavy hydrocarbons
containing high level of impurities, which restricts the application of heavy hydrocarbons
[9].
A key feature of the FCC process which impacts the product composition greatly
is the liquid injection [10] which according to Newton et al. [11] should form small droplets
with minimum variation in drop size, wide spray coverage along the riser flow area, and
efficient droplet mixing with catalyst. Larger droplets tend to heat up slowly and lead to
undesired coking reactions and possible agglomeration, whereas too small droplets are
likely to overcrack and result in dry gas.
1.4
Fluid Coking
TMProcess
The bitumen extracted from sand oil is too viscous and contains high levels of
impurities such as heavy metals, sulfur, nitrogen and oxygen and therefore needs to be
produce light, valuable hydrocarbons. A common upgrading process established by
ExxonMobil is the Fluid CokingTM Process.
Introduction of the Fluid CokingTM process has the advantage of continuous
operation, which avoids the use of alternate coke drums as in Delayed Coking process.
Fluid CokingTM is a continuous pyrolysis process designed to convert heavy,
non-vaporizing oils i.e. high molecular weight hydrocarbons into valuable light distillates with
lower boiling points with the product called synthetic crude oil, which can be further
processed in refineries. The light hydrocarbon or synthetic crude oil is considered, feed for
vacuum and atmospheric columns existing in many refineries, which produce valuable
products like gasoline, kerosene, diesel fuel and naphtha (feedstock for petrochemical
olefin units). The process involves thermal cracking at high temperatures (500 – 550 °C).
This process develops in a fluidized bed where hot Coke particles introduced in the
freeboard region, come into contact with dispersed bitumen droplets, resulting in an
endothermic reaction [12]. The coke particles carry the heat for reaction and solid
by-products, called “new coke”, deposit on the coke surface. The Coker typically operates in
a turbulent fluidized regime with the bulk of solids moving downwards and the bulk of the
vapours having an upward motion, resulting in a core-annulus regime behavior with the
dense downflowing solid particles surrounding the upflowing lean vapor region in the
center [13].
The coking process is initiated by preheating the bitumen at 350 °C which lowers
its viscosity and saves the amount of heat required, for coking and thermal cracking
reactions in the Fluid Coker. Preheating the bitumen is also beneficial in enhancing its
flowability through injection nozzles into the Coker. Before injection into the reactor,
bitumen is diluted with atomizing steam in a mixing chamber to form a two-phase bubbly
[14] fluid which is transferred to a series of injection nozzles located at different elevations
on the periphery of the reactor. The aim of utilizing a series of uniformly located injection
nozzles on the reactor is to enhance liquid distribution in the fluidized bed Coker and avoid
over moistening of coke particles in any region of the reactor. Atomizing steam is efficient
in dispersing bitumen into small droplets, once injected through the spray nozzle, which
the hot coke particles at 510 – 0 550 °C [15] and a pressure of 34.5 to 103.4 kPa [1]. Steam
is also used at the bottom of the Coker to attrite the large coke particles and fluidize the
smaller coke particles [15]. The heat transferred from coke particles to bitumen droplets
triggers the endothermic thermal cracking reaction resulting in the formation of volatile
hydrocarbon vapors at the bitumen-coke border.
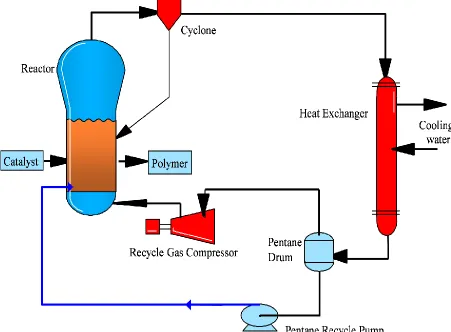
Figure 1.3: Simplified flow diagram of Fluid Coker (Adapted from Prociw [14])
The Fluid Coker (Figure 1.3) is divided into the following 5 sections of reactor,
scrubber, stripper, fractionator and burner which are described as follows:
Bitumen is injected into the reaction zone by a series of injection nozzles, where
the uniformly distributed bitumen droplets react with the fluidized hot coke particles. The
resulting vapor from the reaction is carried by the fluidization gas containing entrained
coke particles, into the upstream cyclones. The cyclone utilizes centrifugal force to redirect
vapors flow to the scrubbing section and the gas leaves the reactor as the product gas. The
vapor droplets are further separated in the fractionator zone of the scrubber, considering
their vapor pressure. The lighter vapors which do not condense in the scrubber, leave the
Coker from the top section for further condensation and upgrading. The heavier vapors that
condense and descend over the scrubber sheds [16], act as a coolant to the fresher vapors
entering the scrubber [14].
The heavy vapors that travel down to the stripping zone, release the hydrocarbon
trapped on the coke surface. The coke particles that are stripped are transferred to the burner
via a pneumatic system, where they are partially combusted in the presence of air to
produce heat. The hot coke in the burner is introduced back to the reactor to provide part
of the heat required for the thermal cracking reaction.
1.4.1
Scrubber
The hydrocarbon vapor product combines with steam to travel upward into the lean
phase (freeboard) of the reactor, where the superficial gas velocity is 1 – 2 m/s and as a
result some fine coke particles also get entrained along with the vapor-steam mixture into
the cyclones. The centrifugal force created by the cyclone separates the entrained fine coke
particles from the mixture and redirects them to the reaction zone by gravity, through the
cyclone diplegs. The vapor products exit from the top of the cyclones into the scrubbing
zone, where the vapors are quenched to 370 – 400 °C as they ascend towards the inverted
U or V-shaped internal sheds and come in contact with the circulating oil in this region.
The light vapors travel to the top of the scrubber, while the heavy vapor is recycled to the
reaction zone for further reaction. The internal sheds is the point where the descending
quench oil comes in contact with the ascending hot vapors. A de-entrainment grid
assembled above the sheds is responsible for further elimination of impurities like fine coke
particles and quench oil from the vapor product [17].
Venturi-effect impacts the vapors passing out of the cyclone to the scrubbing zone
by increasing the product vapors velocity and transporting them to wall region where the
sheds and the de-entrainment grid. The fine coke present in this area reacts with the oil to
form deposits on the sheds and the grid, leading to partial blockage and fouling of the grid.
This has an impact on restricting the area of vapor flow which results in low contact time
with the quench oil above the scrubber and further plugging of the de-entrainment grid,
resulting in poor product gas quality, containing high levels of impurities which could
subsequently affect downstream units like Hydrotreating unit (catalyst poisoning) (Prociw
et al., 2014) [14].
A solution provided by Bulbuc et al. ([17] to rectify this issue was to assemble
baffles at the cyclone discharge to neutralize the venturi-effect on the outflowing vapors
by restricting their velocity increase to create a uniform distribution of the vapors across
the scrubber cross-section which results in reduction of coke deposit on the de-entrainment
grid above the scrubbing zone.
1.4.2
Stripper
The stripping zone located at the bottom of the Fluid Coker is responsible for
recovering the hydrocarbon vapor trapped in the heavy coke particles falling into this
region, by injection of stripping steam from a sparger. This action increases the reaction
yield and avoids unwanted vapor formation in the downstream burner which could lead to
plugging and operation complications (Davuluri et al. 2012)[16]. The stripping section
contains inverted v-shaped baffles better known as “sheds” to help distribute the steam
flow uniformly and as a result, increase the contact surface between the upflowing steam
and the falling coke particles.
A common issue in the stripping zone is the formation of coke deposits on the shed
surface. These deposits restrict the area available for solids and gas flows, which may lead
to premature shut-down. Grace et al. (2005)[13] addressed this issue by suggesting
v-shaped sheds with different angles which was helpful in minimizing agglomeration and
enhancing the contact surface area between the fluidizing gas and the heavy coke particles.
Sanchez et al. (2013) [7] studied the effect of sheds with 3 different configurations and
reaching the stripping zone and having the lowest percentage of liquid lost (entering) to the
burner which was an improvement compared to the normal sheds. It was also proven that
with the normal sheds, an opening surface area of 60 – 70 % would be ideal to minimize
valuable hydrocarbons entering the burner.
1.4.3
Reaction Zone
Based on the design of Pfeiffer et al. (1959) [18] a typical Fluid Coker’s reaction
zone (coking section) is comprised of the following subzones and operating conditions:
Table 1.1: Dimensions of the Fluid Coker’s reaction zone designed by Pfeiffer et al.
[18]
Zone Diameter (m) Height (m)
1 Disengaging Zone (Top straight side) 2.7 6.1
2 Dense Bed (Wide Diameter) 3.4 4.9
3 Middle zone cone 1.2 (narrow end),
3.4 (wide end) 10.4
4 Stripping Zone 1.2 3
Today’s conventional Fluid Cokers have the same geometry as the design
established by Pfeiffer et al. [18], however the exact dimensions might not be the same as
in Table 1.1. In order to tackle the increase in the vapor product and maintain the
fluidization velocity in the reaction zone, the Coker’s diameter is increased in a conic
pattern, from top of the stripping zone to the disengagement section, above the reaction
zone. A sudden decrease in the diameter of the disengagement zone is to surge the
gas-solid mixture into the cyclones in the fractionation zone, and also avoid over-cracking of
Table 1.2: Operating conditions of a typical Fluid Coker (Pfeiffer et al. 1959) [18]
Operation Conditions
1 Temperature (°C) 550
2 Pressure (kPag) 75
3 Mass of bed solids (kg) 64000
4 Fluidization gas velocity (m/s) 0.3 (Bottom) – 1.1 (Top)
The reaction zone requires high temperatures of 510 - 566 °C [19] to enable thermal
cracking of the long chained heavy hydrocarbons. The reaction pressure is at a relatively
low value of 75 kPag to ensure the formation of vapor hydrocarbons, however the pressure
changes from 34.5 kPa to 103.4 kPa [1] from top to bottom respectively. The height of
solids in the fluidized bed approached 18 m which are constantly circulated by vapors and
steam. A research by Song et al. [20] on hydrodynamics of Fluid Cokers, showed that the
dense phase of coke solids is formed towards the wall region of the reactor and the lean
phase of coke solids develops towards the center of the bed generating a core-annulus flow
pattern. The solids tend to flow down along the wall region and are fluidized upward
towards the center. The solids accumulated in the wall region are entrained into the spray
jet, formed at the tip of injection nozzles. The effective uniform distribution of bitumen is
significant in its interaction with coke particles and enhancing the product yield.
1.4.4
Burner (Furnace)
The heat required for the continuous endothermic coking reaction in the Fluid Coker is
generated in the Burner. Coke particles from the reaction zone, descending through the
stripper, are transferred to the furnace vessel utilizing a pneumatic transport system and are
kept fluidized by air. The coke particles partially combust with air introduced to the burner
to raise the temperature of the coke particle to a range of 540 – 820 °C and the vessel is
operated at this temperature by controlling the air flowrate into the burner. Some of the hot
coke particles are pneumatically transferred to the reaction zone of the Coker and the
transferred to the Coker depends on the temperature gradient between these two vessels
(Pfeiffer et al.) [18], where a greater temperature gradient would demand a higher flux of
hot coke particles into the reaction zone.
1.5
Flexicoking
TMThe Flexicoking process is a carbon rejection process which has a reactor operation very
similar to Fluid Coking. This process is an expansion of the Fluid Coking process
where the net coke yield, after gasification of most of the coke produced in the coker, is
only 2 wt. % compared to the 20 wt. % for Fluid Coking, which means that the majority of
the coke that remains after gasification is utilized in heating the feed [19]. A gasifier vessel
with a fluidized bed is added to the process which is used to gasify the coke by injection
steam and air to produce a low BTU synthesis gas which contains hydrogen, carbon
monoxide, nitrogen, and hydrogen sulphide [22].
1.6
Review of local bubble flux characterization in
gas-solid fluidized beds
Formation of bubbles in gas-solid fluidized beds is generally beneficial in enhancing good
mixing of the solid particles and developing efficient heat and mass transfer. Bubbles have
a remarkable impact on the hydrodynamics of the fluidized bed which is a pivotal factor in
operating fluidized beds. Variation of the local bubble flux over the fluidized bed cross
section plays an important role in promoting these features. Over the past decades, several
researchers have utilized various methods to study the distribution of gas bubbles across
the fluidized bed cross section. Some researchers also aimed at modifying the radial
distribution of gas bubbles by implementing novel methods.
A suitable and convenient method to determine the bubble gas distribution in a fluidized
bed is direct visualization. Lim et al. used the principles of digital image analysis [23] to
determine the bubble size distribution at varying heights and fluidization velocities.
However this technique was incapable of measuring the bubble size distribution at lower
where excessive solid interference occurs, produces problems as a consequence of the light
attenuation in the emulsion phase [23]. This method is reliable for measurement of bubbles
at higher bed heights where large bubbles are predominant.
Horio et al. visualized three dimensional (3D) structures of dilute suspensions in the
freeboard of a bubbling fluidized bed, utilizing the laser sheet technique [24]. The eddies
ejected from the bed surface into the freeboard as a result of bubble eruption, do not
disappear immediately but drift upwards in the form of gas pockets which are called ghost
bubbles. With this technique the eruption of bubbles in the freeboard can be visualized in
an arbitrary cross section and by applying multiple laser sheets horizontally and vertically,
the 3D structure of the ghost bubbles formed in the freeboard can be investigated [24].
However, although the above mentioned methods and other techniques dealing with direct
visualization have the advantage of performing a non-intrusive measurement of bubble
properties [25] but the issue is that their application is restricted to direct visualization of
the outer section of dense three-dimensional fluidized beds which are against the wall,
pseudo two-dimensional beds and very lean gas-solid beds [26]. Therefore these methods
cannot be used to study bubble characteristics in the bed interior [25].
Among researchers who used x-ray to study bubble gas motion in gas-solid fluidized beds,
Rowe et al. [27] were pioneers. Using this technique they were able to define a spherical
shape for undisturbed bubbles with an indented base occupying about one-quarter of the
sphere volume which is referred to as the bubble wake [27]. The size of wake tends to
increase as the particle size decreases and as the particle shape changes from spherical to
angular. They determined that the rising velocity of bubble increases with its diameter and
can be defined as:
𝑈𝐵 = 𝐾√(𝑔. 𝑑𝐵)/2
Where K varies based on the nature of solid particles in fluidized bed from 0.8 to 1.2. They
also found that with increase in bubble concentration, the frequency of coalescence
bubble shape and frequency changes with height in a fluidized bed [28]. Yates et al.
employed x-ray images to evaluate voidage distribution around bubbles coalescing in a
gas-solid fluidized bed [29]. They found that in fluidized bed of powders in group A and
B of Geldart’s classification, bubbles formed are enclosed by an expanded “shell” of gas
and particles in which the voidage tends to decrease exponentially as compared to that of
the emulsion phase, remote from the bubble. With a simple model of coalescence they
showed that the volume size of a “visible” bubble grows with the inflow of gas from the
shell region [29].
The drawback of using x-ray images to characterize bubbles are their weakness in resolving
multiple, simultaneous bubbles [26]. X-ray is not designed to study multiple bubbles
because it can only visualize 2D projection of 3D objects and therefore tomography should
be implemented to obtain an enhanced observation of multiple bubbles [26].
Several researchers employed x-ray tomography to study bubbles in fluidized beds. Mudde
used a double X-ray tomographic scanner [30] to measure solid distribution in a fluidized
bed and was able to determine bubble characteristics such as size, volume and velocity, for
bubbles which are greater than 2.5 cm in size. In this method the vertical dimensions of
bubbles were obtained from the bubble velocity which made it possible to measure the
volume of each bubble. Brouwer et al. utilized fast X-ray tomography [31] to study
fluidized beds since this method was reliable in reconstructing bubble volumes and bubble
velocities. Their research showed that at high pressures there is a clear decrease in the
average bubble size which will typically enhance the fluidized bed performance. Their
results also showed that increasing the fine content of the bed will decrease the size of
bubbles [31]. Verma et al. used ultrafast electron beam X-ray tomography [32] to study the
impact of parameters such as bed inlet gas velocity, initial particle bed height and bed
material on the equivalent bubble size distribution, porosity distribution, bubble diameter
and the bubble rise velocity. For particles like alumina and glass, their results for bubble
rise velocity were in good agreement with the Hilligardt and Werther correlation [32]. With
the aid of X-ray tomography, Maurer et al. [33] were able to obtain high resolution
measurements of bubble hold-up in the fluidized bed with and without vertical internals.
However, the common issue with X-ray tomography is its inability to detect small bubbles.
X-ray tomography shows improvement in image reconstruction by providing better spatial
resolution than electrical capacitance tomography (ECT) but the temporal resolution of
images is poor [26].
Li et al. successfully utilized electrical capacitance tomography (ECT) as a non-invasive
measurement technique to determine the averaged bubble rising velocity in single bubbling
regime [34]. Chandrasekara et al. made development using ECT by implementing a
technique to improve the spatial resolution, which resulted in capturing accurate size of gas
bubbles in fluidized beds [35]. The downside of ECT application is that this method is
restricted to small scale units, since in larger units the image resolution decreases by
applying ECT.
Optical probes can be employed to study the hydrodynamics of gas-solid fluidized beds.
Mainland et al. introduced optical probes for gas-solid fluidized beds operating at high
temperatures which was able to determine bubble properties such as bubble frequency,
local bubble residence time, bubble velocity, pierced length, characteristic bubble size and
visible bubble flow [36]. These optical probes had the benefit of being used in applications
where visual observation is not feasible [36]. Rüdisüli et al. were able to use optical probes
to effectively determine changes in bubble size with gas velocity, however the technique
failed to provide a clear trend for the bubble rise velocity [37].
Capacitance probes were early used by Werther and Molerus to study the spatial
distribution of bubbles for determining fluidization regime transition in gas fluidized beds
[38]. They were the first to employ a needle-type capacitance probe which would have less
impact on the bubble flow [39]. However, in fluidized beds with a large number of smaller
bubbles, the capacitance measured is lower than expected causing a fraction of the
emulsion to be accounted as bubbles [25]. In an attempt to analyze bubbling and turbulent
regimes in a gas-solid fluidized bed using optical and capacitance probes, Farag et al. [40]
found that the size and geometry of the capacitance probes impact the free motion of
bubbles causing decay in the capacitance response and thus leading to underestimation of
measurement discrepancy between optical and capacitance probes for both bubbling and
turbulent regimes.
1.7
Application of baffle in fluidized beds
In a typical fluidized bed with uniform gas distribution, bubbles tend to coalesce and
migrate towards the bed center, based on Darton’s theory [41]. The distribution of gas
bubbles over the bed cross-section can be modified using baffles. Jiang et al. investigated
the effect of ring baffles in the performance of a circulating fluidized bed reactor [42],
assembled at different heights of the riser and found improvement in the solid holdup and
ozone conversion in the gas phase of the riser, while compared to the no baffle condition.
They also showed that enhanced solid and radial gas mixing can be achieved by utilizing
baffles. Sanchez used radioactive particle tracking to study the impact of ring baffles on
the motion of wet agglomerates in a fluidized bed [7][43]. The study aimed at improving
the performance of the stripper of a commercial Fluid CokerTM and it was found that the
baffles reduce fouling on the sheds of the stripper section by increasing the residence time
of wet agglomerates above the baffle and ultimately reducing the undesired vapors leading
to fouling [7]. However, the addition of fluxtubes to these baffles curtails the baffle
performance. Wyatt et al. [6] designed a ring of frusto-conical baffles with fluxtubes
(down-comers), to be assembled in the periphery of the reaction section of circulating
fluidized bed reactors like Fluid Cokers. They employed computational fluid dynamic
(CFD) modelling to show that the presence of baffles reduced fouling of the stripper
internals [6]. Modelling also showed that baffle enhances the yield of C5+ hydrocarbons
and lowers coke make.
Kaza utilized baffles in bubbling fluidized beds to study the impact of shape of baffles in
the bed hydrodynamics. He used 3 baffles i.e., triangular, square and circular shaped baffles
to determine different hydrodynamic parameters such as minimum fluidization velocity,
bed expansion, pressure drop across the bed, fluctuation ratio and expansion ratio in a
bubbling fluidized bed [44]. By introducing a new parameter called blockage ratio, he
found that the bed hydrodynamics are a function of the blockage ratio and independent of
The impact of baffle on gas backmixing in a two dimensional turbulent fluidized bed of
FCC catalyst was studied by Zhang et al. [45]. They found that adding a louver baffle can
greatly reduce solid backmixing flux across the baffle and also retain a highly efficient
gas-solid contact [45].
Issangya et al. investigated the impact of horizontal baffles [46] in circulating fluidized
beds on reduction or elimination of gas bypassing (Jet streaming) which is a defect in
circulating fluidized beds causing solids flow and solid/gas contacting issues in the return
legs. They found that for a given operating condition the ability to eliminate jet streaming
depended on baffle spacing and their axial location in the CFB [46].
In another study, Yang et al. treated baffles as a perforated gas distributor [47] in a bubbling
fluidized bed to simulate the hydrodynamics of the bed using Geldart A particles.
Simulation results using CFD were in rational agreement with the experimental data [47].
Rossbach et al. implemented CFD to study the impact of ring baffles on gas-solid flow in
circulating fluidized bed risers [48]. They found that with the best configuration, air-foil
shaped baffles improves solid distribution with a 45% decrease in the solid dispersion
coefficient in comparison to the case without ring baffles.
Baffles were used by Zhang et al. to analyze the control of mean residence time difference
for particles with wide size distribution in fluidized beds [49]. They found that with baffles
in the fluidized bed, the mean residence time difference for different particles sizes
increases by adding more baffles. However adjusting the mean residence time difference
for different particles is a function of both fluidization velocity and number of baffles and
it would be difficult to effectively adjust the MRT difference with just one variable. Under
high fluidization velocity (Vf/Umf = 23) in the fluidized bed with four baffles, the MRT
ratio of coarse particles to fine particles reached 5.5 [49].
Bachman et al. recently used vertical baffles in a fluidized bed to study the residence time
distribution of particles [50]. They were able to derive new empirical equations for
different baffle configurations in the bed, as a measure for particle transport, based on the
1.8
Research objectives
The objective of this study was to develop a measurement method to study the distribution
of gas bubbles in a fluidized bed, including the impact of a baffle with and without fluxtube.
The first step was to develop a reliable, practical method to determine the local bubble flux.
To resemble conditions in a commercial Fluid CokerTM, our experiments demanded high
fluidization velocities of 0.45 m/s. Furthermore, the planned study of an internal to
concentrate and redirect gas bubbles would produce bubbles and associated shear forces
typically called “gulf streams” that would damage standard optical or capacitance probes.
Therefore, the use of much sturdier triboprobes, which consist of a metal rod on which
surface, triboelectric current is generated by the bubble motion, was investigated. The
copper triboprobe has the advantage of being affordable without any maintenance
requirement. Frictional contact between two materials that exchange electrons results in
the triboelectric effect. S. Soo et al. [52] showed that when a metal is inserted into a
gas-solid fluidized bed, the electric current transferred from the metal to the electrical ground
is caused by the particles colliding with the metal. Matsusaka et al. [53] demonstrated that
triboelectric charging is influenced by several factors such as the gas properties and the
physical, chemical and electrical properties of the collision surface. The intensity of the
generated electric current will rely on many factors like the fluidization velocity, the bubble
size and the particle size [54][55]. Tribo-electric probes have been used to detect fines in a
fluidized bed [55], measure moisture content of solids in fluidized beds [56] and monitor
solid flow in fluidized beds [57], in injection jets, in fluidized beds [58], and in cyclones
[59].
In the second step, the impact of simulated ring baffles on liquid distribution and bubble
flow patterns in a fluidized bed was investigated. The liquid distribution was characterized
by two distinct methods of Conductance and Gum Arabic. The triboelectric method
developed was used to associate the liquid distribution results with the bubble flow patterns
In the final step, the impact of adding a fluxtube to the baffle was studied. The improvement
achieved in liquid distribution using a baffle and previous research studies on the addition
of fluxtube to baffle [6][7], prompted this research work.
1.9
References
[1] Elkolaly, Helal, “Effect of Spray Jet Interactions on the Liquid Distribution in a
Fluidized Bed” (2015). Electronic Thesis and Dissertation Repository. 3189.
http://ir.lib.uwo.ca/etd/3189, (n.d.).
[2] M.R. Gray, Fundamentals of bitumen cooking processes analogous to
granulations: A critical review, Can. J. Chem. Eng. 80 (2002).
[3] M.R. Gray, Upgrading Petroleum Residues and Heavy Oils, Marcel Dekker, New
York, 1994.
[4] P. House, F. Berruti, M.R. Gray, E. Chan, C. Briens, Prediction of propensity to
fouling in fluid cokers, in: AIChE Annu. Meet. Conf. Proc., 2006.
[5] P.K. House, M. Saberian, C.L. Briens, F. Berruti, E. Chan, Injection of a liquid
spray into a fluidized bed: Particle-liquid mixing and impact on fluid coker yields,
Ind. Eng. Chem. Res. 43 (2004).
[6] J.T. WYATT, E.N. Jones, A.U. Chen, C.R. Sutton, T.M. Healy, R. SURYO, L.
LAMPERT, J. Miller, Circulating fluid bed reactor with improved circulation,
(2013). http://www.google.com/patents/US8435452.
[7] Sanchez Careaga, Francisco J., “Hydrodynamics in Recirculating Fluidized Bed
Mimicking the Stripper Section of the Fluid Coker” (2013). Electronic Thesis and
Dissertation Repository. 1819. http://ir.lib.uwo.ca/etd/1819, (n.d.).
[8] I.H. Farag, K.-Y. Tsai, Simulation of fluid catalytic cracking operation, Math.
Model. 8 (1987). doi:10.1016/0270-0255(87)90596-3.
Berlin, Boston: De Gruyter. http://www.degruyter.com/view/product/179759,
(n.d.).
[10] S. Ariyapadi, D.W. Holdsworth, C.J.D. Norley, F. Berruti, C. Briens, Digital X-ray
Imaging Technique to Study the Horizontal Injection of Gas-Liquid Jets into
Fluidized Beds, Int. J. Chem. React. Eng. 1 (2003). doi:10.2202/1542-6580.1114.
[11] D. Newton, M. Fiorentino, G.B. Smith, The application of X-ray imaging to the
developments of fluidized bed processes, Powder Technol. 120 (2001).
doi:10.1016/S0032-5910(01)00349-7.
[12] Ayatollahi, Saber, “Particle Entrainment Studies From Dry and Wet Bed” (2016).
Electronic Thesis and Dissertation Repository. 3771. http://ir.lib.uwo.ca/etd/3771,
(n.d.).
[13] J.R. Grace, H.T. Bi, C.J. Lim, D. Rusnell, D. Bulbuc, C.A. McKnight,
Hydrodynamics of the stripper section of fluid cokers, Can. J. Chem. Eng. 83
(2005).
[14] Prociw, Nicholas A., “Effect of Nozzle Geometry on Jet Bed Interaction:
Experiments with Commercial Scale Nozzles and Eroded Nozzles” (2014).
Electronic Thesis and Dissertation Repository. 2424. http://ir.lib.uwo.ca/etd/2424,
(n.d.).
[15] P. House, B. Engineering, Interaction of Gas-Liquid Jets with Gas-Solid Fluidized
Beds: Effect on Liquid-Solid Contact and Impact on Fluid Coker Operation, 2007.
[16] R.P. Davuluri, J.R. Bielenberg, C.R. Sutton, B.A. Raich, Fluid coking unit stripper,
2012. https://www.google.com/patents/EP2496668A2?cl=en.
[17] C.A. Mcknight, B.A. Knapper, D. Bulbuc, Scrubber for fluid coker unit, 2010.
https://www.google.com/patents/US20100078305.
[18] R.W. Pfeiffer, D. Borey, C. Jahnig, Fluid coking of heavy hydrocarbons, 1959.
![Figure 1.3: Simplified flow diagram of Fluid Coker (Adapted from Prociw [14])](https://thumb-us.123doks.com/thumbv2/123dok_us/1962728.1258775/31.612.148.492.187.511/figure-simplified-flow-diagram-fluid-coker-adapted-prociw.webp)