Scholarship@Western
Scholarship@Western
Electronic Thesis and Dissertation Repository
3-28-2017 12:00 AM
Hsp90 and its Co-chaperones Modify TDP-43 Localization,
Hsp90 and its Co-chaperones Modify TDP-43 Localization,
Aggregation, and Toxicity
Aggregation, and Toxicity
Lilian T. Lin
The University of Western Ontario
Supervisor
Dr. Martin Duennwald
The University of Western Ontario Graduate Program in Pathology
A thesis submitted in partial fulfillment of the requirements for the degree in Master of Science © Lilian T. Lin 2017
Follow this and additional works at: https://ir.lib.uwo.ca/etd
Part of the Molecular Genetics Commons, and the Nervous System Diseases Commons
Recommended Citation Recommended Citation
Lin, Lilian T., "Hsp90 and its Co-chaperones Modify TDP-43 Localization, Aggregation, and Toxicity" (2017). Electronic Thesis and Dissertation Repository. 4434.
https://ir.lib.uwo.ca/etd/4434
This Dissertation/Thesis is brought to you for free and open access by Scholarship@Western. It has been accepted for inclusion in Electronic Thesis and Dissertation Repository by an authorized administrator of
i
Amyotrophic lateral sclerosis (ALS) is a neurodegenerative disease associated with protein misfolding and protein aggregation. In particular, the TAR DNA-binding protein (TDP-43) is often found in the pathological inclusions in neurons of ALS patient brains and spinal cords. This phenomenon is known as TDP-43 proteinopathy, the mislocalization of TDP-43 from the cell nucleus and the formation of aggregates in the cytoplasm. Numerous mutations in the gene encoding TDP-43 have also been linked to familial cases of ALS (fALS) and cause TDP-43 proteinopathy. This study attempts to decipher how the molecular chaperone Hsp90 and its co-chaperones, Aha1, Sti1, and Cdc37, modulate TDP-43 aggregation, mislocalization, and toxicity using a yeast model and cultured mammalian cells. We propose that Hsp90 stabilizes aberrant forms of TDP-43 and the inhibition of Hsp90 through moderate overexpression of Sti1 is able to rescue TDP-43 toxicity by modifying cytoplasmic TDP-43 aggregates.
Keywords
ii
Acknowledgments
First of all, I would like to thank ALS Canada for their generous support that made this study possible. I would also like to thank our collaborators Dr. Aaron Gitler (Stanford University), Dr. Marco Prado (Western University), and Dr. Michael Strong (Western University) for courteously providing us with the materials necessary for this study.
It has been a great honor working with everyone from the Duennwald Lab, and I’m especially grateful to Dr. Martin Duennwald for all the opportunities he has given. I have learnt so much under your supervision. I am also thankful of members of the Duennwald Lab, Vy and Sonja, for creating an awesome lab environment, our undergrad Soojie for helping me with my project, Anne for tirelessly answering my questions, and Alex for his tips on thesis writing.
I would also like to thank the members of my advisory committee, Dr. Christopher Howlett, Dr. Zia Khan, and Dr. Patrick Lajoie for providing me with valuable feedback on my project and guiding me through my master’s program at Western.
iii
Table of Contents
Abstract ... i
Acknowledgments ... ii
Table of Contents ... iii
List of Tables ... vi
List of Figures ... vii
List of Appendices ... ix
List of Abbreviations ... x
Chapter 1 ... 1
1 Introduction ... 1
1.1 Protein Quality Control ... 3
1.2 Molecular Chaperones ... 5
Hsp90 ... 7
1.2.1 Hsp90 Co-chaperones ... 10
1.2.2 1.3 Neurodegenerative Disease ... 15
1.4 Amyotrophic Lateral Sclerosis (ALS) ... 16
1.5 TDP-43: Transactive Response DNA-Binding Protein 43 ... 20
1.6 Yeast models ... 23
1.7 Rationale, Hypothesis, Objectives, and Significance ... 26
Rationale ... 26
1.7.1 Hypothesis and Objectives ... 26
1.7.2 Significance ... 27
1.7.3 Chapter 2 ... 28
2 Material and Methods ... 28
iv
Yeast strains and media ... 28
2.1.1 E. Coli strains and media ... 28
2.1.2 Mammalian cell lines and media ... 29
2.1.3 DNA Plasmids ... 29
2.1.4 Antibodies ... 30
2.1.5 2.2 Methods ... 31
High Efficiency Yeast Transformation ... 31
2.2.1 E. Coli Transformation ... 31
2.2.2 Gateway Cloning ... 32
2.2.3 Yeast Cell Viability Assay ... 33
2.2.4 Fluorescent microscopy ... 34
2.2.5 Western Blot ... 34
2.2.6 Sedimentation Assay ... 35
2.2.7 Mammalian Cell Transfections ... 36
2.2.8 Mammalian Cell Viability Assay ... 37
2.2.9 Immunofluorescence Microscopy ... 37
2.2.10 Statistical Analysis ... 38
2.2.11 Chapter 3 ... 39
3 Results ... 39
3.1 The TDP-43 yeast model ... 39
3.2 Sedimentation Assay ... 42
3.3 Hsp90 modulates TDP-43 stability, aggregation, and toxicity in yeast ... 49
Hsc82 and TDP-43 ... 49
3.3.1 Hsp82 and TDP-43 ... 52
3.3.2 3.4 Hsp90 co-chaperones and TDP-43 ... 55
v
Cdc37 and TDP-43 ... 58
3.4.2 Sti1 and TDP-43 ... 60
3.4.3 3.5 Mammalian Cells ... 66
HeLa Cells ... 66
3.5.1 HEK Cells ... 68
3.5.2 N2a Cells ... 71
3.5.3 Chapter 4 ... 73
4 Discussion ... 73
4.1 Major Findings ... 73
Deletion of molecular chaperones ... 73
4.1.1 Overexpression of Molecular Chaperones ... 74
4.1.2 Mammalian cell work ... 76
4.1.3 4.2 A new sedimentation assay to quantitatively determine changes in protein aggregation ... 78
4.3 Hsp90 stabilization of aberrant TDP-43 protein species leads to cellular toxicity 78 4.4 Moderate expression of Sti1 reduces TDP-43 toxicity through changes in its localization and aggregation ... 79
4.5 Conclusion ... 83
4.6 Limitations ... 83
4.7 Future work ... 84
4.8 Significance ... 86
References ... 87
Appendices ... 95
vi
List of Tables
Table 1: Genetic mutations associated with ALS. ... 18
Table 2: Plasmids created using Gateway Cloning in this study ... 29
Table 3: Antibodies used in this study. ... 30
Table 4: Summarized results of the deletion of molecular chaperones. ... 73
vii
List of Figures
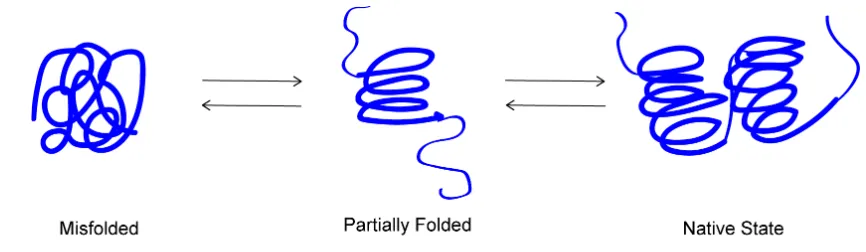
Figure 1: Equilibrium between the native state of a protein and other non-native species ... 4
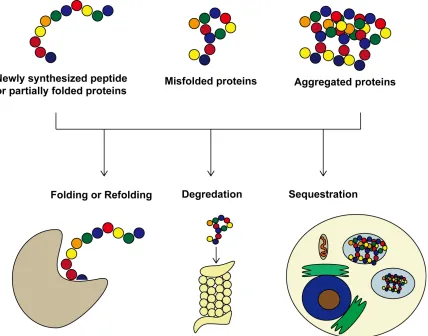
Figure 2: The role of molecular chaperones in maintaining proteostasis ... 6
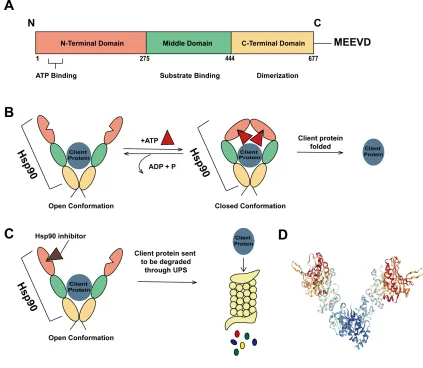
Figure 3: Structure of Hsp90 and its interaction with client proteins ... 9
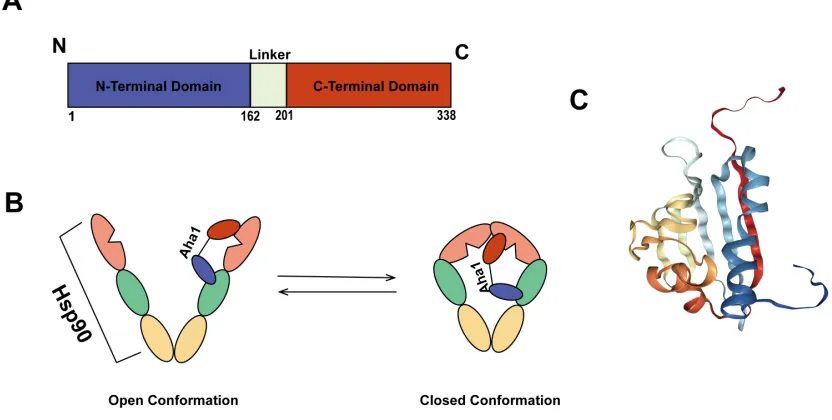
Figure 4: Structure of Aha1 and its interaction with Hsp90 ... 11
Figure 5: Structure of Cdc37 and its interaction with Hsp90 ... 12
Figure 6: Structure of Sti1 and its interaction with Hsp90 ... 14
Figure 7: TDP-43 proteinopathy in neurons ... 19
Figure 8: TDP-43 and ALS ... 22
Figure 9: Characteristics of the TDP-43 yeast model summarized. ... 25
Figure 10: Graphic summary of this study ... 27
Figure 11: TDP-43 yeast model. ... 41
Figure 12: Sedimentation assay and fluorescence microscopy of yeast cells expressing various TDP-43 constructs at different levels ... 45
Figure 13: Sedimentation assays of stress treated wild type yeast and HeLa cells. ... 48
Figure 14: Hsc82 and TDP-43 interaction in yeast ... 51
Figure 15: Hsp82 and TDP-43 interaction in yeast Hsp82 ... 54
Figure 16: Aha1 and TDP-43 interaction in yeast ... 57
Figure 17: Cdc37 and TDP-43 interaction in yeast ... 59
viii
Figure 19: Sti1 and TDP-43 interaction in yeast – Sti1 overexpression. ... 65
Figure 20: TDP-43 interaction with Sti1 in HeLa Cells ... 67
Figure 21: TDP-43 interaction with Sti1 in HEK WT and STI1KO Cells ... 70
Figure 22: TDP-43 interaction with Sti1 in N2a Cells ... 72
Figure 23: Proposed mechanisms for the interaction between Sti1 and TDP-43.. ... 82
Figure 24: Hsp90 and co-chaperones and TDP-43 interaction in yeast strain W303 ... 95
Figure 25: Growth curve assays of Hsp90 and co-chaperones and TDP-43 interaction in yeast strain W303 ... 96
Figure 26: Statistical analysis of the sedimentation assay of Hsp90 and co-chaperones ... 97
Figure 27: TDP-43 protein expression level in Hsp90 co-chaperones ... 98
ix
List of Appendices
x
List of Abbreviations
2xYT 2x yeast extract tryptone
AD Alzheimer’s disease
Aha1 Activator of Hsp90 ATPase protein 1
ALS Amytrophic lateral sclerosis
Amp Ampicillin
AZC azetidine-2-carboxylic acid
BCA assay Bicinchoninic acid assay
BSA Bovine serum albumin
Cdc37 Cell Division Cycle protein 37
DMSO Dimethyl sulfoxide
DNA Deoxyribonucleic acid
dNTP Deoxynucleotide
ER Endoplasmic reticulum
fALS Familial ALS
FTD Frontaltemporal dementia
FBS Fetal Bovine Serum
Gal Galactose
GFP Green fluorescent protein
HD Huntington’s disease
HIV Human immunodeficiency virus
HSF Heat Shock Factor
Hsp Heat shock protein
Kan Kanamycin
xi
Li Lithium
MAT Mating type
MG132 Carbobenzoxy-L-leucyl-L-leucyl-L-leucinal
mRNA Messenger RNA
NEM N-Ethylmaleimide
NES Nuclear export sequence
NLS Nuclear localization sequence
OD600 Optical Density at 600 nm
PBST Phosphate buffered saline with tween
PCR Polymerase chain reaction
PD Parkinson’s disease
PEG Polyethylene glycol
PGK-1 Phosphoglycerate Kinase 1
PMSF Phenylmethylsulfonyl fluoride
polyQ poluglutamine
RNA Riboneucleic acid
ROS Reactive oxygen species
RRM RNA recognition motif
sALS Sporadic ALS
SD Selective dextrose
SDD-AGE Semi-Denaturating Detergent Agarose Gel Electrophoresis.
SDS Sodium dodecyl sulfate
SDS-PAGE Sodium dodecyl sulfate polyacrylamide gel electrophoresis
SGal Selective galactose
SOD1 Superoxide dismutase 1
xii
TDP-43 Transactive Response DNA-binding protein 43
TPR Tetratricopeptide repeat
TE Tris-EDTA
UPS Ubiquitin proteasome system
v/v Volume/volume
WT Wild type
YFP Yellow fluorescent protein
Chapter 1
1
Introduction
Neurodegenerative diseases, such as Alzheimer’s Disease (AD), Parkinson’s Disease (PD), Huntington’s Disease (HD), and amyotrophic lateral sclerosis (ALS), are characterized by the progressive loss of function and death of neurons leading to dementia and ultimately the death of patients. They are also associated with misfolding and aggregation of disease proteins. In ALS, the accumulation of the TAR DNA-binding protein (TDP-43) in pathological neuronal inclusions of patient’s brain and spinal cord is found in the vast majority of patients. These pathological inclusions are a result of the mislocalization of TDP-43 from the nucleus and the formation of aggregates in the cytoplasm. This phenomenon is known as TDP-43 proteinopathy, and observed in about 97% of all ALS patients [1].
It is essential for proteins to obtain and maintain their proper native conformations to perform their biological functions. Yet proteins can misfold or aggregate due to genetic mutations, avert environmental factors, and aging. Consequently, cells have evolved several mechanisms to defend against protein misfolding and aggregation [2]. Once proteins misfold and aggregate, they fail to obtain their proper conformations and cannot perform their regular cellular functions, i.e. toxicity associated with loss of function. Misfolded proteins can also disturb regular cellular physiology and thus become toxic, i.e. toxicity associated with gain of function. Through mechanisms, such as protein remodeling by molecular chaperones or degradation by the ubiquitin proteasome pathway and autophagy [2], cells ensure proper protein quality and normal function of all biological processes. My study focuses on how cellular protein quality control regulates TDP-43 misfolding via the action of molecular chaperones.
partially folded or exposed hydrophobic regions of proteins in order to stabilize them and prevent further misfolding and aggregation. Proteins are released after chaperones have successfully refolded them into their functional conformation [3]. In addition, chaperones have also been reported to prevent the aggregation of unfolded polypeptide chains, cooperate with proteases to facilitate protein degredation, as well as act as disaggregases, i.e. directly dissolving protein aggregates [4]. More recently, molecular chaperones have also been shown to ameliorate the toxic effects of protein misfolding and aggregation [5]. My studies focus on the role of the molecular chaperone Hsp90 and its co-chaperones in the regulation of TDP-43 misfolding and the associated toxicity.
Hsp90 plays central roles in key cellular pathways, such as cellular signaling, cell cycle control, cell survival, as well as guiding structural formation of proteins [6]. Data from a genome-wide yeast study indicate that Hsp90 is required for 10% of all proteins to function properly, whether by direct interactions or indirect interactions mediated by co-chaperones [7]. Hsp90 functions with the aid of its co-co-chaperones that regulate Hsp90 activity and its specific binding to client proteins [8].
My research focuses on the highly conserved Hsp90 co-chaperones Aha1, Cdc37, and Sti1. Aha1 stimulates Hsp90 ATPase activity and is a potent activator of its activity, whereas both Cdc37 and Sti1 inhibit Hsp90 ATPase activity [8]. Targeting Hsp90 and its co-chaperones as a potential therapeutic approach to treat neurodegenerative diseases has been thoroughly studied in recent years [9]. Despite the beneficial role of Hsp90 in many cellular processes, it has been suggested that Hsp90 allows toxic aberrant protein aggregates to accumulate by maintaining their stability under non-physiological conditions [10]. Thus, inhibition of Hsp90 may prove to be a viable therapeutic approach to treat neurodegenerative diseases, as it activates the heat shock factor (HSF-1) and in turn promotes the expression of other neuroprotective chaperones that are responsible for protein disaggregation and degradation [9].
alteration of tau aggregation suggests that the activity of Hsp90 and its co-chaperones are important in regulating protein misfolding and toxicity in neurodegenerative disease beyond tauopathies. Of note, Hsp90 levels are relatively high and static in the aging brain whereas co-chaperone expression is more dynamic [4].
My study aims to understand how Hsp90 and its co-chaperones modulate the toxicity of TDP-43 using a yeast model and cultured mammalian cells. The benefits of using yeast models to investigate TDP-43 toxicity are well established as they recapitulate many central aspects of ALS pathology, including TDP-43 toxicity, aggregation, and mislocalization [11]. Yeast orthologues of Hsp90 and its co-chaperones are also well described [12]; in fact, many functional and structural features of Hsp90 and its co-chaperones were initially established by studies in yeast. Our vast knowledge of the yeast genome and proteome as well as the plethora of available research tools, such as genome-wide deletion and overexpression libraries, make yeast an optimal experimental system to study how Hsp90 and its co-chaperones modulate TDP-43 misfolding and toxicity [13].
1.1
Protein Quality Control
Figure 1: Equilibrium between the native state of a protein and other non-native species. Though the native state of a protein is most stable thermodynamically, proteins are constantly being unfolded and misfolded in the cell and rely on protein quality control mechanisms to rectify its conformation.
Cellular protein quality control aims to maintain protein homeostasis, or proteostasis, in the cell through regulating the accurate production, folding of all proteins, and the refolding or degradation of misfolded proteins, or through sequestering misfolded proteins to specific quality control compartments [14]. Molecular chaperones are central to cellular protein quality control as they determine whether a misfolded protein should be refolded, degraded through the ubiquitin proteasome system (UPS) or autophagy, or sequestered into cellular quality control compartment to minimize toxicity [14]. The role and function of specific molecular chaperones will be discussed in more detail in the following section.
1.2
Molecular
Chaperones
The heat shock response is activated when cells encounter stressful conditions such as environmental stress, chemical stress, heat stress, and pathological stresses that can ultimately lead to denaturing and misfolding of proteins. The key player induced by the heat shock response is a group of molecular chaperones named “heat shock proteins” (Hsps). Heat shock proteins are ubiquitously expressed and classified into gene families, according to their molecular weight: Hsp110, Hsp90, Hsp70, Hsp60, Hsp40, and small Hsps (sHsp) [19]. In this study, we mainly focus on Hsp90 and its co-chaperones.
Hsp90
1.2.1
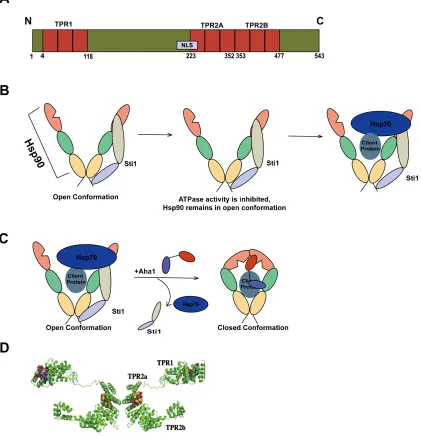
Hsp90 is a highly conserved cytosolic molecular chaperone that plays central roles in key cellular pathways, such as cellular signaling, cell cycle control, cell survival, as well as guiding structural formation of proteins [6]. It is responsible for the folding activation of over 200 different client proteins [20]. The structure of Hsp90 consists of an N-terminus responsible for ATP binding, a middle domain responsible for substrate and co-chaperone binding, and a C-terminus that is essential for dimerization of the protein (Figure 3A and D) [21]. In eukaryotes, a MEEVD polypeptide chain is attached to the C-terminus of Hsp90, responsible for binding to co-chaperones with tetratricopeptide repeats (TPR) [22]. Dimerization is essential to Hsp90 function in vivo [23] and contributes to the open and closed conformation of Hsp90’s ATPase cycle (Figure 3B). The dimerization of Hsp90 results in a “clamp” like structure that maximizes binding with client proteins; once the N-terminus binds to ATP, Hsp90 adopts a “closed” conformation that allows for interaction with client protein, in addition to ATP hydrolysis [24]. The chaperoning ability of Hsp90 is strongly dependent on the binding and hydrolysis of ATP and essential for the function of Hsp90 in vivo [25]. Although Hsp90 function is dependent on ATPase activity, ATP turnover is very slow and requires mediation by a large group of molecular co-chaperones to influence its ATPase cycle by inhibiting or stimulating its ATPase activity and change its conformation [21, 26].
isoform needs to be present in the cell for viability under normal temperatures [7]. At higher temperatures, both isoforms are expressed at high levels, providing a buffer for the fluctuation in protein folding efficiency.
Hsp90 Co-chaperones
1.2.2
Hsp90 function relies heavily on the binding and hydrolysis of ATP and the specific binding to client proteins, which can be achieved through the cooperation with various co-chaperones. Co-chaperones are able to inhibit or stimulate the ATPase activity of Hsp90 and facilitate the folding or activation of its client proteins [26]. In this study, we focus on the Hsp90 co-chaperones Aha1, Cdc37, and Sti1.
Aha1
1.2.2.1
Aha1 (activator of Hsp90 ATPase) was first identified in yeast as a stress-regulated protein that interacts directly with Hsp90 to stimulate its ATPase activity along with its shorter homologue, Hch1. [25]. It was later found to bind to the middle domain of Hsp90 and to stimulate its ATPase activity by up to twelve fold over its basal level [25, 31]. Aha1 is also involved in the activation of client proteins such as tyrosine-protein kinase transforming protein (v-Src) and the glucocorticoid receptor (GR) [32].
Aha1 is a cytoplasmic protein that is highly conserved in eukaryotes. It is divided into two domains: the N-terminal domain and the C-terminal domain. Both of these domains are required for interaction with Hsp90 (Figure 4A and C) [33]. Aha1 first interacts with Hsp90 through the asymmetric binding of its N-terminus to the M-domain of Hsp90 (Figure 4B). The C-terminus of Aha1 is capable of binding to the N-terminal ATP-binding domain of Hsp90 to induce its closed conformation and facilitate ATP ATP-binding and hydrolysis [33]. The binding of Hsp90 and Aha1 is independent of ATP at the N-terminal domain of Hsp90 [26].
Figure 4: Structure of Aha1 and its interaction with Hsp90. A Structural schematic of Aha1 consisting of two domains, the N-terminal domain and the C-terminal domain connected by a linker. B Aha1 binds asymmetrically to Hsp90 by binding to the middle domain of Hsp90 through its N-terminal domain, and the N-terminal domain of Hsp90 through its C-terminal domain to stimulate the ATPase activity of Hsp90 and induce its closed conformation. C Crystal structure of human Aha1 (PDB ID 1X53 [35])
Cdc37
1.2.2.2
Cdc37 (Figure 5Aand C), also known as p50, was first discovered in a screen for genes related to the cell division cycle in yeast [36], and it is essential to drive cell proliferation [37]. It is conserved from yeast to humans, though homologues to Cdc37 have yet to be found in plants [38]. It plays an essential role in stabilizing and stimulating the activity of protein kinases [38]. The binding of the C-terminal domain of Cdc37 to the ATP-binding domain of Hsp90 inhibits the ATPase activity of Hsp90 and it is thought to prolong interactions between client proteins and Hsp90 in order to facilitate more effective chaperoning activity (Figure 5B) [38, 39].
can even compensate for decreased Hsp90 function in vivo [40]. The Cdc37-Hsp90 complex has also been found to influence protein quality control through activation of autophagy [38]. The involvement of the Cdc37-Hsp90 complex in autophagy may be important in neurodegenerative diseases, as it may play a role in the clearance of the accumulation of aggregates in these diseases [38].
Figure 5: Structure of Cdc37 and its interaction with Hsp90. A Structural schematic of Cdc37 consisting of two domains, the N-terminal domain and the C-terminal domain.
B Cdc37 binds asymmetrically to Hsp90 by binding to the ATP-binding domain of Hsp90 through its C-terminal domain, thus inhibiting its ATPase activity. C Crystal structure of human Cdc37 (PDB ID: AW0G [41]).
Sti1
1.2.2.3
motifs per domain. The TPR domains are important for directing protein-protein interactions. Sti1 is capable of binding to the MEEVD polypeptide chain of Hsp90 and the PTIEVVD polypeptide chain of Hsp70 simultaneously through its TPR motifs to connect Hsp90 to Hsp70 [22].
The binding of Sti1 to Hsp90 inhibits Hsp90’s ATPase activity and stabilizes the open conformation of Hsp90, which allows unloading of the client protein from Hsp70 into the open “clasp” of Hsp90 once Sti1 also binds to the Hsp70-client protein complex (Figure 6B) [22]. After the client protein binds to the middle domain of Hsp90, Aha1 out-competes Sti1 to stimulate the ATPase activity of Hsp90 to change the conformation of Hsp90 from open to closed (Figure 6C) [32].
Sti1 is largely cytoplasmic under normal conditions, though nuclear-localization of the protein has also been observed in small quantities [43]. Sti1 also has a nuclear localization sequence (NLS) overlapping with its Hsp90-binding TPR2A domain, suggesting an alternate binding of Sti1 to Hsp90 and various nuclear import factors to retain Sti1 in either the cytoplasm or the nucleus, respectively [43].
1.3
Neurodegenerative Disease
Protein misfolding and aggregation is the central hallmark of many neurodegenerative diseases such as Alzheimer’s Disease (AD), Huntington’s Disease (HD), Parkinson’s Disease (PD), amyotrophic lateral sclerosis (ALS), and frontotemporal dementia (FTD).
The prominence of protein misfolding and aggregation in neurodegenerative disease can perhaps be explained by the fact that neurons are particularly susceptible to stress conditions including genetic and environmental changes to cellular proteostasis [4]. In addition, aging is a factor that contributes to the decline of the cell’s capacity to maintain proteostasis as old cells accumulate mutations and damaged proteins that can overwhelm the overall balance of cellular proteostasis [14]. This line of thinking is consistent with the late, age-dependent onset of most neurodegenerative diseases.
In order to combat the accumulation of damaged or misfolded proteins in the aging cell, particular chaperones are up-regulated to prevent aggregation and facilitate their refolding or degradation [46]. Though molecular chaperones show altered or even impaired induction in the aging cell, the expression level of heat shock factor-1 (HSF-1), the transcription factor responsible for the induction of most of the genes encoding chaperones, stays surprisingly unchanged [46]. Yet the binding of HSF-1 to the heat shock element leading to the activation of HSF-1 decreases in aging cells, which in turn does not activate the heat shock response properly [46].
stabilizes misfolded or aberrant protein species that can lead to an accumulation in toxic aggregates [9].
1.4
Amyotrophic Lateral Sclerosis (ALS)
Approximately two in 100,000 people develop Amyotrophic Lateral Sclerosis (ALS) [49]. ALS, also known as Lou Gehrig’s disease, is a neurodegenerative disease characterized by progressive impairment of muscle function due to neuronal loss often leading to fatal paralysis of the respiratory system. The disease has an onset average age of ~60 years and is fatal within 3-5 years following disease onset [50]. The only treatment currently available for ALS is Riluzole; yet the drug is not at all an effective treatment as it only extends the lifespan of patients for about three months [51]. ALS can be divided into two forms, sporadic ALS (sALS) and familial ALS (fALS). sALS accounts for up to 95% of all ALS cases, whereas fALS only accounts for about 5% [52].
The first cause for fALS was identified in 1993 as a mutation in the copper-zinc superoxide dismutase 1 (SOD1) gene [53]. Mutations in the gene are responsible for about 20% of fALS cases and 1% of sALS [51]. SOD1 is an enzyme that converts superoxide anions into hydrogen peroxide and oxygen, thus reducing the levels of free radicals and reactive oxygen species (ROS) and protecting cells from oxidative stress. The mechanism by which mutations in SOD1 contribute to ALS pathogenesis remains unclear. Since mutant SOD1 shows no decrease in free-radical scavenging and copper binding abilities [54], it has been speculated that rather than loss-of function in mutant SOD1, a gain-of-function mechanism is responsible for ALS disease progression through the formation of aggregates. Studies have also found mutant human SOD1 (hSOD1) to destabilize native SOD1 and lead to the formation of misfolded aggregates and degradation of SOD1 [54]. Furthermore, mutant SOD1 has been found to seed misfolding of wild type (wt) SOD1, allowing the aggregation of wt SOD1 and the propagation of SOD1 misolding in a prion-like manner [55, 56].
discovery of TDP-43 as a cause for ALS, other genetic mutations have been linked to fALS, such as mutations in Fused in Sarcoma (FUS) in 2009 [59], C9ORF72 in 2011 [60], Rho guanine nucleotide exchange factor (RGNEF) [61], and the more recent discovery of NEK-1 in 2016 [62]. C9ORF72 mutations account for about 40-50% of all fALS cases and up to 20% of sALS cases, making it the most prominent genetic cause for ALS found so far [58].
Table 1: Genetic mutations associated with ALS.
Genetic Subtype Gene Inheritance Function/ Putative Function
ALS1 SOD1 AD/AR Enzymes
ALS2 Alsin AR Cellular transport
ALS4 SETX AD RNA metabolism
ALS5 SPG11 AR DNA damage
ALS6 FUS AD/AR RNA metabolism
ALS8 VAPB AD Cellular transport
ALS9 ANG AD RNA metabolism
ALS10 TARDBP AD RNA metabolism
ALS11 FIG4 AD Enzymes
ALS12 OPTN AD/AR Protein metabolism
ALS13 ATXN2 AD RNA metabolism
ALS14 VCP AD Protein metabolism
ALS15/ALSX UBQLN2 XD Protein metabolism
ALS16 SIGMAR1 AD Protein metabolism
ALS17 CHMP2B AD Intracellular transport protein
ALS18 PFN1 AD Axonal outgrowth
ALS19 ERBB4 AD Enzyme
ALS20 hnRNPA1 AD RNA metabolism
ALS21 MATR3 AD Protein metabolism
ALS-FTD C9ORF72 AD RNA metabolism
NA DCTN1 AD Intracellular transport protein
NA ARHGEF28 Unknown RNA metabolism
NA NEK-1 Unknown DNA damage
1.5
TDP
-
43:
Transactive Response
DNA
-
Binding Protein 43
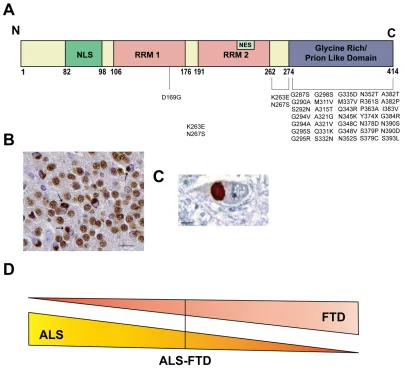
Transactive Response (TAR) DNA-binding protein 43 (TDP-43), is a 43 kDa DNA/RNA-binding protein of 414 amino acids encoded by the TAR DNA-binding protein (TARDBP) gene located on chromosome 1p36.2. It is ubiquitously expressed in the nucleus of most metazoans, but constantly shuttles between the nucleus and the cytoplasm [67]. TDP-43 contains a nuclear localization sequence (NLS), two RNA recognition motifs (RRM) that are responsible for RNA binding, a nuclear export sequence (NES) located in the second RRM, and a glycine-rich prion-like domain at the C-terminus (Figure 8A) [68]. A truncation of TDP-43’s C-terminus (1-216, with the NLS and NES region intact) results in both cytoplasmic and nuclear inclusion body formation, suggesting that the C-terminus plays a pivotal role in the aggregation of TDP-43 [67].
TDP-43 is involved in RNA regulation and protein production in the cell, such as regulating transcription, pre-mRNA splicing, and processing of microRNA [69], and other cellular processes such as apoptosis, cell division, and stabilization of messenger RNA [68]. Inhibition of RNA polymerase II by using actinomycin D decreases nuclear import and results in an accumulation of TDP-43 in the cytoplasm, suggesting that continuous mRNA synthesis is necessary for nuclear import of TDP-43 [67]. TDP-43 was first discovered as a protein that binds to the transactive response (TAR) DNA of the HIV-1 virus, giving its name [70] but its role in HIV-1 regulations has hence been challenged [71].
PD, PD with dementia, and dementia with Lewy bodies plus AD patients, as well as co-localization of cytoplasmic inclusions with mutant huntingtin [72]. While TDP-43 inclusions are present in the majority of FLD and ALS patients, in diseases such as AD, PD, and HD, it appears to be only a secondary histopathological feature [72]. The disease form of TDP-43 is often ubiquitinated, hyperphosphorylated, or cleaved into smaller fragments of 25 and 35 kDa containing the C-terminus [78].
1.6
Yeast models
Saccharomyces cerevisiae, commonly known as baker’s yeast, is a eukaryotic, single-cell organism that has been frequently used as a model organism to investigate protein misfolding in a wide variety of human diseases, particularly neurodegenerative diseases ([82]). Because of the high degree of conservation of key cellular pathways and processes with mammalian cells and our vast knowledge of the yeast genome and proteome, yeast models have been widely used in scientific research and continue to pioneer studies of genetic interactions. Yeast was also the first eukaryotic organism to have its complete genome annotated and sequenced. Yeast deletion and overexpression libraries are readily available for investigating genetic interactions between certain groups of genes [13], consequently, yeast has been effectively used in high-throughput screening studies.
Studies of molecular chaperones and the heat shock response are well established in yeast models as many of the mechanisms and roles of these molecular chaperones are conserved in eukaryotes. Indeed, much of our knowledge on molecular chaperones and the heat shock response was revealed by studies using the yeast model system [12]. The molecular chaperones we investigate in this study, Hsp90 and its co-chaperones, are amongst those that have been well studied in the yeast model.
Yeast models studying many human diseases have been well-established, particularly neurodegenerative diseases and their disease proteins. This includes α-synuclein (α-syn) and parkin (PARK2) in Parkinson’s Disease [83, 84], the Huntington (Htt) polyQ expansion in Huntington’s Disease [85], Alzheimer’s disease [86], and TDP-43 in ALS [11]. The yeast HD model is one of the most extensively characterized yeast models. It has been used to established the toxicity associated with the polyQ expansion and aggregation [85] as well as its interaction with molecular chaperones such as Hsp70 in attempts to find a therapeutic target for the disease [87].
oxygen species (ROS) that induce oxidative stress, all of which are hallmarks of many neurodegenerative disorders [88]. Another hallmark of neurodegenerative diseases, cell death from accumulation of misfolded and aggregated proteins, can also be studied in the yeast model, as misfolded proteins can induce ER stress and ROS leading to apoptotic cell death [82].
Yeast models are also widely used in ALS studies [54], including studies on SOD1, FUS, and TDP-43. In the TDP-43 yeast model, established by Johnson et al. [11, 79], TDP-43 toxicity as well as the localization and aggregation of the protein was examined, the results are summarized in Figure 9 below. The model faithfully recapitulates many central aspects of TDP-43 proteinopathy and are thus comparable to human ALS pathology, such as the cytosolic mislocalization of 43 [11]. Overexpression of TDP-43 is used to model TDP-TDP-43 proteinopathy and its disease phenotypes in yeast and other animal models [1]; overexpression of the protein produces great toxicity throughout the models, supporting the role TDP-43 proteinopathy plays in gain-of-function toxicity [1]. Though there is no evidence of overexpression of TDP-43 in ALS patients, overexpression of TDP-43 in the yeast model provides a good basis to study TDP-43 proteinopathy and discover potential genetic interactions that may modify the aggregation and mislocalization of TDP-43 in cells that display TDP-43 proteinopathy.
1.7
Rationale, Hypothesis, Objectives, and Significance
Rationale
1.7.1
TDP-43 proteinopathy is present in the majority of ALS patients and many other neurodegenerative diseases. In TDP-43 proteinopathy, TDP-43 mislocalizes from the nucleus to the cytoplasm of neurons and forms aggregates. Protein quality control mechanisms such as molecular chaperones are utilized to combat protein misfolding, aggregation, and toxic protein species. Many studies on neurodegenerative disease have explored the interaction of disease proteins and molecular chaperones in attempt to correct the misfolding and aggregation of these proteins and find a therapeutic target for the disease. As mentioned in section 1.2.1, studies on Hsp90 as a potential target for tau aggregation in Alzheimer’s disease provide a strong rationale on investigating the effects of Hsp90 and its co-chaperones on TDP-43 aggregation. We focus mostly on Sti1 in this study as previous results in the Dr. Duennwald’s lab and our collaborator, Dr. Prado’s lab at the University of Western Ontario, have suggested an interaction between Sti1 and TDP-43.
Hypothesis and Objectives
1.7.2
We hypothesize that Hsp90 reduces TDP-43 toxicity and aggregation through Sti1 in a dose-dependent manner. In order to test our hypothesis, we pursue three objectives:
1) To examine the effect of deletion and overexpression of Hsp90 and its co-chaperones on TDP-43 toxicity and aggregation patterns in the yeast model, 2) To establish a biochemical assay to quantify changes in aggregation patterns of
TDP-43, and
3) To validate key findings our experimental results in mammalian cells.
Figure 10: Graphic summary of this study.
Significance
1.7.3
Chapter 2
2
Material and Methods
2.1
Material
Yeast strains and media
2.1.1
Yeast strain BY 4741 (MAT α his3Δ1 leu2Δ0 lys2Δ0 ura3Δ0) and W303 (MAT a leu2-3,112 trp1-1 can1-100 ura3-1 ade2-1 his3-11,15) were used in this study. Yeast deletion strains were obtained from the Saccharomyces Genome Deletion Project.
Yeast-peptone-dextrose (YPD) rich media (10 g/L yeast extract, 20 g/L peptone, and 20 g/L dextrose) and selective dextrose (SD) media (2% glucose, 1X yeast nitrogen base (YNB), 6 g/L l-isoleucine, 2 g/L L-arginine, 4g/L L-lysine HCl, 6 g/L L phenylalanine, 1 g/L L-threonine, and 1g/L L-methionine) in either liquid media or agar plates (20g/L) were used to grow yeast cells. SD media was supplemented with 4 different amino acids (4g/L L-tryptophan, 6g/L L-leucine, 2 g/L L-histidine-monohydrate) depending on the selectivity maker of the plasmid. 2% galactose or 2% galactose plus 2% raffinose was used instead of glucose as a carbon source to make selective galactose (SGal) and selective galactose raffinose (SGal Raf) media respectively, for induction of gene expression from plasmid with the GAL1 promotor.
E. Coli strains and media
2.1.2
Escherichia coli Strain DH5α Genotype F–Φ80lacZΔM15 Δ(lacZYA-argF) 169 recA1 endA1 hsdR17 (rK–, mK+) phoA supE44 λ– thi-1 gyrA96 relA1 was used in this study. Subcloning Efficiency DH5α Competent Cells (Invitrogen, Cat. No. 18265-017) were used for the cloning work in this study.
Mammalian cell lines and media
2.1.3
Cervical cancer derived HeLa cells, human embryotic kidney cells (HEK), and mouse neuroblastoma cells (N2a) were used in this study. Cells were grown in Dulbecco's Modified Eagle Medium (DMEM, Corning) with 4.5 g/L and supplemented with 10% fetal bovine serum (FBS, Gibco), 1X penicillin-streptomycin solution (Corning), and 1X glutamine (Sigma Aldrich) at 37°C with ~5% CO2. HEK wild type and HEK STI1KO
cell lines were courtesy provided by the Prado Lab at Western University.
DNA Plasmids
2.1.4
pRS416Gal TDP-43 wt-YFP (low copy yeast expression plasmid) was a gift from Aaron Gitler (Addgene plasmid #27447 and 27450) [79]. The molecular chaperones for the overexpression experiments are obtained fromDuennwald Lab and used to transform into pDONR201 (Invitrogen) and further into pAG423Gal-ccdB (high copy yeast expression plasmid) and pAG413Gal-ccdB (low copy yeast expression plasmid) vectors (Susan Lindquist, Addgene plasmid #14149 and 14141) through the standard Gateway Cloning protocol (Invitrogen protocol [90]), the plasmids created through Gateway cloning are summarized in the Table 2. The pEGFP wtTDP-43 plasmid was a gift from the Strong Lab at Western University and the pCMV wtSTI1 and pCFP wtSTI1 plasmids were from the Prado lab at Western University. The plasmids were transformed and purified using the Presto Midi Plasmid Kit (Geneaid). Low copy yeast expression plasmids are yeast centromere plasmids (YCp) that produce 1-2 copies of the plasmid per cell, whereas high copy yeast expression plasmids are yeast episomal plasmids (YEp) that produce about 100 copies per cell [91].
Table 2: Plasmids created using Gateway Cloning in this study
Template Destination Vector
Sti1 pAG423Gal-ccdB
Sti1 pAG413Gal-ccdB
Cdc37 pAG423Gal-ccdB
Antibodies
2.1.5
The antibodies used in this study are shown in Table 3.
Table 3:Antibodies used in this study.
Antigen Supplier Use Concentration
GFP Sigma Western Blot 1:1000
TDP-43 Sigma Western Blot 1:1000
HA Sigma Immunofluorescence 1:1000
Hsp70 Thermo Fisher Western Blot 1:2000
V5 Sigma Immunofluorescence 1:1000
Immunofluorescence 1:1000
Histone Abcam Western Blot 1:2000
PGK-1 Antibodies-online Western Blot 1:2000
Rabbit
(Alexa 680)
Life Technologies Western Blot 1:2500
Mouse
(Alexa 680)
Life Technologies Western Blot 1:2500
Rabbit
(Alexa 488)
Life Technologies Immunofluorescence 1:1000
Mouse
(Alexa 488)
Life Technologies Immunofluorescence 1:1000
Rabbit
(Texas Red)
Life Technologies Immunofluorescence 1:1000
Mouse
(Texas Red)
2.2
Methods
High Efficiency Yeast Transformation
2.2.1
Yeast transformations were performed according to standard PEG/lithium acetate method protocol. A single colony of yeast cells are inoculated into 3 mL of YPD liquid or SD media and incubated at 30° C with shaking overnight. The liquid culture is then combined with 27 mL of YPD liquid to make a 30 mL liquid culture and incubated at 30° C shaking till the cells have reached log phase (an OD600 of 0.4 to 0.5). The culture is then
centrifuged at 2000 xg for 5 minutes. The supernatant is aspirated off and the pellet is washed with 3 mL of sterile water. The cells are centrifuged again at the same speed and time. The pellet is resuspended in 2 mL of 100 mM Li-Acetate in TE buffer after the wash step and incubated at 30° C shaking for 10 minutes. The culture is centrifuged again after incubation and the pellet is resuspended in 100 µL of Li-Acetate per transformation. Each transformation is composed of 100 µL cell suspension, 250 µL transformation (1 X TE, 40% PEG, and 100mM Li-Acetate), 12µL salmon sperm DNA, 1µL (0.3~0.5 µg) plasmid DNA, and 25µl DMSO and in the order listed and vortexed thoroughly. The cells then recover at 30° C shaking for 30 minutes, following a 20 minute heat shock at 42° C shaking. After heat shock, the cells are centrifuged for 1 minute at 2000 xg, the supernatant aspirated, and the pellet resuspend in 100 µL TE buffer. The cells are then plated onto selective agar plates.
E. Coli Transformation
2.2.2
We perform E. Coli transformations to replicate and amplify plasmid DNA, resulting in abundant amounts of DNA. 100 µl aliquots of transformation competent DH5α cells are
thawed on ice from storage at -80° C; 1-5 µl (0.1~0.5 µg) of plasmid DNA is added to the cells and mixed thorough by gently flicking the tubes (the competent cells should not be vortexed). The cells are allowed to recover on ice for about 30 mins and heat shocked at 42° C for 100 seconds. The cells rest on ice for 2 mins before 1 mL of 2xYT is added and
the cells allowed to recover at 37° C in a shaking incubator for at least 1 hour. Following
off, and resuspend in 100 µl of 2xYT. The suspension is plated on LB agar plates with selective antibiotic depending on the antibiotic resistance of the vector.
Gateway Cloning
2.2.3
The Hsp90s and co-chaperones constructs were created through the standard procedures of Gateway cloning and consists of three steps, Polymerase Chain Reaction (PCR) amplification, BP recombination, and LR recombination following the Gateway cloning protocol developed by Invitrogen [90].
PCR was performed to obtain a template for the BP recombination reaction. We used an adapted version of the touchdown PCR program in order to avoid non-specific proliferation as a side-product of the reaction. The reaction cycle for PCR program protocol includes two cycles. The first cycle is repeated 10 times with an annealing temperature of 60° C; the second cycle is repeated 20 times with an annealing temperature of 57 °C. The reaction mixture for PCR consists of 2 µl of template DNA (~200 ng), 2µl of 100 mM forward primer, 2µl of 100 mM reverse primer, 2 µl of 100 mM dNTPs, 1µl of Q5 polymerase (New England BioLabs), and 20µl of 5x Q5 buffer (New England BioLabs). The forward and reverse primers are created using the Custom Primers - OligoPerfect™ Designer (Thermo Fisher).
The BP recombination was performed by combining 2 µl of template DNA (about 100-200 ng of DNA), 1 µl of pDONR vector (150 ng/µl) , and 2 µl of 5X BP Clonase (Invitrogen). The mixture is vortexed and centrifuged twice to ensure thorough mixing and then allowed to incubate overnight at 37° C. 1 µl of Proteinase K (Invitrogen) solution is added to the reaction following incubation and left to react at 37° C for 10 minutes. 2 µl
of this reaction mixture is then used to transform into Subcloning Efficiency DH5α
The LR recombination reaction uses 1 µl of the product (100-300 ng) from the BP reaction in combination with 2 µl of destination vector (150 ng/µl), 13 µl of TE buffer, and 4 µl of LR Clonase (Invitrogen). The destination vectors used are listed in section 2.1.4. The mixture is vortexed and centrifuged twice and allowed to incubate overnight at 37° C. The resulting procedure is the same as described for the BP recombination reaction—Proteinase K is added to the mixture, incubated, and transformed into competent cells. The destination vectors are Ampicilin (Amp) resistant and therefore should be plated on LB Amp agar plates and then inoculated in LB Amp liquid.
All constructs are sent to the Robarts Research Institute at University of Western Ontario for DNA sequencing to verify its identity using pDONR and specifically designed sequencing primers.
Yeast Cell Viability Assay
2.2.4
Yeast cell viability is measured using two methods—spotting assays and the growth curve assay by using the BioscreenC instrument (Oy Growth Curves Ab Ltd).
Spotting Assays
2.2.4.1
Spotting assays are performed by first inoculating yeast cells in 3 mL in SD media and incubated overnight in a shaking incubator at 30° C. 100 µl of the cells are then taken in
an Eppendorf tube to be diluted 1:10 in water in order to measure the OD600, which
indicates cell density. In a 96-well plate, we dilute our cell cultures to a cell density normalized to OD600 =1 in the first row of wells, followed by a serial dilution of 1:5 in the
Aging spotting assays were performed by inducing the yeast culture in Gal for the desired amount of days and then spotted following the procedure above.
Growth Curve Assay
2.2.4.2
The growth curve assay is performed by first inoculating yeast cells in 3 mL SD media overnight in a 30° C shaking incubator. The cells are then spun down by centrifugation and washed twice with sterile water (resuspending in water, centrifuging, and decanting the supernatant). Following the wash step, the cells are induced by resuspension in SGal media. The OD600 was measured by using the same procedure as described above for the
spotting assays. After measuring the OD600, we dilute the cells to a cell density of
OD600=0.2 and transfer 300 µl of the culture into corresponding wells of a honeycomb
well plate. The assay runs for 3 days with 15 min read intervals. Shaking is set to turn on for 10 sec prior to the read. The incubation temperature is 30° C and the 600 nm filter is used. Prism 6 (Graph Pad) is then used to analyze the data, the replicates are averaged, and the standard deviation calculated using the available programs in Prism.
Fluorescent microscopy
2.2.5
Microscopy imaging of YFP tagged constructs was done by first inoculating yeast cells in SD media at 30° C overnight. The cells are then washed twice with sterile water, induced in SGal media, and incubated at 30° C. After inducing for 16 to 20 hours, small samples of the culture are placed on a microscope slide. The cells are imaged on Olympus BX-51 Bright Field/Fluorescence Microscope and images were captured using an equipped CCD camera (Spot Pursuit).
Western Blot
2.2.6
500 µm in diameter) to physically disrupt the cell walls by vortexing them 6 times for 30
sec intervals and cooling on ice for 30 secs between these intervals. We then spin the culture at 5000 xg for 10 mins and collect the supernatant in a fresh Eppendorf tube.
We perform a BCA Protein Assay to determine the concentration of protein in the sample. The assay was performed according to the Thermo Scientific Pierce BCA Protein Assay Kit Instructions. After obtaining the concentration and normalizing the total protein amount in each sample per blot, we dilute the samples with 4x reducing SDS buffer (0.25M Trisma Base pH 6.8, 8.0% SDS, 40% sterile glycerol, 10% β -mercaptoethanol, 0.04% bromophenol blue).
We run SDS-PAGE with the samples on a 8-16% gradient gel (Bio-Rad Criterion TGX Stain-Free Precast Gels) and/or 12% acrylamide gels at 220 V for about 30 mins. The gel is then transferred onto a Nitrocellulose or PVDF membranes (BioRad) using the Bio-Rad Trans-Blot Turbo machine following the manufacturer’s protocol. We then block the membrane using 5% skim milk powder (Carnation) in Phosphate Buffered Saline with 0.01 % (v/v) Tween (PBST) and incubating for 1 hr on a shaker. The membrane is then incubated in primary antibody overnight on shaker. Following incubation with the primary antibody, we wash the membrane with 50 ml aliquots of PBST at 10 min intervals for an hour on shaker and then incubate in the secondary antibody for 1 h on a shaker. The membrane is washed again with 50 ml aliquots of PBST in 10 min intervals on shaker for an hour. The membrane is then documented using the ChemiDoc MP System (Bio-Rad) and analyzed using Image Lab (Bio-Rad) and Prism 6 (Graph Pad).
Sedimentation Assay
2.2.7
The sedimentation assay was adapted from Theodoraki et al. (2012) and Shiber et al. (2013). A 5 mL yeast culture is first inoculated in SD media overnight. The culture is then spun down at 2000 xg, washed twice, and induced in SGal media overnight. We use OD600=1 amount of cells from the 5 mL culture. The 1 OD600 culture is then further spun
protease inhibitor tablet) and transferred into an Eppendorf tube. Acid-washed glass beads (425-600 µm, Sigma) are then added to physically lyse the cells by vortexing them 6 times for 30 secs intervals and cooling it on ice for 30 secs between the intervals. The tubes were pierced with a 16-gauge needle and the lysates (both pellet and supernatant) are collected in a fresh Eppendorf tube by centrifugation in pulses to separate lysates and glass beads.
The total lysates are resuspended and a BCA Protein Assay was performed to determine the concentration of total protein in the sample. The assay was performed according to the Thermo Scientific Pierce BCA Protein Assay Kit Instructions. 50 µl of the lysate was taken out and mixed with equal volume of SUMEB Buffer (8M Urea, 1% SDS, 10 mM MOPS, 10 mM EDTA, and 0.01% bromphenol blue) in a new tube, this aliquot represents total lysates. The rest of the lysate was spun down at 500 xg for 15 min at 4
oC. 100 µl of the supernatant was transferred into a new tube and mixed with 100 µl of
SUMEB buffer, this represents the supernatant portion of the lysate. The remaining supernatant from the lysate was aspirated off. The pellet was resuspended with 100 µl of the lysis buffer (without protease inhibitors) and 100 µl of SUMEB buffer, this represents the pellet portion of the lysate. The samples were boiled at 80 oC for 5 min and 25 µl of the samples were loaded onto a 12% acrylamide gel. The gel is then run according to the western blot procedures described above.
Mammalian Cell Transfections
2.2.8
recommended concentrations. HEK cells were transfected directly into 96 well plates for the viability assay and chamber slides for immunofluorescence microscopy.
Mammalian Cell Viability Assay
2.2.9
The CellTiter-Glo Luminescent Cell Viability Assay (Promega) was used in this study. This assay delivers a highly sensitive read out of cellular fitness and is particularly useful for studies on the toxicity associated with misfolded proteins. Transfected cells are split into 96 well plates and grown in DMEM (Corning) for HeLa cells or mimimum DMEM with 1% fetal bovine serum (FBS, Gibco) and 1 g/L glucose for HEK and N2a cells. This minimal medium increases sensitivity to the toxic effects of protein misfolding in many other systems [92], as well as differentiating N2a cells [93]. The cells are incubated at 37 °C for 20~24 hr. The cell viability assay is then performed according to the supplier’s instructions. Plates were then measured using the Victor3V Plate Reader (Perkin Elmer) using the Perkin Elmer 2030 Manager Software. Viability assays on N2a cells were measured using the Cytation 5 Cell Imaging Multi-Mode Reader (Biotek).
Immunofluorescence Microscopy
2.2.10
camera (Carl Zeiss). N2a cells were imaged with the Cytation 5 Cell Imaging Multi-Mode Reader (Biotek).
Statistical Analysis
2.2.11
Chapter 3
3
Results
3.1
The TDP
-
43 yeast model
We use spotting assays and growth curve assays to determine cellular toxicity in yeast cells. Reduction of growth rates is a well-established read out for the toxicity associated with protein misfolding in yeast models [11, 85, 94]. Spotting assays allow us to visualize cellular toxicity by juxtaposing different constructs diluted 1:5 side by side and assess the difference in growth, while growth curve assays provide quantitative results for cellular toxicity by comparing the growth curves of different constructs at different growth stages (lag, mid-logarithmic, and stationary phase). The combination of spotting assay and growth curve assay offers a more comprehensive understanding of the growth of different constructs, allowing us to infer cellular toxicity. All experiments in this study were performed with a minimum of at least three biologically distinct constructs unless otherwise specified (i.e. minimum of three biological replicates).
Figure 11: TDP-43 yeast model. A Schematic representation of the TDP-43 wild type construct fused with the yellow fluorescent protein (YFP). B Spotting assay showing TDP-43 toxicity when induced. C Growth curve assay showing TDP-43 toxicity of significance level p<0.0001. D Fluorescence microscopy image of TDP-43WT-YFP in BY
3.2
Sedimentation Assay
Although the localization and aggregation patterns of TDP-43 can be visualized using fluorescence microscopy, the changes in these patterns could not be fully characterized and quantified by using microscopic methods alone. TDP-43 aggregates have been especially difficult to characterize biochemically since TDP-43 has been described as “sticky” yet rather soluble [79], making it a challenge to quantify or characterize the changes in aggregation using conventional methods, such as filter retardation assays or semi-denaturing detergent agarose gel electrophoresis (SDD-AGE). To devise a reproducible and quantitative biochemical assay to determine TDP-43 aggregation, we have established here a novel sedimentation assay based on the solubility analysis assays of Theodoraki et al. (2012) [95] and Shiber et al. (2013)[96].
The sedimentation assay divides cellular protein lysates into two fractions, the pellet, which represents the insoluble portion of the lysate, and the supernatant, which represents the soluble portion of the lysate. The two fractions of the lysate were loaded onto a polyacrylamide (SDS-PAGE) gel along with a sample of the total lysate to ensure equal expression level. A detailed protocol of this assay is provided under Material and Methods in this thesis.
These results of the sedimentation assay correspond to the fluorescent microscopy images: 3X TDP-43 produces more diffuse signal throughout the cell (cytosol and nucleus) as shown in Figure 12D. The sedimentation assay was also performed on yeast cells expressing TDP-43 and empty vector (Figure 12G) and the blots probed with α- and
α-histone antibody as loading controls. The results show that the distribution of PGK-1 and histone does not change whether TDP-43 is expressed or not and therefore PGK-1 and histones can serve as proper loading controls for this assay.
Figure 12: Sedimentation assay and fluorescence microscopy of yeast cells expressing various TDP-43 constructs at different levels. Sedimentation assay and fluorescence microscopy images of A TDP-43WT-YFP in BY (MAT α) yeast cells, B
Next, we sought to assess whether the sedimentation assay can also serve to follow the shift of molecular chaperones to a more insoluble subcellular fraction under stress conditions that elicit protein misfolding and aggregation. Previous microscopic studies have shown that molecular chaperones can associate closely with such misfolded and aggregated proteins [19]. We performed the sedimentation assay on wild type yeast cells and applied protein folding stress chemically with azetidine-2-carboxylic acid (AZC) and by heat shock. AZC is an analog of proline and is able to reduce the thermal stability or lead to misfolding when competitively incorporated into proteins in place of proline [97]. The misfolding of these proteins induces protein-folding stress and activates the heat shock response in the cell. Proteins that have AZC incorporated have also been reported to misfold and aggregate and show increased binding affinity to Hsp70 [97]. We treat wild type cells with 2mM AZC for four hours or heat shock at 42 °C for one hour in order to observe a potential shift from a soluble to a more insoluble fraction of different molecular chaperones due to association of the chaperones with misfolded and aggregated proteins using the sedimentation assay.
First, we cultured wild type cells in YPD overnight and treated with AZC or heat shock and probed the sedimentation analysis blots with an anti-Hsp70 antibody. The Hsp70 family of cytosolic molecular chaperones is responsible for protein folding, the assembly of newly synthesized protein, and solubilizing protein aggregate and can be up-regulated under stress conditions to combat protein misfolding and aggregation [98]. The results are shown in Figure 13A. However, the statistical analysis of these results (Figure 13B) did not show significance. This may be due to the very high abundance of Hsp70 in the cell under normal and stress conditions. Therefore the effect of a shift to a more insoluble subcellular fraction of Hsp70s cannot be clearly observed in the sedimentation assay.
distribution of pellet-to-supernatant did not show significant change between the stressed and unstressed samples (Figure 13D). We speculated that stress treatment of cells in the extremely rich medium YPD did not elicit severe cellular stress due to high cell division rates. We therefore cultured wild type cells in SD media (a medium with less nutrients than YPD) overnight instead and stressed them under the same stress conditions. The results in Figure 13E show that the distribution of pellet-to-supernatant also did not show a significant change between the stressed and no stress samples (Figure 13F).
Figure 13: Sedimentation assays of stress treated wild type yeast and HeLa cells.
3.3
Hsp90
modulates TDP
-
43 stability, aggregation, and
toxicity in yeast
Hsc82 and TDP-43
3.3.1
We expressed TDP-43 and an empty vector as control in yeast cells that lacked the Hsc82 encoding gene (hsc82Δ), which is the constitutively expressed allele of Hsp90 in yeast. Growth assays and fluorescence microscopy were performed on hsc82Δ cells to observe TDP-43 toxicity and aggregation. Spotting assays show a slight increase in toxicity when compared to wild type yeast cells expressing TDP-43 (Figure 14A). However, this slight increase in toxicity is not reproduced in the growth curve assay (Figure 14B) as these results are not statistically significant. Fluorescence microscopy results show no significant difference in aggregation pattern of TDP-43 in hsc82Δcells when compared to wild type cells (Figure 14C). Western blots of the two TDP-43 expressing constructs show no difference in TDP-43 expression level (Figure 14G).
Figure 14: Hsc82 and TDP-43 interaction in yeast. A Spotting assays of wild type and hsc82Δ cells expressing TDP-43. B Growth curve assays of wild type and hsc82Δ cells expressing TDP-43. C Fluorescence microscopy of TDP-43 expressing hsc82Δ cells. D
Hsp82 and TDP-43
3.3.2
In yeast cells that lacked the Hsp82 encoding gene (hsp82Δ), spotting assay results show a slight rescue in TDP-43 toxicity (Figure 15A). This rescue increase in toxicity is not observed in the growth curve assay as hsp82Δ cells expressing TDP-43 grow similarly to wild type cells (Figure 15B). Fluorescence microscopy results show no significant difference in aggregation pattern of TDP-43 in hsp82Δcells when compared to wild type cells (Figure 15C). Western blots of the two TDP-43 expressing constructs show no difference in TDP-43 expression level (Figure 15G).
Figure 15: Hsp82 and TDP-43 interaction in yeast. A Spotting assays of wild type and hsp82Δ cells expressing TDP-43. B Growth curve assays of wild type and hsp82Δ cells expressing TDP-43. C Fluorescence microscopy of TDP-43 expressing hsp82Δ cells. D
3.4
Hsp90 co
-
chaperones
and TDP
-
43
We next tested the effect of the Hsp90 co-chaperones Aha1, Cdc37 and Sti1 on TDP-43 toxicity, localization, aggregation, and protein levels in yeast.
Aha1
3.4.1
In aha1Δ cells, both spotting assay and growth curve results show no change in TDP-43 toxicity, as wild type and aha1Δ cells grow at highly similar rates (Figure 16A and B). Fluorescence microscopy results show no significant difference in aggregation pattern of TDP-43 in aha1Δcells when compared to wild type cells (Figure 16F). Western blots of the two TDP-43 expressing constructs show no difference in TDP-43 expression level (Figure 16G).
Figure 16: Aha1 and TDP-43 interaction in yeast. A Spotting assays of wild type and aha1Δ cells expressing TDP-43. B Growth curve assays of wild type and aha1Δ cells expressing TDP-43. C Fluorescence microscopy of TDP-43 expressing aha1Δ cells. D
Cdc37 and TDP-43
3.4.2
Sti1 and TDP-43
3.4.3
In sti1Δ cells, spotting assay show no change in toxicity compared to the wild type cells (Figure 18A), however, growth curve results show a prolonged lag phase of sti1Δ cells
expressing TDP-43 (Figure 18B). The growth of sti1Δ constructs were tested at 37 °C
Figure 18: Sti1 and TDP-43 interaction in yeast – sti1Δ. A Spotting assay of wild type
and sti1Δ cells expressing TDP-43. B Growth curve assay of wild type and sti1Δ cells expressing TDP-43. C Fluorescence microscopy of TDP-43 expressing sti1Δ cells. D
Spotting assay of wild type and sti1Δ cells expressing an empty vector at 37 °C. E
Overexpression of Sti1 using a high copy plasmid in TDP-43 expressing wild type yeast cells show only a slight increase in toxicity in spotting assays compared to the other molecular chaperones (Figure 19A). On the other hand, a significant increase in toxicity is shown in growth curve assays (Figure 19B). Fluorescence microscopy results show less TDP-43 aggregates in the cytoplasm when Sti1 is expressed (Figure 19C).
Figure 19: Sti1 and TDP-43 interaction in yeast – Sti1 overexpression. A Spotting assay of TDP-43-expressing wild type cells high copy overexpressing Sti1. B Growth curve assay of TDP-43-expressing wild type cells high copy overexpressing Sti1 with significance level p<0.0001. C Fluorescence microscopy TDP-43-expressing wild type cells high copy overexpressing Sti1. D Spotting assay of TDP-43-expressing wild type cells overexpressing low copy Sti1. E Growth curve assay of TDP-43-expressing wild type cells low copy overexpressing Sti1 with significance level p=0.05. F Fluorescence microscopy TDP-43-expressing wild type cells low copy overexpressing Sti1. G Western blots showing TDP-43 expression level of wild type cells low copy overexpressing Sti1.
3.5
Mammalian Cells
We sought to validate the results shown for the overexpression of Sti1 in the TDP-43 yeast model in mammalian cells using HeLa, HEK, and N2a cells. The results are shown in the following sections.
HeLa Cells
3.5.1
Figure 20: TDP-43 interaction with Sti1 in HeLa Cells.A Luciferase viability assay, B
HEK Cells
3.5.2
Figure 21: TDP-43 interaction with Sti1 in HEK WT and STI1KO Cells. A