Smart Camera for Object Detection, Distance
and Relative Speed Estimation
Akshra N.R
1, Aarthi.K
2, Afrin Shaz.M
3,
Devimanohari.K.S
4, Dr.
R.Sundar
51,2,3,4,5
Electronics and Communication Department
Rajalakshmi Engineering College, Thandalam, Chennai
Abstract:
The aim of this project is to detect moving objects, estimate their distance from the camera and return these values to the user in a dynamic setup. The values returned are name of the object, accuracy in detection, x and y coordinates which will enable in calculating parameters like speed and distance of the object. Object detection is done using Deep learning using Neural Network. and is implemented using OpenCV and Python’s built in dnn (deep neural network) function. The MobileNet SSD used here is a
Caffe version of the original TensorFlow
implementation. This project combines object detection with distance estimation and speed to return the location for the required objects.
Keywords
Distance, OpenCV, Python, Mobile SSD, Caffe, MobileNet, SSD
1.
Introduction
Machine Learning, widely used in Artificial Intelligence is a set of various algorithms that help a computer to learn by observing the surroundings around it. Convolution Neural Network(CNN) is a method used to analyze images without the need for pre-processing[ii]. The CNN is mathematically a cross correlation. The convolutional layer of the CNN has a set of kernels. At every pass, dot product between the filter entries and the input is computed. The filter is activated only in the area where it detects the necessary features. The network learns that this happens in all its layers. The pooling layer, inserted between all the layers of a CNN, outputs the maximum for sub- regions inside unique rectangles partitioned from the input image. In this way, it provides an approximate location of a spatial feature
with respect to its neighbours hence reducing all the computational parameters needed
2.
Proposed System
The proposed system‟s working is explained using a block diagram and a flowchart.
2.1.
Block Diagram
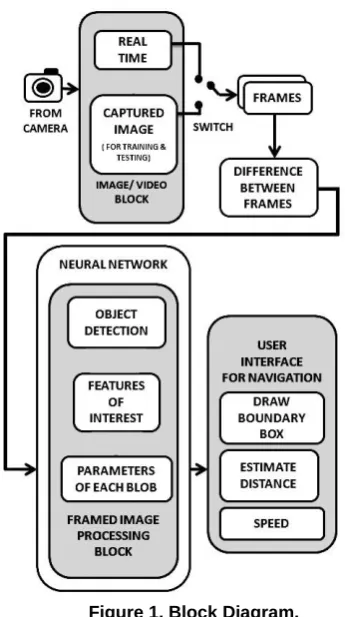
Figure 1 represents a visual model of a system, its
components, and their interactions.
Figure 1. Block Diagram.
Figure 1 consists of three blocks with provisions for hardware extensions as and when needed. The input is obtained from the „Image/Video Block‟ that is capable of producing real time video streaming or a captured video streaming. Real time video inputs are gotten from a webcam Logitech C270 attached to the device. The device used here is Lenovo G400 with 2.6Ghz intel Core i5 3230M Processor. Captured videos are used for test cases and to calculate speed from a video output like CCTV cameras placed on roads, highways, homes etc. The Input video is separated as frames and the difference between the frames are calculated; this information is fed to the „Framed Image Processing Block‟. Here the object detection takes place where the features of interest along with the parameter details of each blob are obtained by the use of a pre-trained neural network
[vii]
. The captured information is used to classify an object and draw a bounding box. X and Y coordinates are gotten and are processed to determine the position, distance and speed of the moving object. All the processed information is given as output at the „User Interface Block‟, where the information is made available to the user via monitor screen or speech output. Further work can be done connecting a speaker and adding a speech engine for text to speech control and an LCD screen as a monitor display.
2.2.
Flow Chart
The process or set of rules to be followed in the operation of smart camera starts from the software part. Figure 2 explains this process in a number of steps
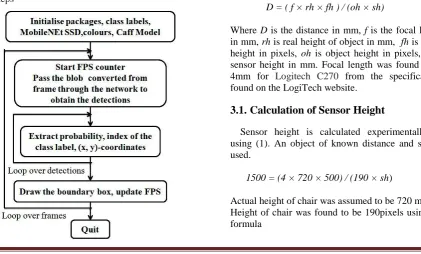
Figure 2. Flow Chart.
First of all the initialization is done by importing the necessary packages. The packages imported are imultils 0.4.5, python 3.6.3, OpenCV 3.3.0, numpy 1.13.3 FileVideoStream (for videos on file), VideoStream (for real time videos). The network architecture used is GoogleNet and the framework used is Caffe. The frame per second counter is initialized so as to make speed calculation easier. List of classes and colours are also initialized. Prototxt, model and default probability value is given as input for the program. Src is initialized as 1 for videostream[ix] and 0 for real time input. Height and width of frame is specified. Since computations are done with a video file, frames should first be extracted. They are looped till the „esc‟ or „q‟ key is pressed. Caffe model[iii] is loaded from disk. Required parameters such as colour and shape are extracted so as to form a blob using Deep Neural Network[iv] provided by OpenCV. These are passed to the network which compares these to pre-set images gotten from „ImageNet‟ and the objects are classified into 20 classes, some of which include "bicycle", "bottle", "bus", "cow", "cat", "chair", ”car”, "table", "dog", "person", ”plant" etc. Using X and Y coordinates of the object, a rectangle of random colour is drawn with name of object, accuracy of detection, distance and relative speed as labels. The FPS is updated. The elapsed time and number of frames are also calculated.
3.
Distance and Speed Estimation
D = ( f × rh × fh ) / (oh × sh) (1)
Where D is the distance in mm, f is the focal length in mm, rh is real height of object in mm, fh is frame height in pixels, oh is object height in pixels, sh is sensor height in mm. Focal length was found to be 4mm for Logitech C270 from the specifications found on the LogiTech website.
3.1.
Calculation of Sensor Height
Sensor height is calculated experimentally by using (1). An object of known distance and size is used.
1500 = (4 × 720 × 500) / (190 × sh) (2)
oh = endY - startY (3)
Where endY is the coordinates of end of rectangle drawn on the object in the image
startY is the staring coordinates of the bounding box for object
From this, sh was calculated to be 5.05
3.2.
Calculation of Speed
speed = distance / ( fps × 1000 × 3.6) (4)
Where fps is frames per second approximated to 2 (for 500 × 500 frame) using data obtained during previous run, speed is in kmph and distance is in m.
3.3.
Object Movement
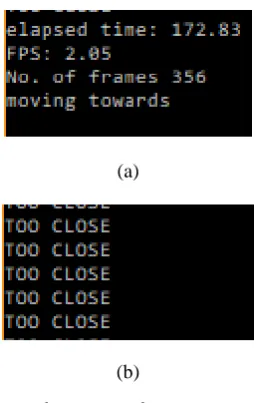
The object detected in the video can be classified as moving towards or away from camera and “TOO CLOSE”[vi] is printed it the distance between camera and object is less than 1.5m.
This is done by creating an empty list, appending oh to the list after ever frame is processed, comparing third and fourth values of oh in the list.
“Moving away” is printed if third element is greater than fourth element.
“Moving towards” is printed if the condition is vice versa.
4.
Result Analysis
The program is executed, the results are obtained and the data is analyzed.
4.1.
Test Cases
Figure 3 shows the test case of a car moving towards the camera. A captured video is used here. The information displayed includes:
Name of detected object, the accuracy of detection (default value set is 50%), the distance of object in m and the speed of object in kmph. Multiple object detection is observed here and the result of “Moving Towards” is displayed. RGB pixel values are also displayed.
Figure 3. Test case 1.
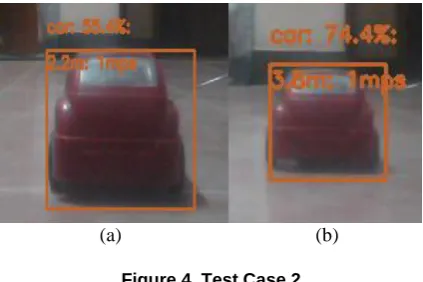
Fig 4 (a) and (b) are real time images of a toy car. Test case 2 shows the car moving away from camera. The difference in distance is apparent. The speed is in mps as it is very small as only a remote is used to control the speed of this car.
(a) (b)
Figure 4. Test Case 2.
Figure 5 shows the output screen for the above images that show relevant information
Figure 5. Python Output screen.
Fig 6(a) and (b) are real time images of a toy car. Test case 3 shows the car moving towards camera.
Figure 6. (a) Test case 3.
Figure 6. (b) Test case 4.
Fig 7 (a) and (b) are outputs of test cases 3 and 4 respectively
(a)
(b)
Figure 7. Python Outputs
Fig 8 shows test case 5 where multiple objects other than cars are detected.
Table 1 shows information on height of object assumed and the difference between measured and calculated values.
From the table, the inference obtained was that this system detects distance with an error of about 2 to 7 meters and speed with an error of about 10%. The object class with the most error percent seems to be “Person”, This is because as a person gets closer, the bounding box splits into two smaller ones in a few extreme cases of distance of about 2 meters.
Table 1. Tabular Representation of Data
5.
References
[i] Patricia Rayon Villella, J. Humberto Sossa Abuela., "Object Recognition By Indexing Using Neural Networks“, Department De computacion ITESM-Campus Ciudad De Mexico, 0-7695-0750-6/00,2000
[ii] Wang Zhiqiang, Lip Jun., "A Review of Object Detection Based on Convolutional Neural Network ",36th Chinese control conference, Dalian, China, 26-28 July 2017 [cs. CV] ,17 April 2017
[iii] Andrew G. Howard, Bo Chen.,"Mobile Nets: Efficient Convolutional Neural Networks for Mobile Vision Applications “, Google Inc., arXiv:1704.04861v1 [cs. CV],17 April 2017
[iv] Xini Zhou, Wei Gong, WenLong Fu, Fengtong Du.,"Application of Deep Learning in Object Detection “, Communication university of China, 2017 IEEE, 24-26 may, 2017
[v] Josef Cernohorsky, Pavel Jandura, Ondrej Much.,"Mobile Robot Localization and Object Description”,Technical university of Liberec, 2017 IEEE, 978-1-5090-4862-5
[vi] Dhruv Pande, Chhavi Sharna, Vikas
Object
Original distance (m)
Measu-red distance
(m)
Original speed
Mea-sured speed
Height assumed
(mm)
toy
car 2.8 3 0.9 mps 1 mps 50
Real
car 70 77 10 kmph
8.6 - 14.4 kmph
1652
chair 1.4 1.5 0 mps 0.1
mps 720
Monocular Vision”, NIIT University, Neemrana, Rajasthan, 2014 IEEE, 978-1-4799-3140-8
[vii] Jianhua Wang, Jinjin Lu, Weihai Chen, Zinging Wu., "Convolutional Neural Network for 3D Object Recognition Based on RGB-D Dataset”, Beihang University, Beijing, 2015 IEEE, 978-1-4799-8389-6
[viii] Peyman Alizadeh, "Object Distance Measurement Using a Single Camera for Robotic Application”, Laurentian University, Canada, 2015