DOI: http://dx.doi.org/10.26483/ijarcs.v8i7.4463
Volume 8, No. 7, July – August 2017
International Journal of Advanced Research in Computer Science
RESEARCH PAPER
Available Online at www.ijarcs.info
ISSN No. 0976-5697
PERFORMANCE EVALUATION OF FREE SPACE OPTICAL COMMUNICATION
SYSTEM FOR RAYLEIGH FADING ENVIRONMENT
Swati Thakur
Department of ECE IKG Punjab Technical University
Kapurthala, India
Abstract: Due to ability to provide very high-speed transmission of data, without the use of any physical channel, free space optics (FSO) is an emerging as a promising communication technology. In FSO, the atmosphere ants as the channel and its turbulent nature causes degradation in bit error rate performance. This paper presents the performance evaluation of FSO communication for through Rayleigh fading environment. The equations for Bit Error Rate and Outage Probability are derived for BPSK, QPSK and 16-QAM modulation techniques. Simulation results has been presented out to calculate the FSO communication system performances derived for BPSK, QPSK and 16-QAM modulation techniques.
Keywords: 16-QAM,Bit error rate, BPSK, outage probability, power margin, QPSK, Rayleigh fading.
I. INTRODUCTION
In traditional communication systems, electrical signals are used for transmission of information. The need of faster data transfer and large bandwidth resulted in the invention of optical communication, which not only provides efficient transmission but also provides very high data rates. Fiber is used as the medium in conventional optical communication system. But fiber optic communication requires additional components such as electrical to optical converters and vice versa, resulting in add to the system cost. Moreover, installing fiber over large network is a tedious job and requires municipal and government approval to lay the fiber underground by digging along road side and across the road where ever required. Optical fibers are very delicate, so have to be handled with care. A little more stress may cause damage to the fiber which results in loss of data. The repair of the damaged sectors is very difficult as it would require digging up the location of that sector again. This led to the invention of Free Space Optics (FSO) which is wireless optical communication system. Along with the solution to a number of above said issues, this technology introduced a number of more advantages and applications. The capital investment for the installation of FSO system is less than a fifth as compared to ground based fiber optic technology. Moreover, they can be installed much more quickly. Some common applications are metro network extensions, last-mile access, enterprise connectivity, fiber backup, backhaul, service acceleration etc [1].The characteristics of the channel play a vital role in designing, implementation and operation of a free space optical communication system. The outdoor channel of a FSO system is usually the atmosphere which is a complex dynamic environment. The optical beam can be affected by this environment resulting in losses and turbulence induced amplitude and phase fluctuation. A number of models to characterize the statistical nature of the atmospheric channel are designed by scientists who take into account different atmospheric situations such as fog,
haze, rain etc. Apart from this, various modulation techniques have been invented [2].There are a number of performance metrics by which the condition of received signal can be determined. These can be listed as Bit Error Rate (BER) which provides the amount of error bits per unit time present in the signal on reception at the receiver; Bit energy to noise ratio, defined as the ratio of Energy per Bit to the Spectral Noise and also called as Signal to Noise ratio for digital communication system; Outage Probability (Pout), defined as probability of degradation of signal to an extent that it could not be recovered; and Power Margin (m) defined as the amount of extra power required to prevent the signal from outage. The focus of this paper to find BER, outage probability and power margin expressions in terms of Bit energy to noise ratio while transmission of optical signal through Rayleigh fading channel after application of BPSK, QPSK and 16-QAM modulation techniques and to determine and compare the performance of FSO system in these three modulation techniques. The paper is organized as follows: mathematical preliminaries required for BER deviations are given in section II., section III presents the derivations for BER for different modulation techniques and derivations for outage probability calculation is presented in section IV. Section V presents the simulation results and discussions. Which is followed by conclusion in section IV.
II. MATHEMATICAL PRELIMINARIES FOR BIT ERROR
RATE CALCULATION
( )
(
)
2 2 0 2 2 0ln / / 2 1 exp 2 2 l e l l I I
P Q I dI
I σ γ σ πσ ∞ + = −
∫
(1)Here, γ(I) represents the electrical SNR per bit and is given by 2 2
2
κ σ
andκ
=
RI
ξ
2
. Substituting the values of parameters R and ξ [3], we get( )
2 2/ 2 l
I I
γ = σ .The
equation (1) can be solved by Gauss-Hermite quadrature integration approximation [2,3] and the unconditional BER given in equation (1) can be reduced to the following form:
(
)
(
2)
0 1
1
1
exp 2 / 2
n
e i l i l
i
P w Q K K σ x σ
π =
≅
∑
− (2) where wi and xi are the weight factors and zeros of an nth-order Hermite polynomial.
Generally, whenever the term M-ary PSK is mentioned, it refers to M≥4 (QPSK, 8 -PSK and so on), despite the fact that BPSK also falls under same category. The ary modulator modulates the input signal using M-ary PSK modulation technique and returns a complex output. M is the number of points in constellation of signal which represents the data symbols. The number of binary digits used in each symbol can be given by log2M. The unconditional BER for M-ary PSK is given [2] as
(
)
(
)
(
2)
2 0
1 2
2
log sin / exp 2 / 2 log
n
e i l i l
i
P w Q M M K x
M π σ σ
π =
=
∑
−(3) In case of QPSK, i.e. M=4, the equation 3 becomes
(
)
(
)
(
2)
0 1
1
2
sin
/ 4 ex p
2
/ 2
ne i l i l
i
P
w Q
K
π
σ
x
σ
π
==
∑
−
(4)
Unlike QPSK, QAM modulating signal makes changes in the phase as well as the amplitude of carrier signal, which is a sin wave. It can be implemented with hardware by generating and mixing of two sin waves that are perpendicular to each other. The phase and amplitude of final signal can be varied by adjusting the amplitude of any one of the two waves. The two carrier waves are represented by in-phase (I) and quadrature-phase (Q) components of the signal. Here, M=8 for 8-QAM, M=16 for 16-QAM, and so on [4]. The unconditional BER for M-ary QAM is given as [2]
(
)
(
)
(
2)
0 2 1
2
2 1 1/ 3log
exp 2 / 2 2 1
log
n
e i l i l
i
M K M
P w Q x
M
M σ σ
π = − = − −
∑
(5) In case of 16-QAM, M=16. The equation 5 becomes(
2)
0 1
3 2
exp 2 / 2
5 8
n
e i l i l
i
P w Q K σ x σ
π = = −
∑
(6)III. DERIVATION OF BIT ERROR RATE FOR RAYLEIGH
FADED FSOCHANNEL
Fading refers to variation (mostly reduction) of amplitude of wireless signal as it propagates through a channel. It may occur due to multipath propagation, long
distances or scattering material present in the path of transmission. It reduces the strength of the signal, thus deteriorating the performance of the communication system. Broadly speaking, fading channels are categorised into three: Additive white Gaussian noise (AWGN), Rayleigh and Rician fading channel. In this article, investigations as carried out for signals passing through Rayleigh fading. Rayleigh fading model is applicable when a number of objects or particles are present in the atmosphere that scatter the light signal as it is transmitted towards the receiver. If the amount of scattering is large, then the channel impulse response will be modelled as Gaussian, despite the distribution of individual components of the signal. If there is no dominant component, then the phase will be evenly distributed between 0 and 2π radians, thus having zero mean. The envelope thus formed will be Rayleigh distributed [4]. Consider that the channel amplitude scaling factor (‘h’) estimate at receiver is known and is accurate [4]. The transmitted symbols (‘x’) can be obtained from the received signal (‘y’) by the process of equalization as given below:
y hx n
y x z
h h
∧ +
= = = +
(7) Segregating the factor z into noise and scaling factor, equation 7 is written as
* noise SF y x h ∧ = + (8) Here, noise and h are Gaussian random variables and SF is the scaling factor of modulated signal as well as fading induced by Rayleigh Channel. Let noise and h be random variables X and Y having variance of 0.5 each, which generates the one tap complex Rayleigh fading process [4]. SF is a combination of amplitude scaling of the signal induced by Rayleigh fading channel and the modulation technique used before transmission. This creates scaling of amplitude of the signal as it passes through the channel and can be given as follows:
SF= Rayleigh Fading factor * modulation scaling factor
0 1 * b SF MSF E N = (9) The equation 8 can be rewritten as:
( ) * ( )
random X SF
y x
random Y
∧
= +
(10) Let the numerator of equation 10 be written as
random(X) * SF = random(W).
The variance of random variable W is the product of variance of random variable X and square of SF [5]. The equation 10 can be rewritten as
(
)
( )
random W
y
x
random Y
∧= +
(11) The variance of ratio of two random variables is [5]V(W/Y)= V(W)+V(Y)-2*V(W)*V(Y)*Corr(W,Y) (12)
V(W/Y)= V(W)+V(Y)
The variance in terms of Bit energy to noise ratio for these two modulation schemes becomes
2 1 1
( ) 0.5 0.5
2
b o
b o b o
E N
V W Y
E N E N
σ +
= = × + =
(13)
Since, QAM scheme is a combination of phase and amplitude modulations, the scaling occurs on both these components. Therefore, the scaling factors of amplitude and phase have to be multiplied to achieve the overall scaling factor of this modulation scheme which is in contrast to M-PSK schemes, where only channel fading contributes to the overall scaling of the signal. Scaling factor is for normalizing the average energy to one. The total energy of M-QAM depends upon the value of M and is given as [6]
(
)
2
1
3
avg
Energy
=
E
=
M
−
(14)
From the above equation, energy for 4-QAM comes out to be 2, for 16-QAM is 10 and so on. In order to normalize each bit of a symbol, the scaling factor used is equal to
avg
E
k
, where k is the total number of bits in eachsymbol. Therefore, the modulation scaling factor is equal to
avg b
E
k
=
E
[6].From equation 9, the overall scaling factor consisting of Rayleigh channel scaling factor and modulation scaling factor becomes
1 1 avg
b
b o b o
E
SF E
E N E N k
= × = ×
(15)
For BPSK and QPSK, the modulation scaling factor
E
b is1 whereas, for 16-QAM, Eavg=10, k=log2M =4. Therefore,
0 5 2 b SF E N = . (16)
Overall variance of Rayleigh channel in case of 16-QAM is derived as follows:
^ ( ) ( )
( ) ( )
Random X Scaling factor Random W
y x x
Random h Random h
×
= + = +
(1 7)
Variance of random (W) becomes,
2
0 0
1 5 5
( )
2 4
2 b b
V W
E N E N
= × =
(18)
Variance of random (h) becomes,
V Y
( )
=
1 / 2
Now, the overall variance for division of two random variables is given as [5]
( )
( ) ( ) 2* ( ) * ( ) * ( , ) ( )
Random W
V V W V Y V W V Y Co rr W Y
Random Y
= + −
(1
9) Since, the variables W and Y and independent of each other, therefore, correlation between them is zero.
Hence, ( ) ( ) ( )
( )
Random W
V V W V Y
Random Y = + (20) 2 0 0 2 5 ( )
( ) 4
b
b
E N
Random W V
Random Y
σ
E N = = +
(21)
Substituting equation 13 into equation 2, BER for BPSK modulation becomes
0 0
0
1 0 0
1 1 1 exp 4 n b b
e i i
i b b
E N E N
P w Q K x
E N E N
π
= + + = − ∑
(22)Substituting equation 13 into equation 4, BER for QPSK modulation becomes
(
)
0 00
1 0 0
1 1
1
2 sin / 4 exp
4
n
b b
e i i
i b b
E N E N
P w Q K x
E N E N
π π = + + = −
∑
(23)Substituting equation 21 into equation 6, BER for 16-QAM modulation becomes
0 0
0
1 0 0
5 2 5 2
3 2
exp
5 2 8
8
n
b b
e i i
i b b
E N E N
P w Q K x
E N E N
π = + + = −
∑
(24)IV. DERIVATION OF OUTAGE PROBABILITY FOR
RAYLEIGH FADED FSOCHANNEL
Outage probability is another performance metric which is useful to determine the probability of outage of signal in case of deep fading when average BER is less than its threshold value. It can be depicted in terms of SNR as f [2]
( )
(
*)
out
P
=
P m
γ
I
<
γ
(25)
where
γ
* is average SNR for given noise channel with no atmospheric turbulence and m is power margin which is extra power supplied to enhance the signal strength whichhas had weakened due to turbulence induced fading.
P
outdepicts the probability of signal outage when SNR becomes less than the threshold value and the signal is not able to reach at the receiver end. It is also useful to determine how much extra power be supplied to enhance the signal strength, so that the required SNR be achieved. General expressions for outage probability (Pout) and power margin (m) are[2]:
1 ln 2 l out l
P Q m
σ
σ
= −
(26)
(
2 2)
exp 2 ln 2 out l l / 2
m= − P
σ
+σ
Substituting equation 13 into equation 26 and 27, Pout and m for BPSK and QPSK modulation becomes
0 0
0 0
2 / 1 1 /
ln
1 / 2 2 /
b b
out
b b
E N E N
P Q m
E N E N
+
= + −
(28)
0 0
0 0
1 / 1 /
exp ln 2
/ 4 /
b b
out
b b
E N E N
m P
E N E N
+ +
= − +
(29)
Substituting equation 21 into equation 26 and 27, Pout and m for 16-QAM modulation becomes
0 0
0 0
4 / 1 5 2 /
ln
5 2 / 4 /
b b
out
b b
E N E N
P Q m
E N E N
+
= + −
(30)
0 0
0 0
5 2 / 5 2 /
exp ln 2
2 / 8 /
b b
out
b b
E N E N
m P
E N E N
+ +
= − +
(31)
V. SIMULATIONRESULT
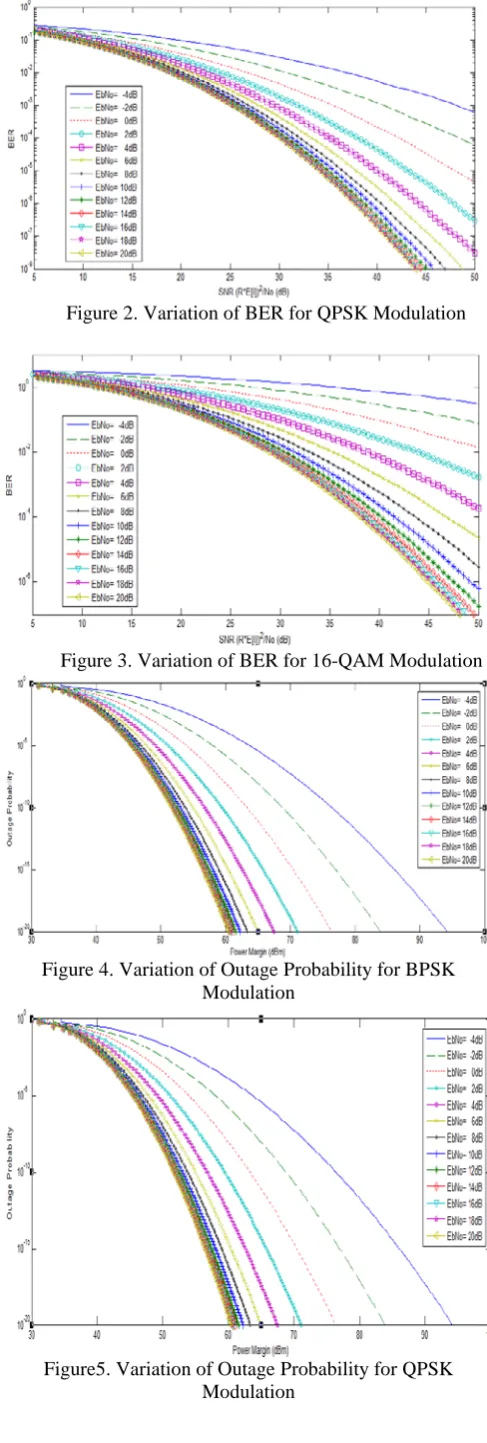
From Figure 1, it can be inferred that the BPSK and QPSK performance is equivalent however, it is different for 16-QAM. For lower values of Bit energy to noise ratio (i.e. from -4 to 10 dB), QPSK and BPSK shows drastic decrease in BER values as compared to 16-QAM. At values from 10 to 20 dB, the performance of all the three modulation schemes is almost the same. This means that if the energy per bit is high, then the BER performance of signal remains same irrespective of the modulation formats. It can also be inferred that if a signal with low energy is transmitted through an AWGN channel, using all the three modulation schemes then the QPSK and BPSK modulation should be preferred over 16-QAM because the modulation scaling factor
b
E is 2.5 average in 16-QAM and is unity in
BPSK and QPSK.
Figure1. Variation of BER for BPSK Modulation
Figure 2. Variation of BER for QPSK Modulation
[image:4.595.313.557.57.779.2]Figure 3. Variation of BER for 16-QAM Modulation
Figure 4. Variation of Outage Probability for BPSK Modulation
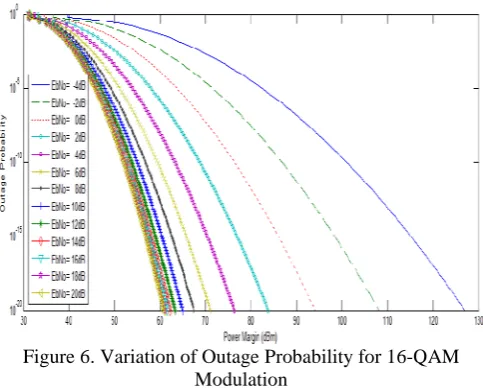
Figure 6. Variation of Outage Probability for 16-QAM Modulation
Figures 4, 5 and 6, relates outage probability with power margin for particular values of Bit energy to noise ratio. Power margin is the term which tells how much extra power is required to supply to the signal so as to avoid it from getting outage or useless. It can be observed that for particular value of Pout(outage probability) the extra power (Power Margin) needed to sustain the strength of signal will be large at smaller values of Bit energy to noise ratio. Also, it can be analyzed that for Bit energy to noise ratio ranging from -4dB to 2 dB, the deviation in graphs is more significant as compared to 2 to 10dB values and it is least for values greater than 10 dB. It signifies that power margin or the extra power required to supply to the signal for achieving a sufficient signal strength at receiver end in order to avoid outage is meaningful in the above-mentioned range. It can also be inferred that the amount of energy needed to supply in order to achieve least power margin is maximum in 16-QAM as compared to BPSK and QPSK. Therefore, 16-QAM should be least preferred over other two modulation schemes. This justifies the point of observation in Figures 1, 2 and 3. The reason for inferior performance of 16-QAM is supported by the fact that the QAM modulation is a combination of phase modulation and amplitude modulation of the signal, whereas, M-PSK consists of phase modulation only. Since, the effect of turbulence is maximum on amplitude than on phase of a signal, therefore, signal with QAM modulation is affected more than that of M-PSK modulated signal.
VI. CONCLUSION
In this paper, the performance of free space optical communication system has been analyzed for BPSK, QPSK and 16-QAM modulation techniques. The environment has been considered to be following the Rayleigh distributed characteristics. The expressions have been derived for calculating the Bit Error Rate and outage probability for BPSK, QPSK and 16-QAM modulation techniques. To calculate the performance, MATLAB has been used. Results show that the effect of turbulence is maximum on amplitude than on phase of a signal, therefore, QAM modulation is affected more than that of M-PSK modulated signal.
VII. REFERENCES
[1]. S. Parkash, P. K. Bhatia, D. Kumar, and H. Kaur, “Performance investigation of CRZ modulation format in GEPON fiber to the home (FTTH) network at 2.5G/bits for 200 ONU’s,” in Proceedings of the 2nd International Conference on Advances in Computing and Communication Engineering (ICACCE ’15), vol. 1, pp. 360–365, IEEE, Dehradun, India, May 2015.
[2]. E. Ciaramella, Y. Arimoto, G. Contestabile et al., “1.28 Terabit/s (32×40 Gbit/s) WDM transmission over a double-pass free space optical link,” in Proceedings of the Conference on Optical Fiber Communication (OFC ’09), pp. 1–3, San Diego, Calif, USA, March 2009.
[3]. N. Kumar and T. Singh, “2.50 Gbit/s optical CDMA over FSO communication system,” Optik—International Journal for Light and Electron Optics, vol. 125, no. 16, pp. 4538– 4542, 2014.
[4]. S. Chaudhary, P. Bansal, and M. Lumb, “Effect of beam divergence on WDM-FSO transmission system,” International Journal of Computer Applications, vol. 93, no. 1, pp. 28–32, 2014.
[5]. J. Wang, J. Lv, G. Zhao, and G. Wang, “Free-space laser communication system with rapid acquisition based on astronomical telescopes,” Optics Express, vol. 23, no. 16, pp. 41–50, 2015.
[6]. H. M. Oubei, C. Li, K. Park, T. K. Ng, M. Alouini, and B. S. Ooi, “2.3 Gbit/s underwater wireless optical communications using directly modulated 520 nm laser diode,” Optics Express, vol. 23, no. 16, pp. 20743–20748, 2015.
[7]. V. Sharma and G. Kaur, “High speed, long reach OFDM-FSO transmission link incorporating OSSB and OTSB schemes,” Optik—International Journal for Light and Electron Optics, vol. 124, no. 23, pp. 6111–6114, 2013.
[8]. V. Sharma and Sushank, “High speed CO-OFDM-FSO transmission system,” Optik, vol. 125, no. 6, pp. 1761–1763, 2014.