DOI: http://dx.doi.org/10.26483/ijarcs.v8i8.4735
Volume 8, No. 8, September-October 2017
International Journal of Advanced Research in Computer Science
RESEARCH PAPER
Available Online at www.ijarcs.info
ISSN No. 0976-5697
DEFECT IDENTIFICATION IN THE FRUIT APPLE USING K-MEANS COLOR
IMAGE SEGMENTATION ALGORITHM
PL.Chithra
Research Supervisor Department of Computer Science
University of Madras ,Chennai, Tamil Nadu,India.
M.Henila
Research Scholar Department of B.C.A. Ethiraj College For Women ,Chennai ,
Tamil Nadu, India.
Abstract: To propose a variation in the already existing algorithm to find whether an apple is defected or not, is the primary objective of this paper. The defected part on an apple’s image is identified using K-means segmentation algorithm. Color images of Apples with certain defects are taken as input dataset for applying the newly proposed algorithm. Color components of an apple’s image are used for segmentation. K-means clustering technique – an iterative process is used to partition an apple’s image into k clusters. Pixels are clustered based on color intensity values and images are generated to identify the defected part. After detecting the defected part, image enhancement is done using median filter in order to enhance the defected part and which in turn will increase the efficiency of classification process in the proposed algorithm. The experimental study clarifies the effectiveness of both the already existing method and newly proposed method.
Keywords : Digital image processing, image segmentation , apple image, defect detection, k-means clustering.
I. INTRODUCTION
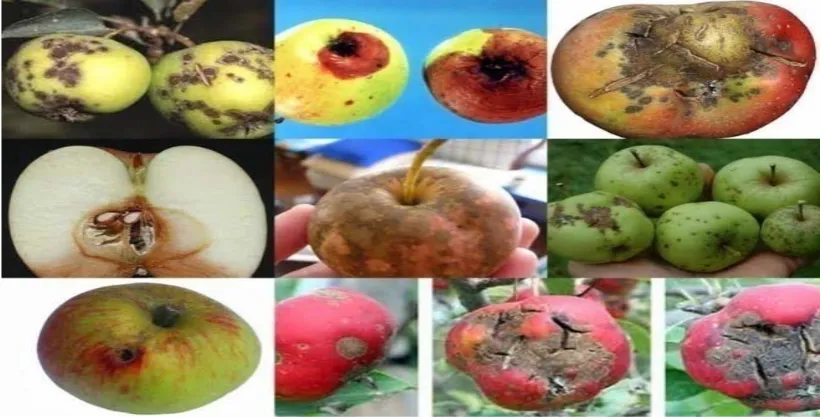
Digital images are highly effective in conveying certain attributes that help in certain evaluations. In food science the process of identifying the defect in any fruit acts an important role. Quality of an apple fruit depend upon the size, color, shape and presence of defect. Different kinds of defects are rot, blotch, cork spots, scab, fungi attack, bitter pit, bruising, punches, insect holes and growth defects [fig.1.1]. Many research papers have proposed many machine vision methods for identifying and classifying
[image:1.595.93.506.499.708.2]apple defects, as detecting defects in fruits at an early stage can help reduce additional infection spreading to other parts of the fruit which will help the agricultural industry. Thus quality evaluation in terms of defect detection has proven to be a major research area in computer vision to get closer to human levels of recognition. Different applications related to food items are there that are based on image processing techniques. Some among them are applications in fruit grading , yield mapping , robot harvesting , leaves disease detection , weed detection, etc.,
Fig. 1.1 : Apple images with defects like rot , scab and corkspot
Major steps involved in any fruit defect identification process using image processing are image acquisition and preprocessing, followed by feature extraction and classification. In this paper, section II analysis related works
PL.Chithra et al, International Journal of Advanced Research in Computer Science, 8 (8), Sept–Oct 2017,381-388
© 2015-19, IJARCS All Rights Reserved 382
II. RELATED WORKS
Since 1980’s a lot of work was done for the quality evaluation of apples using digital image processing. Image acquisition is the method of acquiring the apples image. General method of capturing is capturing using a CCD camera or through some special mechanism. Preprocessing steps are carried out before extracting the required features from it. Usually the color images that are captured will be converted to a form that will help in easy extraction of features. Features like color, intensity, texture, shape etc., are extracted in order to differentiate normal apple images from the defected ones. Extracted features are given as inputs to the classifier in order to declare the desired result usually samples with defect and samples without defect. Some of the research papers related to apple fruit defect detection are discussed below; Ghobad et al., [1] has proposed a method in which images of six Iran apples with some defect was acquired through 3-CCD matrix type camera from one-view wherein apple samples were kept in an illumination chamber in order to provide diffuse illumination over the fruit surfaces. They have observed that the color space L*a*b* provides better feature space for segmentation of color images than other color spaces. Then the shape of apple images is extracted by Active Counter Model [ACM] algorithm. Background removing was done using ACM algorithm. The statistical histogram based EM algorithm .This method is based on the intensity of the image which counts the parameters pixel by pixel as a result it increased the convergence of the iteration faster rather than only using EM algorithm. 91.72% accuracy for healthy pixel and 94.86% accuracy for defected ones were observed. Also the proposed Statistical histogram based EM (SHEM) was better than the normal EM-based algorithm in terms of speed in the proposed paper.
R.Sivamoorthi et al.,[2] in their work, aquired 20 normal apple images and converted them to L*a*b* color space for removing unwanted pixels. They have used Local binary pattern algorithm for extracting features. Also they have used color histogram, color invariant for extraction and these images were stored in database as training image features. Features of the test image are extracted and are saved as test image features. The authors passed the training image features and the test image features into a classifier. The Neural network classified the image into disease affected and not affected image. If the given image is abnormal the images were segmented using K-means segmentation algorithm. Then the type of the disease is identified using Multi SVM classifier. They observed 93% accuracy in finding the defected one but Local binary pattern algorithm was slow for classification.
V.Leeman at al.,[3] acquired images of 725 bicoloured jonagold apples using a lighting tunnel, a three CCD colour camera , a frame grabber and a PC with resolution of 3.6 pix/mm2 . All the apples were categorized as two different types of samples. They have extracted the features using frequency distribution and probability theorems. The segmentation process based on non-parametric color models of the healthy tissue did not have enough accuracy. The authors, considered the segmentation of the defects as a classification process of each pixel into ‘healthy’ or ‘defect’ class based on the pixel’s colours. Baye’s theorem gave the
probability for a pixel that belonged to the healthy tissue based on co lour.The independent parameters were estimated as : P(x/healthy) , P(healthy) and P(x/defect). Whereas 69% healthy fruits have less than 5% of surface defect and 88% for less than 10% defect of accuracy was obtained by the authors in their proposed method.
V.Leemans et al., [4] used a prototype grading machine covering the whole surface of the 100 apples for acquiring its images. Then they extracted features like colour (mean value) , shape ( 4th root area) , texture ( standard deviation) position(Cartesian co-ordinates) and were sent as input parameters to the classifier. They used K-mean clustering method for each fruit and for each of these clusters, the sum of the posteriori classification probabilities and standard deviation were computed giving a static table comprising 2 x nc parameters to characterize the fruit. Finally the fruits
were graded in-line using the parameters of the discriminant analysis. 73% accuracy was observed this case
D.Unay et al., [5] in their proposed method used 229 jonagold and golden delicious apple image samples. The preprocessing technique used was low pass filtering and band pass filtering.Features like color, texture were extracted by the authors using Fourier, wavelet and cosine transformation. Segmentation of apple images into the determined class was done manually by an image processing software. The features were normalized before it was sent as input to neural network system. First co-variance matrix of the feature set was calculated and then the matrix of the eigen vectors of this covariance matrix was multiplied with the feature set producing transformed feature set whose components are uncorrelated and ordered according to the magnitude of the variance. Then they classified the segmented images using different test. Three-class SLP test , three-class MLP test and Three-class homogeneous sampling test. All the three tests were compared. The neural network in this study is composed of perception neurons with an adaptive supervised learning back-propagation algorithm.Finally 89.9% overall accuracy and 83.7% accuracy in finding defected apples was observed.
K Sindhi, et al.,[6] in their survey paper compared the various apple fruit quality evaluation methods proposed by various other authors.Comparision was done under the headings type of input images , no. of apple samples , pre processing techniques used , feature extraction, classifier used and finally the results. S R Dubey et al., [7] in their paper they have used K-Means clustering method for infected fruit part detection. Sarthak Panda [8] in his paper compared the performance of various segmentation techniques for color images. Also segmentation by k-means clustering and thresholding techniques were compared for their performance in segmentation of color images.
H Chen et al., [9] proposed the use of visible color difference in a new quantitative evaluation scheme for color image segmentation. According to visual perception segmented results were evaluated as under segmented and over segmented. V.Seenivasagam et al., [10] discussed about conventional segmentation algorithms and softcomputing approaches for segmentation. A suvey report was also presented.
PL.Chithra et al, International Journal of Advanced Research in Computer Science, 8 (8), Sept–Oct 2017,381-388
edge detector and a fast entropic thresholding technique. Also semantic human objects are generated by a seeded region aggregation procedure which takes the defected faces as object seeds. N Dhanachandra et al.,[16] in their proposed method applied partial stretching enhancement to the input image to improve the quality of the image. Subtractive clustering method was used to generate the initial centers and then these centers were used in k-means algorithm for segmentation of image.
Seema at al., [17] , used k-means clustering method is used for segmentation to extract region of interest from background. Color features are extracted from RGB image and HIS image. Then morphological features are calculated from RGB image. Later nearest neighbor classifier was used to classify. They got 100% accuracy. Devrim et al., [18] proposed an artificial neural network-based segmentation and apple grading by machine vision and they obtained 90% recognition. Malay K D et al., [19] proposed an image processing based method to assess fish quality and freshness. Wavelet domain coefficient was used for analysis of the acquired image. Also they used Haar filter for defining the freshness ranges.
III.PROPOSED METHODOLOGY AND DISCUSSION
3.1 K-MEANS CLUSTERING
Clustering method is a procedure in which a data set says pixels are exchanged by cluster. Pixels may belong together because of same color, texture etc., helping us in identifying the diseased part in any fruit.
In processing food images clustering is an efficient method. This method classifies pixels into different groups called clusters, in such a way that each pixels share some common trait. Clustering is done using some distance calculating measurement. The computational task of partitioning the pixel set into k subsets is often referred to unsupervised learning. It is a very fast procedure and also an attractive one. Clustering algorithm assumes that a vector space is formed from the pixel features and tries to identify clustering in them.
The objects are clustered around the centroids µi i = 1...k
which is computed by minimizing the following-objective
V = (xj- µi)2 (1)
In (1) k is the number of clusters i.e. Si , i = 1,2,3..k and µ is the mean point or centroid of all points xj si.
K-means algorithm is as follows : [7]
Step 1: Compute the distribution of the intensity of pixel values.
Step 2: Using k random intensities initialize the centroids. Step 3:Repeat the step 4 and step 5 until the labels of the cluster do not change any more.
Step 4: Cluster the image points based on the distance of their intensity values from the centroid intensity values
C(i) = arg minj 2
Step 5: Compute new centroid for each cluster
µi = (2)
In (2) k is the no. of clusters, i iterates over all the intensity values, j iterates over all centroids and µ represents the centroids.
3.2 L*a*b COLOR SPACE
When color histogram in different color were investigated it was observed that L*a*b provided better feature space for segmentation of color images. It was recommended by CIE in 1976 as a way of representing acquired color and their difference. L* is the lightness factor, a* and b* are the chromaticity co-ordinates.
L*(lightness) axis – 0 is black; 100 is white. L* = 116( )1/2 – 16
(3) a* (red-green) axis – positive values are red and negative values are green and 0 is neutral.
a* = 500 [ ( )1/2 – ( )1/2 ]
(4)
b* (yellow-blue) axis – positive values are yellow and negative values are green and 0 is neutral.
b* = 500 [ ( )1/2 – ( )1/2 ]
(5)
3.3 MEDIAN FILTER
Median measures the intensity level of pixel which separates the high intensity value pixels from lower intensity value pixels. It is also a type of order statistic filter. The most popular and useful of the rank filters is the median filter. It works by selecting the middle pixel value from the ordered set of values within the m x n neighborhood ‘W’ around the reference pixel. If mn is the even number, the arithmetic average of the two values closest to the middle of the ordered set is used instead. It is represented as
f(x, y) = median{g(r,c)|(r,c) W} (6) This filter simply sorts all values within a window, finds the median value and replaces the original pixel value with the median value
3.4 PROPOSED ALGORITHM
The main aim of this proposed method is to implement an algorithm which will enhance the segmented image, so that it will help in accurate classification of an apple which has some defect.
Step 1: Read an apple’s image
Step 2: Convert the given image from RGB color space to L*a*b color space.
Step 3: Apply and segregate the colors using K-means clustering method using Euclidean distance metric. Step 4: Label each pixel in the image using the results of K-means
Step 5: Generate images that segment the input image by color.
Step 6: Segmented Image is then filtered by applying median filter
Step 7: Enhanced image is then given as input to the classification procedure.
IV. EXPERIMENTAL RESULTS
PL.Chithra et al, International Journal of Advanced Research in Computer Science, 8 (8), Sept–Oct 2017,381-388
© 2015-19, IJARCS All Rights Reserved 384
error ( mse) and peak signal-to noise ratio (psnr) were calculated to measure the output image’s quality.
Mean value gives the contribution of individual pixel intensity for the entire image. Standard deviation is the most widely used measure to find the variability or diversity in statistics. In image processing terms, it shows how much variation or dispersion exists from the mean intensity value. A low standard deviation indicates that the data points tend to be very close to the mean, whereas high standard deviation indicates that the data points are spread out over a large range of values. Mathematically standard deviation is calculated as
f(x,y)= 2
(7)
MSE – Mean Square Error , is computed by averaging the squared intensity of the original input image and the output image pixels
MSE= 2 (8) In equation (8) e(m,n) is the error difference between the
original and the distorted image. PSNR is a mathematical measure of image quality calculated, based on the pixel difference between two images.
PSNR is calculated as
PSNR = 10 log , (9) In equation (9) , s= 255 for an 8 bit image. 6
4.1 Results obtained:
The following images are the output images obtained by applying both existing and proposed methods:
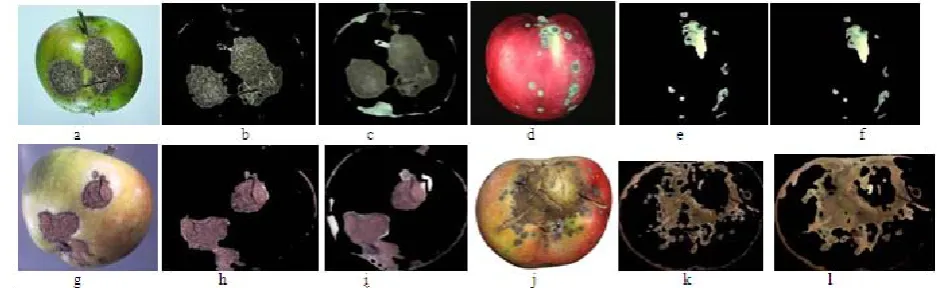
Fig. 4.1.1: a, d, g ,j: Apple images with cork spot disease and b, e, h, k : Existing method’s outputs and c, f, g, l : Outputs of the proposed method
[image:4.595.77.552.514.658.2]From observing Fig. 4.1.1 it is obvious that the proposed method’s images c, f, g ,l when compared to the existing method’s output b, e, h, k, the clarity of the segmented images are good. All the above images are apple images with cork spot disease.
Fig. 4.1.2: a, d, g, j : Apple images with scab disease and b, e, h, k: Existing method’s outputs and c, f, g, l, : Outputs of the proposed method
PL.Chithra et al, International Journal of Advanced Research in Computer Science, 8 (8), Sept–Oct 2017,381-388
[image:5.595.88.548.56.208.2]© 2015-19, IJARCS All Rights Reserved 385
Fig. 4.1.3: a, d, g, j: Apple with cork spot disease and b, e, h, k : Existing method’s outputs and c, f, g, l : Outputs of the proposed method
Even in the above fig.4.1.3. , images of apples with rot disease a, d, g, j were taken as samples, and the proposed method was applied. Outputs that were obtained give us a clear picture of the defected area.
4.2 Statistical measures
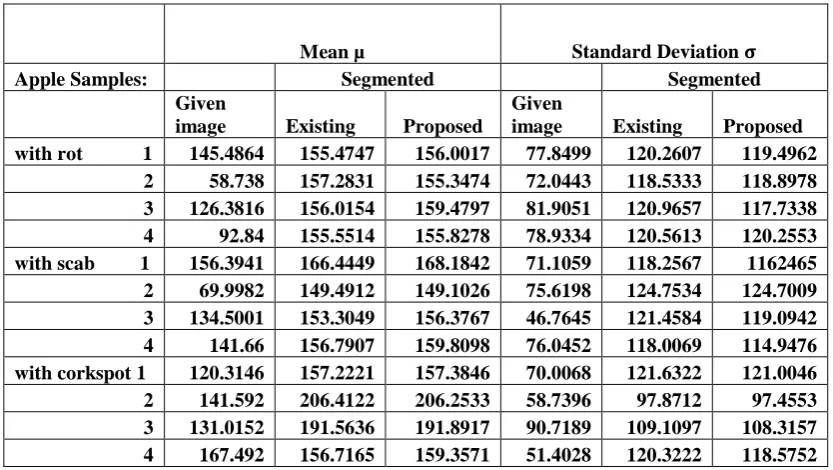
Table 4.2.1 : Mean and Standard deviation values for the given images, segmented images using existing method and proposed method
Mean µ Standard Deviation
Apple Samples: Segmented Segmented
Given
image Existing Proposed
Given
image Existing Proposed
with rot 1 145.4864 155.4747 156.0017 77.8499 120.2607 119.4962
2 58.738 157.2831 155.3474 72.0443 118.5333 118.8978
3 126.3816 156.0154 159.4797 81.9051 120.9657 117.7338
4 92.84 155.5514 155.8278 78.9334 120.5613 120.2553
with scab 1 156.3941 166.4449 168.1842 71.1059 118.2567 1162465
2 69.9982 149.4912 149.1026 75.6198 124.7534 124.7009
3 134.5001 153.3049 156.3767 46.7645 121.4584 119.0942
4 141.66 156.7907 159.8098 76.0452 118.0069 114.9476
with corkspot 1 120.3146 157.2221 157.3846 70.0068 121.6322 121.0046
2 141.592 206.4122 206.2533 58.7396 97.8712 97.4553
3 131.0152 191.5636 191.8917 90.7189 109.1097 108.3157
4 167.492 156.7165 159.3571 51.4028 120.3222 118.5752
[image:5.595.108.525.340.575.2]PL.Chithra et al, International Journal of Advanced Research in Computer Science, 8 (8), Sept–Oct 2017,381-388
[image:6.595.64.525.73.294.2]© 2015-19, IJARCS All Rights Reserved 386
Table 4.2.2 : MSE and PSNR values of segmented images obtained as output using existing and proposed method
mean square error(MSE) PSNR
Apple samples Exiting Proposed Existing Proposed
with rot 1 1.87E+04 1.84E+04 5.4234 5.4883
2 2.90E+04 2.90E+04 3.5023 3.5139
3 1.93E+04 1.86E+04 5.2652 5.4453
4 3.05E+04 3.01E+04 3.3093 3.3416
with scab 1 1.41E+04 1.35E+04 6.6478 6.8278
2 3.24E+04 3.22E+04 3.0295 3.0533
3 1.80E+04 1.73E+04 5.5798 5.7477
4 1.53E+04 1.36E+04 6.2981 6.7979
with corkspot 1 2.49E+04 2.46E+04 4.1622 4.2178
2 1.15E+04 1.16E+04 7.529 7.4998
3 3.05E+04 3.07E+04 3.2911 3.2661
4 2.34E+04 2.20E+04 4.438 4.6908
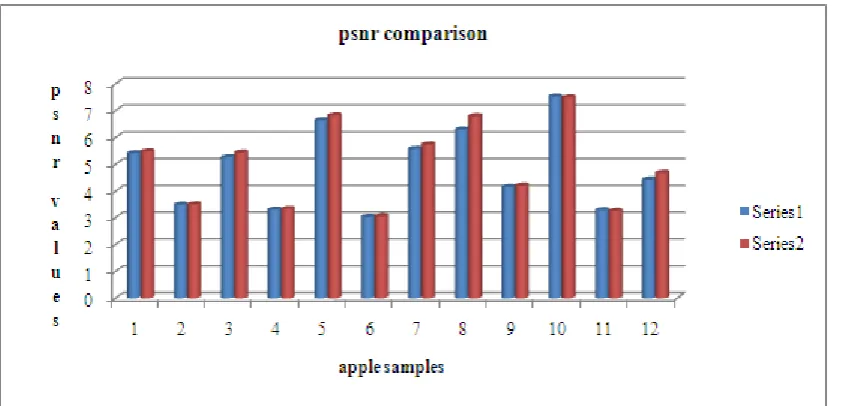
[image:6.595.89.513.340.543.2]The error measures like MSE and PSNR help in analyzing the quality of segmented image. The following bar charts depict the difference in MSE values and PSNR values between the existing method and proposed method.
Fig. 4.2.1: PSNR values of all 12 samples with respect to both the algorithms. Series 1: PSNR values of images of existing method Series 2: PSNR values of images of proposed method
PL.Chithra et al, International Journal of Advanced Research in Computer Science, 8 (8), Sept–Oct 2017,381-388
Fig. 4.2.2: MSE values of all 12 samples with respect to both the algorithms. Series 1: MSE values of images of existing method
Series 2: MSE values of images of proposed method
Apple samples1,3,4,5,7,8,12 showed lesser MSE values when compared to apple samples 2,6,9,11. This too is because of input samples clarity. If series one and two bar heights are observed in the above figure , series two bars are comparatively taller than series 1 which implies that MSE values of the proposed method is Lesser than the existing method. If the MSE value is less, then the quality of the output image is high. This in turn also implies that the proposed method is better than the existing one.
Even visually, when observed the proposed method produces an image with high intensity level with clearer segmented image which will increase the accuracy rate of the classification process. Average Accuracy of the proposed method is more when compared to the existing method and it is calculated as
Average accuracy = [ CSI / N ] x 100
Where CSI is the total number of correctly segmented images and N is the total number of images used.Average accuracy of the proposed method is 91.67%
V. CONCLUSION
Experimental results on the apple’s data set indicate that the proposed method is better than the existing one. Also segmented images quality is based on the input images clarity. In future primary images can be acquired and analyzed. Also by properly selecting and implementing other segmentation methods along with other filtering methods the quality of the output can be further improved, so that it will help in accurate classification process.
REFERENCES
[1] G Moradi , M Shamsi , M H.Sedaagh , S Moradi , “Using
Statistical Histogram Based EM Algorithm For Apple Defect Detection” American Journal of signal processing 2012,2(2) : 10-14, DOI:10.5923/j-ajsp.202120202.02.
[2] R.Sivamoorthi , .N.Sujatha, “A Novel Approach Of Detection and Classification of Apple Fruit Based on Complete Local Binary Patterns”, International Journal of Advanced Research in Computer Science and Software Engineering, volume 5, Issue 4, April 2015.
[3] V.Leemans , H.Magein ,M.-F. Destian, “Defect Segmentation on ‘Jonagold’ apples using Colour Vision And A Bayesian Classification Method”. ELSEVIER computer and Electronics in Agriculture 23(1990) 43-53.
[4] V.Leemans , M.-F.Destian,” A real-time Grading method of Apples Based On Features Extracted from Defects” ELSEVIER , Journal of Food Engineering 61 (2004) 83-89 [5] D Unay , B Gosselin, “Apple Defect Detection and Quality
Classification with MLP-Neural Networks, Proceedings of the PRORISC workshop circuits 2002- citeseer.
[6] K Sindhi , J Pandya , S Vegad ,”Quality evaluation of Apple Fruit : A Survey” International journal of computer Applications (0975-8887), Volume 136 – No.1., Feb.2016. [7] S R Dubey , P Dixit , N Singh , J P Gupta, “Infected Fruit Part
Detection Using K-means Clustering Segmentation Technique” , Internationl journal of Artificial Intelligence and interactive Multimedia , Volulme 2. No.2
[8] S Panda “ Color Image Segmentation Using K-means Clustering and Thresholding Technique”, Interntional journal of ESC , March 2015 issue.
[9] H C Chen, S Wang, “ The Use Of Visible Color Difference In The Quantitative Evaluation of Color Image Segmentation”, ICASSP 2004 , IEEE
[10] V.Seenivasagam , S.Arumugadevi, “ A survey of Color Image Segmentation Methods Using Conventional and Soft Computing Techniques”, ICCCIT 2012
[11] J Fan ,D K.Y.Yau, “Automatic Image Segmentation by Integrating Color-Edge Extraction and Seeded Region Growing”, 2001 IEEE
[12] S R Dubey, A S Jalal, “Fruit and Vegetable Recognition By Fusing Colour and Texture Features of the Image Using Machine Learning”, Int.J. Applied Pattern Recognition , Vol 2, No. 2, 2005.
[13] N Dhanachandra and Y J Chanu, “Image Segmentation Method Using K-Means Clustering Algorithm for Color Image”, Advanced Research in Electrical and Electronic Engineering, Vol. 2, 2015.
[14] Yusra A.Y. AI-Najjar, D C Soong, “Comparison of Image Quality Assessment: PSNR, HVS , SSIM , UIQI”, International Journal of Scientific & Engineering Research, Vol.3 , 2012.
[15] V Kumar , P Gupta, “ Importance of Statistical Measures in Digital Image Processing”, International Journal of Emerging Technology and Advanced Engineering, Vol. 2 , 2012 [16] Nameirakpam D, K.Mangelem, Y J Chanu , “ Image
Segmentation Using K-Means Clustering Algorithm and Subtractive Clustering Algorithm” , IMCIP-2015, 764 – 771. [17] Seema , A.Kumar, G.S.Gill , “ Computer Vision Based Model
PL.Chithra et al, International Journal of Advanced Research in Computer Science, 8 (8), Sept–Oct 2017,381-388
© 2015-19, IJARCS All Rights Reserved 388
[18] Suganya , Menaka, “ Various segmentation Techniques in Image Processing: A Survey”, IJIRCCE, Vol.2 , Spl. Issue 1 , March 2014,1048 – 1052.
[19] D Unay,B Gosselin, “Artificial Neural Network-based Segmentation and Apple Grading by Machine Vision”,Funded Research paper.
![Fig. 4.2.2: MSE values of all 12 samples with respect to both the algorithms. Series 1: MSE values of images of existing method Series 2: MSE values of images of proposed method [3] V.Leemans , H.Magein ,M.-F](https://thumb-us.123doks.com/thumbv2/123dok_us/682340.1075576/7.595.69.532.56.239/samples-respect-algorithms-series-existing-series-proposed-leemans.webp)
