Article
Optimize Siteation the Tower Crane Using a
Mathematical Models
Peyman Beiranvand 1,*, Hamid Reza Ashrafi 1, Fereydoon Omidinasab 2 and Amir Alipour 3 1 Deparment of Civil Engineering, Razi University kermanshah, Kermanshah, Iran; [email protected] 2 Department of Civil Engineering, Lorestan University, Khorram abad, Iran; [email protected] 3 Department of Civil Engineering, Islamic Azad University of Bushehr, Bushehr, Iran
* Correspondence: [email protected]; Tel.: +98-937-865-1620
Abstract: Due to a simple crane limited capacity; there is an urgent need to use high capacity cranes such as tower cranes. However, with regard to their high expense, we have to take into consideration selecting what type of cranes to be utilized which has been discussed by many researchers. In this research, a proposed technique was created to select the suitable type of crane and best place for crane erection, in addition to minimum radius for requested crane in order to minimize cost. To fulfill that target, a computer program is designed to numerate these problems, demonstrating an example explaining how to apply program and the result donated best place.
Keywords: tower crane; location; operating time; feasible area
1. Introduction
Some researchers have dealt with problem estimating crane place which implementing minimum time for crane movements and accordingly minimizing expenses.
Warszawski [1] established a time distance formula by which quantitative evaluation of location was possible. Furussaka and Grouy [2] presented a dynamic programming model with the objective function being hire cost, but without consideration of location. Gray and Little [3] optimized crane location in irregular-shaped building while Wijesundera and Harris [4] designed a simulation model to reconstruct operation times and equipment cycles when handling concrete. Farrel and Hover [5] developed a database with a graphical interface to assist crane selection and location. Choi and Harris [6] introduced another model to optimize single tower crane location by calculating total transportation times incurred.
In this research, we shall study finding minimum crane radius or getting feasible area, which we shall use to select the best location to erect crane, such location should fulfill minimum total time for all crane movements. This research will represent a numerical solved example to determine proceeding crane radius, feasible area, and optimum location to erect crane.
2. Model description
2.1. Assumptions
(a) Geometric layout of all supply and demand, D, locations, together with the type is predetermined.
(b) For each S-D pair, demand levels for transportation are known, e.g., total number of Lifts maximum load, unloading delay, and so on.
(c) The duration of construction is broadly similar over the working area.
(d) Radius of crane is similar over the tasks.
(e) The area of each supplied location is large enough to accommodate the storage requirements.
2.2. Methodology
The suitable type of tower crane is the one which join all demand and supply location (preparation workshop, storing space, maintenance workshop, fuel station and left over space). This is done by drawing the coverage area of crane jib.
In case that site of work became too large, storing materials and equipment may be sited outside load circles in time that not needed. When such materials and equipment needed for utilize it shall move inside the coverage area (carne transportation circles).
3. Analysis
3.1. Hook travel for performing task
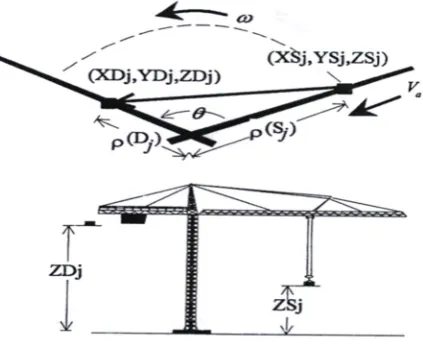
If (XSj, YSj, ZSj), (XDj, YDj, ZDj) refer respectively, to the location of supply and demand task, for
a crane located at (X, Y), the duration of hook travel, T, can be determined from the following equation.
(1)
h v h v
T = Max (T , T ) +
β
* Min (T , T )
The duration of hook transportation time, Tr, is calculated from the next equation.
(2)
Tr= T (Dj`, Sj) – T (Sj, Dj) + Nj* [L (Sj) + T (Sj, Dj) + U (Dj) + T (Dj, Sj)]
Where T (Dj`, Sj) is the travel time of unloaded hook from demand location, D, of task j`
(produced by last request) to supply location, S, of the current request j.
T (Sj, Dj) is the hook travel time with loads form supply location, Sj, to demand location, Dj,
T (Dj, Sj) is the hook travel time without loads from Dj to Sj,
L (Sj) is the hook delay time for loading at supply location Sj, and
U (Dj) is the hook delay time for unloading at Dj.
(3)
j
Q * R
N
C
=
Nj is the number of lifting loads of crane which is to be calculated,
Q is the total quantity of material transport between supply and demand locations,
C is the load capacity of tower crane.
Repetition is considered an essential factor in defining total time of lifting through this relationship. In addition, total cost, TC, can be calculated by the following formula.
(4)
J
TC
=
å
TR.C
Where, CJ cost of material flow from supply location SJ to demand location DJ per unit quantity
at each unit time.
The required duration (time) for hook vertical and horizontal travel can be calculated by the following equations accordingly.
(5)
i j
v
v
Z
Z
T
V
-=
(6)
h a w a w
T = Max (T , T ) + * Min (T , T )
a
Ta is the required duration for trolley radial movement. Tw is the required duration for trolley
tangent movement, being calculated from fig. 1.
Figure 1. Hook travel time.
(7-a)
( )
D
J(
XD
JX
) (
2YD
JY
)
2r
=
-
+
(7-b)
( )
S
J(
XS
JX
) (
2YS
JY
)
2r
=
-
+
(8)
(
) (
2)
2J J J J J
L
=
XD
-
XS
+
YD
-
YS
3.2. Time for trolley radial movement
(9)
( ) ( )
J Ja
a
D
S
T
V
r
- r
=
(10)( )
( )
( ) ( )
2 2 2J J J
J J
L
S
D
1
T
Arc Cos
2 S
D
w
æ
- r
- r
ö
ç
÷
=
ç
÷
ç
÷
w
è
r
r
ø
Where Vais the radial velocity of trolley (m/min), ω is the slewing velocity of jib (r/min), and Vv
is the hoist velocity of hook (m/ min).
Here, α and β are two parameters between zero to one. α represents, the degree of coordination of hook movement in radial and tangential directions in the horizontal plan and β reflects those in the vertical and horizontal planes. There are two extreme situations for α. Simulations movement occurs when α= 0 and consecutive when α= 1, depending on the skill of the operator and the spaciousness of the site. For β there are also two extreme situations: (a) simultaneous movement in two planes when β = 0 (b) consecutive movements when β = 1.
The value of β depends on the height of the working floor (the higher the floor the greater is β) ideally the value of both parameters need to be calibrated by observed date obtained from real construction sites. Kogane 1976 mentioned that an experienced driver performs simultaneous operations during 76% of the total duration of the cycle, thus here the value of parameter α is assumed as 0.25 unless otherwise stated, and β is assumed as 1.0, i.e., the hook moves consecutively in two planes.
3.3. Selection of minimum radius
In this model, the beginning of design location of demand and supply is known then select any small radius and determine the intersection between demand and supply, calculate the length between all circles which represent the supply and the demand locations by eq. (11).
(11)
(
)
22
s d s d
L
=
(X
-
X )
+
Y Y
Where:
L is the distance between all demand and supply locations,
Xs, Ys are the coordinates of supply locations, and
Xdand Yd are the coordinates of demand locations.
The minimum length of crane jib should be equal to the maximum distance between all demand and supply locations.
Where:
Rmin is the minimum radius of crane, and
Lmax is the maximum distance between demand and supply locations.
Repeat this process for single time or several times till it gets the desired intersection which will be minimum radius between circles. For that reason a computer program is formalized. By means of radius type, capacity and specification, the capability of crane requested can be selected. The steps of proposed algorithm will be summarized in the following steps.
(a) Coordinate of supply and demand locations are given.
(b) Calculate the length between all circles which represent the supply and the demand locations.
(c) Select maximum length from previous step.
(d) Minimum radius= (maximum length/2)+ 0.50 m.
3.4. Feasible area
Crane lift capacity is determined from load-radius diagram in previous chapter where the greater the load, the smaller the crane is operating radius assuming a load at supply (S) with the weight, its corresponding crane radius is R. A crane is therefore unable to lift a load unless it is located with a circle with the radius R. To deliver a load from (S) to demand location (D), the crane has to be positioned within an elliptical area enclosed by two circles, shown in fig. 2. The size of the area is related to the distance between Si and Dj. The large the weight of the load and the crane capacity of larger feasible area, the more easily the task can be handled.
Due to the intersection of demand and supply circles, it could determine locations of intersections by solving the equation of two circles:
(13)
(X-Xs1)2+ (Y-Ys1)2=R2
(14)
(X-Xd2)2+ (Y-Yd2)2=R2
Feasible Area R
1.00m
Si Dj
Figure 2. Specified feasible area to locate the crane.
Where:
Xs1, Ys1 is the coordinate of supply location, and
To determine locations of intersections, then find locations not exceeding radius of crane (R) from all the previous circles.
(15)
(
)
22
2 1 2 1
D
=
(X
-
X )
+
Y Y
Where:
D is the distance between all the previous locations and supply locations, demand locations, and
1 1
(X , Y )
and
(
X , Y
2 2)
are the coordinates of two location on a line in feasible area. It is note that vertical distance between demand and supply locations.As shown in fig. 3, the feasible area of crane is determined by group of lines which connected by this mouthed the area between arc and lines in consider out of feasible area this assumption will be evaluate lately.
(16)
(
)
(
)
(
(
)
)
2 1 1
2 1 1
Y
Y
Y Y
X
X
X X
-
-=
-
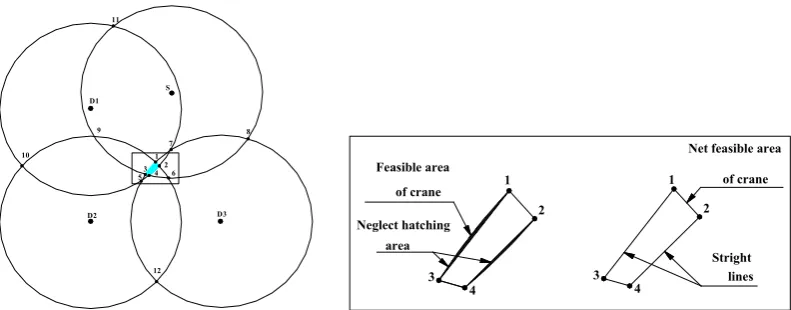
Fig. 4 shows available crane locations inside the feasible area which is determined by straight lines, it should be noted that Xmax, Xmin, Ymax, Ymin are determined. From pervious step the net feasible area (which constrained by Xmax, Xmin, Ymax and Ymin) are divided by square mesh in the two direction. Select any location from mesh and calculate total transportation time by using equations from eq. (1 to 10). Fig. 1 shows the radial, the tangent and the vertical movement respectively, being calculated from pervious equations. This procedure shall be done for all locations till it define minimum time needed, so it get the corresponding X,Y of minimum time and implemented computer program which gives us good results fig. 3-6 shows steps selection optimum location of tower crane .
6 4 5
D2
12 D3 3
10
9 D1
2 1
7
8 S
11
3
4 3 4
Feasible area of crane
Neglect hatching area
2 1
Stright lines Net feasible area
1 of crane
2
Grid lines Net feasible area Points of crane location
Xmin
Ymax
Ymin
Xmax
Figure 4. Available crane locations.
4. Illustrative example
4.1. Input data of illustrative example
The main focus of this example is to illustrate the feature of the proposed model. The main material to be handled by tower crane is fresh concrete. Therefore, it is clear from above that location of tower crane is our essence of this research, assuming that all supply materials are (S). So coordinate location (S) and coordinates locations of demands D1, D2, D3 are determined in the drawing of site layout. In addition, quantities needed for building to be handled by tower crane per stages shall be determined from each location of supply to demands locations. Fig. 5 shows the layout of site. Tables 1 and 2 show coordinates of demands and supply locations respectively, and table 3 shows repeat lifting of material transported between every S-D pair.
50
10 D 2
40
0.0 10 20 30
0.0 30
20
B uilding 40
D 3
70 60
X (m ) 80
D 1
50 60
Y ard
70 S
Y (m )
90
Figure 5. Layout of site.
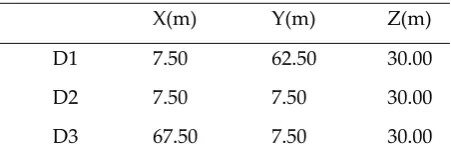
Table 1. Coordinate of demand locations
X(m) Y(m) Z(m)
D1 7.50 62.50 30.00
D2 7.50 7.50 30.00
Table 2. Coordinate of supply locations
Supply D1 D2 D3
S 45.00 70.00 0.0
Table 3. Repeat lifting of material for pair S-D
Supply D1 D2 D3
S 1000 800 1200
5. Output data
5.1. Selection of minimum radius
Based on the coordinate of supply and demand locations, the distant between each supply-demand can be determined. The largest distance of the obtained distance is selected (81.40m). Finally, the minimum radius equal the half of this selected distance plus a selected margin (for example 0.50 m, give a minimum intersection distance equal 1.0m). Table 4 shows calculation distance between all supply and demand locations, minimum radius using eq. (12) equal (42.00m).
5.2. Feasible area
For this example, feasible area can be determined as follow:
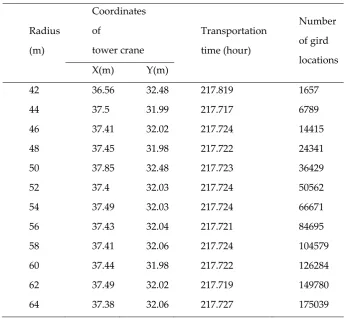
The result of rounds of modeling with different radius, corresponding minimum time, coordinates location of crane, time of program and number gird inside the feasible area are shown in table 6.
Table 4. Distance between supply and demand locations
Distance
Length (m)
Eq. (11)
D1-S 38.24
D2-S 72.89
D3-S 66.43
D1-D2 55.00
D1-D3 81.40
D2-D3 60.00
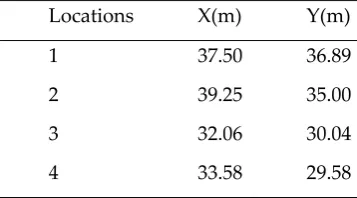
Table 5. Boundary locations the feasible area for radius = 42m
Locations X(m) Y(m)
1 37.50 36.89
2 39.25 35.00
3 32.06 30.04
Table 6. Output data of illustrative example
Radius
(m)
Coordinates
of
tower crane
Transportation
time (hour)
Number
of gird
locations X(m) Y(m)
42 36.56 32.48 217.819 1657
44 37.5 31.99 217.717 6789
46 37.41 32.02 217.724 14415
48 37.45 31.98 217.722 24341
50 37.85 32.48 217.723 36429
52 37.4 32.03 217.724 50562
54 37.49 32.03 217.724 66671
56 37.43 32.04 217.721 84695
58 37.41 32.06 217.724 104579
60 37.44 31.98 217.722 126284
62 37.49 32.02 217.719 149780
64 37.38 32.06 217.727 175039
Fig. 7 shows that the relation between the minimum time and the radius. It is shown that increasing the radius from 42 to 64 m gets decreasing in time values 217.727 to 217.819 hours. It can be selected from this figure the first minimum working radius value and corresponding time. The selected radiuses realize the optimum crane location.
6. Conclusions
Main objective of this study performed on tower crane is reducing cost through reducing time necessary for transport operation or reducing capacity of winch or balancing between both. These changes may be according to conditions of site.
Figure 7. Relation between transportation time and crane of radius.
This research is deal with a way for finding minimum radius and hence less capacity. Selection of tower crane according to:
217.68 217.72 217.76 217.80 217.84
40.00 44.00 48.00 52.00 56.00 60.00 64.00
Crane Radius(m)
M
in
T
ran
sp
ro
ta
ti
on
T
im
e
(h
ou
rs
Selection of minimum time built on a definite radius.
Selection of minimum radius without considering transport time.
Program yielded accurate results. This is clear from curve resulting from selection of two previous factors.
References
1. A. Warszawski, “Analysis of Transportation Methods in Construction”, Journal of the Construction Division, ASCA, Vol. 99 (CO1), July, pp.191-202 (1973).
2. S. Furusaka and C. Gray, “A Systematic Approach to the Selection of an Appropriate Crane for a Construction Sites”, Constr. Mgmt. and Economics, Vol. 3, pp. 121-144 (2009).C.M. Tam, K. LTong 3. Thomas and K.W. Chan. Wilson "Genetic Algorithm for Optimizing Supply Location Around Tower
Crane", J. Constr. Engrg. And Mgmt., ASCE, Vol. 127 (4), pp. 315-321 (2008).
4. D.A. Wijesundera and F.C. Harris, “Computer Simulation for Materials Handling in High Rise Construction”, Proc., Int. AMSE Conf. on Modeling and Simulation, Sorrento, Italy, Vol. 4 (4), pp. 81-95 (2010).
5. W. Farrell and K.C. Hover, "Computerized crane selection and placement for the construction site", Proc.,4th Int.Conf.on civil and struct. Engrg. Computing, civil –COMP Press, Edinburgh, U.K. (2013). 6. C.W. Choi and F.C. Harris, "A model for determining optimum crane position", Proc., Instn. Of Civ.
Engrs., Institution of Civil Engineers, London. Part (1) (90), pp. 627-634 (2014).