GRAPHICAL FRAMEWORKS FOR FACILITATING THE
STUDY OF CHROMATOGRAPHIC SEPARATIONS
A thesis submitted to the University of London
for the degree of
D O C TO R OF PH ILO S O P H Y
by
Sheau Huey Ngiam
May 2002
The A d v a n ced C entre for B iochem ical Engineering D epartm ent of B iochem ical E ngineering
University C o lleg e London Torrington P la ce
London, W C 1E 7JE United Kingdom
//Aw
ProQ uest Number: 1001 5 0 2 8
All rights reserved
INFORMATION TO ALL U SE R S
The quality of this reproduction is d ep en d en t upon the quality of the copy subm itted. In the unlikely even t that the author did not sen d a com plete manuscript
and there are m issing p a g e s, th e se will be noted. Also, if material had to be rem oved, a note will indicate the deletion.
uest.
ProQ uest 10015028
Published by ProQ uest LLC(2016). Copyright of the Dissertation is held by the Author. All rights reserved.
This work is protected against unauthorized copying under Title 17, United S ta tes C ode. Microform Edition © ProQ uest LLC.
ProQ uest LLC
789 East E isenhow er Parkway P.O. Box 1346
ABSTRACT
Chromatographic separations are employed for their excellent resolving power in order to achieve the purity required for today's bio-therapeutics, diagnostics, and other biological products. However, existing methods for the prediction of chromatographic sequence performance are limited and time-consuming given the highly interactive nature of such steps. This PhD study proposes a graphical framework for the rapid representation of key process trade-offs that need to be made during chromatographic separation. The output of the framework developed in this thesis reflects the degree of trade-off between levels of yield and purity and between levels of yield and the degree of contamination achieved and provides a fast and precise prediction on the sample fraction collection strategy needed to meet a desired process specification. The graphical methodology is able to accommodate difficulties posed by situations where the product and impurity content are measured by different assay techniques and are expressed in different units. Importantly by the use of cubic-spline methods, situations where the quality of process information is limited by the small number of fractions collected can be dealt with.
The thesis details the development of the theoretical basis behind fractionation, purification factor- yield and contamination index-yield diagrams and the mathematical algorithms used to connect chromatographic data with these diagrams. To demonstrate the practicality and usefulness of the approach proposed a range of chromatographic separation data were employed as case studies as follows. For a single step chromatographic operation, the approach is demonstrated by four different separation systems: simulation results from a verified size exclusion model separating three globular proteins (i.e. y-globulin, ovalbumin and Ribonuclease A); experimental results from the separation of a labile enzyme alcohol dehydrogenase (ADH) from Bakers yeast homogenate on a hydrophobic interaction STREAMLINE™ Phenyl matrix operated in an expanded bed; industrial data for the removal of endotoxin from DNA by ion exchange chromatography, and industrial data for the purification of recombinant protein from host cell protein contaminants by size exclusion chromatography. The approach is further demonstrated by another simulated separation operation involving chromatographic sequences: the separation of a hypothetical three- component protein system by hydrophobic interaction and size exclusion chromatography.
ACKNOWLEDGEMENTS
I am heartily grateful to my supervisor Professor Nigel Titchener-Hooker for his patience and valuable guidance throughout the whole PhD study. His constant
cheerfulness, optimism, enthusiasm and faith in me played a very important role in making me persevere. I would also like to thank my second supervisor Dr. Yuhong Zhou for her supervision and caring support - most importantly for giving me an opportunity to deliver lectures for four memorable months. The students definitely gave me so much inspiration, confidence and fun that I needed for the preparation o f this thesis.
Guidance from Professor Mike Turner in the early stage o f this PhD study is gratefully acknowledged. Special thanks to Richard Francis from GlaxoSmithKline, Dr. Julian Bonnerjea and Alex Cheriton from Lonza Biologies for the provision o f industrial data, and help in preparation o f the case studies and manuscripts. Provision o f Chromulator version 2.0, free o f charge, and valuable advice offered by Professor Tingyue Gu from University o f Ohio is also greatly acknowledged.
Help and friendship offered by Suzy, Srini, Edwin, Ed, Soon, Samson, May, Frances, Hooi Khim, Andy Booth and other colleagues in room 115/116 are much appreciated. I am especially indebted to Suzy for constantly being my guardian angel.
W ithout the financial support from the department, ORS Awards, and Leon Trust o f University o f London, this PhD study would not be possible.
I wholeheartedly thank all my good friends who are now at different comers o f the world (especially Yee Ling, Hui See, Yee Wei, Thye, Siew Wai, Deisy and Swee Ting!) for their genuine friendship and listening ears.
I would like to express my immense gratitude to my family for their constant encouragement, support, inspiration and love. Last but not least, I want to thank my
CONTENTS
ABSTRACT
DEDICATION
ACKNOW LEDGEMENTS
TABLE OF CONTENTS
LIST OF TABLES 11
LIST OF FIGURES 14
ABBREVIATIONS 20
CHAPTER 1 INTRODUCTION
1.1 Background 21
1.2 Motivation of the Project 24
1.3 General Background of Chromatography 27
1.3.1 Historical Background 27
1.3.2 What is Chromatography? 28
1.3.3 Process Perspective of Chromatography 29
1.4 Elution Modes of Chromatography 31
1.4.1 Elution Chromatography 32
1.4.2 Frontal Chromatography 33
Contents
1 .5 Types o f Chromatography 35
1.5.1 Configuration of Chromatographic Bed 35
1.5.1.1 Packed Bed System 35
1.5.1.2 Expanded Bed System 36
1.5.2 Scale of Operation 36
1.5.3 Chromatographic Techniques 38
1.5.3.1 Ion-exchange Chromatography (lEC) 39
1.5.3.1.1 Basic Concepts 39
1.5.3.1.2 Applications 41
1.5.3.2 Hydrophobic Interaction Chromatography (EÜC) 42
1.5.3.2.1 Basic Concepts 42
1.5.3.2.2 Applications 43
1.5.3.3 Affinity Chromatography (AC) 44
1.5.3.3.1 Basic Concepts 44
1.5.3.3.2 Applications 45
1.5.3.4 Size-Exclusion Chromatography (SEC) 47
1.5.3.4.1 Basic Concepts 47
1.5.3.4.2 Applications 48
1.6 Chromatographic Sequences 49
1.7 Aims of Research 53
1.8 Contributions o f Thesis 54
1.9 Organisation o f Thesis 55
CHAPTER 2 THEORETICAL CONCEPTS AND M ODELLING OF
CHROMATOGRAPHY
2.1 Introduction 56
2.2 Theoretical Concepts 57
2.2.1 Retention Parameters 57
2.2.2 Characteristics of Chromatographic Peaks 60
2.2.3 Measures of Column Efficiency 61
2.2.4 Resolution 63
Contents
2.2.52 Langmiiir Isotherm 66
2.2.6 Band Broadening 68
2.2.7 Separation Performance Measure '^|1
2.3 M odelling of Chromatography 74
2.3.1 Overview 74
2.3.2 Mathematical Models of Chromatography 75
2.3.2.1 Equilibrium Model 75
2.3.2.2 Plate Models 75
2.3.2.3 Statistical models 77
2.3.2.4 Rate models 78
2.4 Concluding Remarks 81
CHAPTER 3 DEVELOPMENT OF FRACTIONATION DIAGRAM
APPROACH IN CHROMATOGRAPHY
3.1 Introduction 82
3.2 Fractionation Diagram Approach 83
3.2.1 Fractionation Diagram 83
3.2.2 Maximum Purification Factor against Yield Diagram 86
3.3 Development of the Fractionation Diagram Approach in
Chromatographic Separation 88
3.3.1 Fractionation Diagram 88
3.3.2 Purification Factor 90
3.3.3 Contamination Index 96
3.4 Concluding Remarks 98
CHAPTER 4 APPLICATION OF FD APPROACH TO SINGLE
SIMULATED CHROMATOGRAPHIC STEP
4.1 Introduction 99
4.2 Background of Size Exclusion Chromatography Model 100
Contents
4.2.2 Fast Fourier Transform (FFT) Numerical Technique 108
4.2.3 Extension of the Model and Simulation Details 110
4.3 Results and Discussion 114
4.4 Concluding Remarks 121
C H A PTER S APPLICATION OF FD APPROACH TO SINGLE
EXPERIMENTAL AND INDUSTRIAL
CHROMATOGRAPHIC STEP
5.1 Introduction 122
5.2 Hydrophobic Interaction Expanded Bed Chromatographic
Purification of a Labile Enzyme from Homogenate 123
5.2.1 Background 123
5.2.1.1 Materials and Methods 125
5.2.1.2 Experimental Data Treatment 126
5.2.2 Results and Discussion 128
5.3 Removal of Endotoxin from Plasmid DNA by Ion-exchange
Chromatography 134
5.3.1 Background 134
5.3.1.1 Materials and Methods 136
5.3.1.2 Experimental Data Treatment 137
5.3.2 Results and Discussion 137
5.4 Purification of Recombinant Protein by Size Exclusion
Chromatography 142
5.4.1 Background 142
5.4.1.1 Materials and Methods 144
5.4.1.2 Experimental Data Treatment 146
5.4.2 Results and Discussion 147
_______________________________________________________________________________ C ontents
CHAPTER 6 THE LINKAGE OF MODELS FOR SEQUENCE STUDY
6.1 Introduction 157
6.2 Background 158
6.2.1 The General Rate Model 159
6.2.2 The General Rate Model for Size Exclusion Chromatography 165
6.2.3 Numerical Techniques 167
6.2.4 Models in Chromulator Version 2.0 170
6.3 Parameter Estimation o f Hydrophobic Interaction Chromatography
Model 171
6.3.1 Simulation and Operating Conditions 174
6.3.2 Properties of Solutes 179
6.3.3 Tran sport Parameters 181
6.4 Parameter Estimation o f Size Exclusion Chromatography M odel 183
6.4.1 Simulation and Operating Conditions 184
6.4.2 Properties of Solutes 187
6.4.3 Transport Parameters 188
6.5 Concluding Remarks 190
CHAPTER 7 APPLICATION OF FRACTIONATION DIAGRAM
APPROACH TO THE ANALYSIS OF A SEQUENCE OF
CHROMATOGRAPHIC STEPS
7.1 Introduction 191
7.2 Simulation Details and Description of Linkage 192
7.3 Results and Discussion 198
7.3.1 Single Step Operation - HIC 198
7.3.2 Sequence Operation - HIC + SEC 211
7.3.2.1 Case Study I - Impact of Volumetric Flow Rate in HIC Step
on Sequence Performance 211
13.2.2 Case Study II - Impact of Sample Load of HIC Step on
Sequence Performance 219
________________________________________________________________________________Contents
Sequence Performance 227
7.3.3 Process Operating Decisions 233
7.4 Concluding Remarks 245
CHAPTER 8 OVERALL CONCLUSIONS AND RECOMM ENDATIONS
FOR FUTURE WORK
8.1 Overall Conclusions 246
8.2 Recommendations for Future Work 250
NOM ENCLATURE 253
BIBLIOGRAPHY 258
APPENDICES
A1 MATLAB Program Listings for Chapter 4 273
A2 Experimental Data for HIC and SEC in Chapter 5 279
A3 W orking Example for Chapter 5 282
A4 Publications Arise from This Work 285
A5 Step-by-step Application Recipe o f Fractionation Diagram
LIST OF TABLES
1.1 The estimated market value o f some biopharmaceuticals in 1997.
1.2 Chromatographically purified biochemical products destined for therapeutic administration.
1.3 The difference in scales o f chromatographic operations.
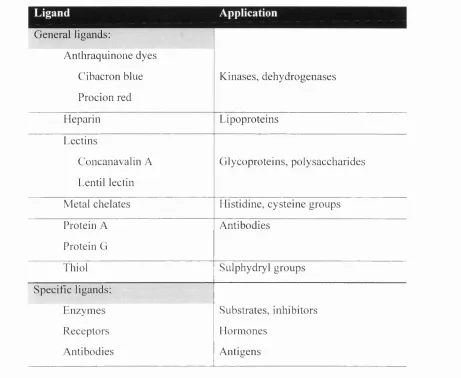
1.4 Common ligands for affinity chromatography and their applications.
4.1 Operating conditions and process parameters used in the simulation o f the linear size exclusion chromatography model.
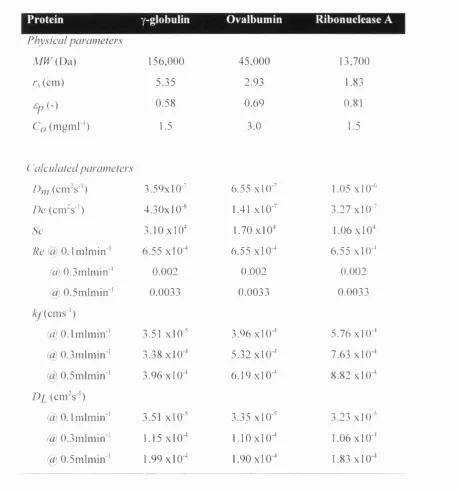
4.2 Values o f physical parameters and calculated transport parameters for the three globular type proteins used in the size exclusion chromatography simulations.
5.1 The calculated sample collection retention volumes (Vri and V r2)
corresponding to different values o f yield and maximum purification factor for the expanded bed system, at a sample loading o f one column volume.
5.2 The calculated sample collection points (Cut 1 and Cut 2) corresponding to different values o f product yield and contamination index achieved in an ion- exchange endotoxin clearance column. Data is for batch 3 fermentation product.
5.3 Chromatographic data o f gel permeation purification o f recombinant protein for Batch 1 material.
L is t o f Tables
6.1 Notation and definition o f all inputs required by Chromulator version 2.0 -
Rate Model for a simulation.
6.2 Notation and definition o f all inputs required by Chromulator version 2.0 - Kinetic Model for a simulation.
7.1 The combinations o f volumetric flow rate, sample volume and product yields o f
HIC step simulated in this chapter.
7.2 Simulation and operating parameters for HIC model defined for the Case Study (I) volumetric flow rate and (II) sample volume.
7.3 Physical properties and transport parameters used for Case Study 1 simulations in HIC model.
7.4 Physical properties and transport parameters used for simulations in HIC model
for Case Study II where the sample size was varied.
7.5 Simulation and operating parameters for SEC model for all runs.
7.6 Physical properties and transport parameters used for all simulations in SEC model.
7.7 Case Studies I and III - Values o f the maximum purification factor and sample collection times (t| and ti) which correspond to product yields o f 70%, 90% and 95%, at different buffer flow rates. Sample load = 10ml.
7.8 Case Studies II and III - Values o f the maximum purification factor and sample collection times (t, and ti) corresponding to product yields o f 70%, 90% and 95%, with different sample loads. Flow rate = 3mlmin"\
7.9 Case Studies I and III - Dimensionless sample loading time in SEC, for different volumetric flow rate o f HIC operation and for different product yield o f fraction collected from HIC column prior to SEC column.
7.10 Case Studies II and III - Dimensionless sample loading time in SEC, Timp, with different sample loads o f HIC operation and for different product yield o f the
fraction collected from HIC column.
L ist o f Tables
7.12 Case Studies II and III - Values o f initial concentrations (molL"') o f three components, Cq for different sample loads o f HIC operation and for different product yields o f fractions collected from HIC column prior to SEC.
7.13 Case Study I - Impact o f HIC flow rate on subsequent SEC operation. The sample collection times (C and C) corresponding to different values o f yield
and maximum purification factor for the SEC operation.
7.14 Case Study II - Impact o f HIC sample load on subsequent SEC operation. The sample collection times (C and t2) corresponding to different values o f yield
and maximum purification factor for the SEC operation.
7.15 Case Study III - Impact o f HIC yield on subsequent SEC operation. The sample collection times (tj and C) corresponding to different values o f yield and maximum purification factor for the SEC operation.
7.16 Case Studies I and III - Overall purity (%) corresponds to different
combinations o f HIC and SEC product yields.
7.17 Case Studies II and III - Overall purity (%) corresponds to different combinations o f HIC and SEC product yields.
7.18 Case Studies I and III - Overall throughput (ghr'') corresponds to different
combinations o f HIC and SEC product yields.
7.19 Case Studies II and III - Overall throughput (ghr'') corresponds to different
LIST OF FIGURES
1.1 Biotechnology medicines for therapeutic purposes in development.
1.2 The major three elements o f process trade-offs in chromatographic
separation.
1.3 Generalised outline for the production o f protein products destined for therapeutic or diagnostic application.
1.4 Elution profile o f a binary mixture by chromatography.
1.5 Solute concentration profile o f the column effluent in frontal development. 1.6 Solute concentration profile o f the column effluent in displacement
chromatography..
1.7 Schematic illustration o f a typical expanded bed adsorption cycle. (1) sedimentation o f adsorbent particles; (2) expansion o f bed; (3) loading o f sample and washing step; (4) elution in reversed flow.
1.8 Principle o f molecular recognition in affinity chromatography.
1.9 Schematic outline o f the purification process for human growth hormone.
1.10 Different purification techniques used at successive steps in biochemical downstream processing schemes.
2.1 Elution profile o f a typical two-component mixture by chromatography.
2.2 Characteristics and key dimensions o f a Gaussian peak.
2.3 The Langmuir isotherm.
2.4 Van Deemter plot, relating plate height H (or HETP) to mobile phase linear velocity u.
3.1 Enzyme and total protein solubility profiles in the presence o f increasing concentrations o f precipitant.
L is t o f Figures
3.3 Maximum purification factor-yield diagram comparing fractionation
efficiency under (a) varying pH and temperature conditions and; (b) initial
total protein concentrations.
3.4 Schematic illustration o f the procedure to generate the fractionation diagram and the corresponding maximum purification factor-yield diagram from a
elution chromatogram obtained either by experiment or simulation. 3.5 Illustration on one fraction in a chromatographic profile.
3.6 An illustration o f Trapezoidal Rule.
3.7 Theoretical plot o f purification factor against product yield.
3.8 Determination o f the suitable product collecting time (tj and t]) for a desired combination o f product yield and maximum purification factor.
3.9 Fractionation diagram for the system where product and impurity are
expressed in different units.
3.10 Theoretical plot o f contamination index against product yield.
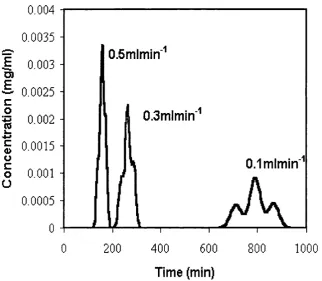
4.1 Simulated SEC chromatogram for elution o f a three component model
system as a function o f mobile phase flow rates.
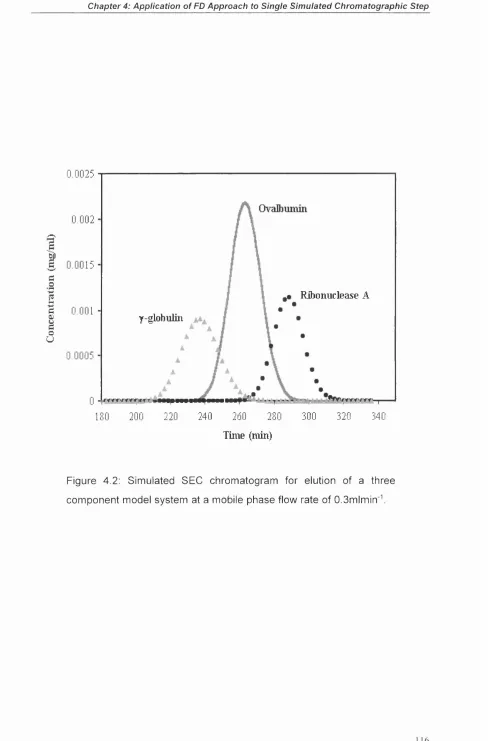
4.2 Simulated SEC chromatogram for elution o f a three component model
system at a mobile phase flow rate o f 0.3m lm in''.
4.3 Fractionation curves for the simulated gel filtration separation of ovalbumin from a mixture of Ribonuclease A and y-globulin as a function of flow rates. 4.4 Purification factor versus yield diagram corresponding to Figure 4.3 for the
simulated gel filtration separation of Ovalbumin from a mixture y-globulin and Ribonuclease A at different flow rates.
4.5 Van Deemter plot, relating plate height HETP to linear velocity u.
4.6 The calculated sample collection times corresponding to different values of
yield and maximum purification factor for the size exclusion
chromatography system, simulated at a buffer flow rate of 0.3 m lm in'\
5.1 Comparison o f different stages involved in expanded bed and packed bed processes.
L is t o f Figures
monitoring equipment.
5.3 Elution chromatogram for the expanded bed adsorption of 1 column volume
o f diluted homogenate onto a ST-50 expanded bed containing 250mL o f Streamline-Phenyl (low sub) matrix.
5.4 Comparison between original experimental data and fitted data by using cubic spline internal function in MATLAB for elution profiles obtained from
expanded bed operation o f 1 column volume o f diluted homogenate depicted in Figure 5.3.
5.5 Fractionation diagrams for the STREAMLINE expanded bed data, showing
the effect o f increasing sample load volumes.
5.6 Maximum Purification factor versus product yield for the STREAMLINE
expanded bed data given in Figure 5.3 showing the effect o f increased column sample load on the separation performance.
5.7 Schematic flowsheet for the production o f plasmid DNA product.
5.8 Fraction data for the amount o f (a) endotoxin and (b) plasmid DNA and collected from an ion exchange chromatographic separation o f endotoxin
from DNA product.
5.9 Modified fractionation diagrams for the endotoxin clearance column data, showing the effect o f different fermentation batches o f product where each had been harvested and then purified by the same purification process.
5.10 Minimum contamination index versus product yield for endotoxin clearance column data given in Figure 5.8 and 5.9 showing the effect o f different fermentation batches on the separation performance.
5.11 Elution profiles o f gel permeation chromatography for fermentation
materials o f (a) Batch 1; (b) Batch 2; and (c) Batch 3.
5.12 Elution profiles o f gel permeation chromatography for fermentation materials o f (a) Batch 4; and (b) Batch 5.
5.13 Fractionation curves for gel permeation separation o f recombinant protein from host cell proteins.
L is t o f Figures
5.15 Minimum contamination index versus product yield for gel permeation
chromatographic data given in Figure 5.12 and 5.14 showing the effect o f
different fermentation batches on the separation performance.
6.1 The concentration profiles o f solid and bulk-liquid phase in a packed bed
chromatography column.
6.2 Schematic diagram o f solution strategy for general rate model developed by Gu et al. (1993 and 1995).
6.3 Typical window o f simulation for Chromulator 2.0 - Rate Model.
6.4 Simulation time for base case in Chapter 7 required for different Ne values. 6.5 Chromatographic concentration profiles o f a single component in the base
case computed with different values o f No.
6.6 Simulation time for base case in Chapter 7 required for different Nc values.
6.7 Typical window o f simulation for Chromulator 2.0 - Rate Model.
6.8 Relationship between inclusion porosity (or accessible porosity) and
molecular weight for Sepharose 6B matrix
7.1 Simulated HIC chromatograms for elution o f three component model system
at a volumetric mobile phase flow rate o f (a) Imlmin'*; (b) 3mlmin“' and (c) 5m lm in''.
7.2 Simulated HIC chromatograms for elution o f three component model system with a sample load of (a) 8ml; (b) 10ml and (c) 12ml.
7.3 Effect o f the sample volume on the product band profiles in HIC separation 7.4 Dependency o f peak width at half height on sample volume for the product
band profiles in HIC separation. Flow rate = 3m lm in'\
7.5 Fractionation curves for the simulated hydrophobic interaction
chromatography as a function o f volumetric mobile phase flow rate
7.6 Fractionation curves for the simulated hydrophobic interaction
chromatography as a function o f sample volume
L is t o f Figures
different volumetric mobile phase flow rate.
7.8 Maximum purification factor versus product yield diagram corresponding to
Figure 7.7 for the simulated hydrophobic interaction chromatography with different sample loads.
7.9 Impact o f HIC yield on subsequent SEC chromatogram.
7.10 Impact o f HIC yield on subsequent SEC fractionation diagram.
7.11 The maximum purification factor versus yield diagram for SEC operation. Sample loads are collected at different product yields from HIC separation operated at a mobile phase flow rate o f 3mlmin'^ and sample volume o f 10ml.
7.12 The maximum purity achieved for a particular product yield in the SEC operation. Sample loads are collected at different product yields from HIC separation operated at a volumetric mobile phase flow rate o f 3mlmin’' and sample volume o f 10ml.
7.13 Impact o f HIC flow rate on subsequent SEC chromatogram.
7.14 Impact o f HIC flow rate on subsequent SEC fractionation diagram.
7.15 The maximum purification factor versus yield diagram for SEC operation. Sample loads were collected at product yield o f 90% from HIC separation operated at different volumetric mobile phase flow rates.
7.16 The maximum purity versus product yield diagram for SEC operation.
Sample loads were collected at product yield o f 90% from HIC separation operated at different volumetric mobile phase flow rates.
7.17 Impact o f HIC sample load on subsequent SEC chromatogram.
7.18 Product peaks as a function o f sample load onto HIC column.
7.19 Impact o f HIC sample load on subsequent SEC fractionation diagram.
7.20 The maximum purification factor versus yield diagram for SEC operation. Sample loads were collected at product yield o f 90% from HIC separation injected with different sample volume.
7.21 The maximum purity versus product yield diagram for SEC operation.
List o f Figures
7.22 The overall purity and produet yield achieved by the chromatographic sequence of HIC and SEC separations. HIC step was loaded at a constant sample volume of 10ml and,0t different epcratiiTg at flow rates.
7.23 The overall purity and product yield achieved by the chromatographic sequence of HIC and SEC separations. HIC step was operated at constant flow rate of 3 mlmin ' and loaded with different sample volume.
7.24 The overall purity and product yield achieved by the chromatographic sequence of HIC and SEC separations. HIC is operated at different combination of flow rate and sample volume.
7.25 The throughput and product yield achieved by the chromatographic sequence of HIC and SEC separations. HIC is operated at different combination of flow rate and sample volume.
7.26 The trade-off between maximum purity and throughput achieved by the chromatographic sequence of HIC and SEC separations. HIC step is operated at flow rate of 3 ml mi n"' and loaded with sample of 10 ml.
ABBREVIATIONS
AC Affinity chromatography
ADH Alcohol dehydrogenase
Cl Contamination index
CIP Cleaning-in-place
CV Column volume
EU Endotoxin unit
FD Fractionation diagram
FDA Food and Drug Administration
FFT Fast Fourier transform
GC Gas chromatography
HCP Host cell protein
HETP Height equivalent to one theoretical plate
HIC Hydrophobic interaction chromatography
HPLC High performance/pressure liquid chromatography
lEC Ion exchange chromatography
LAL Limulus Amebocyte Lysate
EC Liquid chromatography
oc
Orthogonal collocation methodOCFE Orthogonal collocation on finite element method
ODE Ordinary differential equation
PDE Partial differential equation
PF Purification factor
PSD Particle size distribution
rDNA Recombinant DNA
Re Reynolds number
RPC Reversed phase chromatography
SEC Size exclusion chromatography
UCL University College London
CHAPTER 1
INTRODUCTION
1.1
Background
Biochemical engineering has contributed to the immense industrial exploitation o f
biological organisms within manufacturing processes. The development o f efficient
and reliable means for protein purification often forms a key element for successful
individual exploitation. Biotechnological innovations have made their mark on a
number o f diverse fields including the pharmaceutical, biomedical, agrochemical,
and food processing industries. While these innovations are in large measure a result
o f recent advances in recombinant DNA and cell culture technologies, few would
have been possible without concomitant advances in protein purification
technologies. The need for protein purification methods is greatest in the
biopharmaceutical manufacture where many o f the new products are proteins:
vaccines, blood proteins and hormones (Walsh, 1998). The purification requirements
for these products are very exacting, and hence it is not uncommon that the majority
o f the development cost o f the new therapeutic protein is spent on purification and
validation (Walsh and Headon, 1996).
The pharmaceutical industry is one o f the great activity. The estimated world-wide
sales o f biopharmaceuticals in 1993 was about $5 billion. In 1997, this value had
risen to over $7 billion. The biopharmaceutical market is likely to be in the region o f
Chapter 1: Introduction
pharmaceutical market, likely to stand at $250 billion by that time (Walsh, 1998).
Table 1.1 shows the estimated market value of some biopharmaceuticals in 1997
while Figure 1.1 shows the therapeutic medicines which were in development in
1999.
a-Interferon Cancer, Viral infection 1986 1000
fT Interferon Multiple sclerosis.
Viral infection
1993 35
y-Interferon Chronic granulomatous disease 1990 45
Erythropoietin Anaemia 1989 1800
Factor VIII Haemophilia 1993 445
Ciranulocyte colony stimulating factor
Neutropenia 1991 870
Human growth hormone
Growth deficiency 1985 660
Insulin Diabetes mellitus 1982 1000
Interleukin 2 Cancer 1992 50
OKT 3 monoclonal
antibody
Kidney transplant rejection 1986 160
Tissue plasminogen
activator
Cardiovascular disease 1987 120
Chapter 1: Introduction
C a n c e r f R e l a t e d D i s o r d e r s i n f e c t i o u s D i s e a s e s A I D S f H I V I n f e c t i o n H e a r t D i s e a s e N e u r o l o g i c D i s o r d e r s R e s p i r a t o r ; D i s e a s e s ^ A u t o i m m u n e D i s o r d e r s
. 2 T r a n s p l a n t a t i o n 14 TO
O S k i n D i s o r d e r s m W M 1 4 ^ D i a b e t e s f R e l a t e d D i s o r d e r s
Û.
G e n e t i c D i s o r d e r s D i g e s t i v e D i s o r d e r s B lo o d D i s o rd e r s In fe r t i l i t ; G r o w t h D i s o r d e r s
E ; e C o n d i t i o n s = 3 O t h e r D i s e a s e s
c
1
20
136
40 60 80 100
No. of M e d i c i n e s
120 140 160
Figure 1.1: Biotechnology medicines for therapeutic purposes in development (Holmer, 2000).
Nearly all the drugs listed in Table 1.1 require chromatographic purification in their
manufacture. Chromatography has been established as the pre-eminent separation technique for the large-scale purification of proteins and other biomolecules due to its high selectivity, stability and economy. During the last two decades,
chromatography has therefore become an integral and indispensable part o f the
biochemical engineering industry. Most regulatory authorities, such as the FDA (Food and Drug Administration), expect at least one chromatographic step to be used in manufacturing a protein-based biopharmaceutical. It is very common that
sequences, consisting of maybe three chromatographic steps, are applied in a purification scheme for a product derived from a biological source for example
produced by fermentation or cell culture (Sofer and Hagel, 1997). The demand for efficient preparative and large-scale liquid chromatographic separation processes to
C hapter 1: Introduction
1.2
Motivation o f the Project
Cliromatography is widely used in the manufacture o f biopharmaceuticals.
Prediction o f process performance and the trade-offs necessary for efficient
cliromatographic step and sequence operation is limited and time consuming given
the complexity o f the system and the highly interactive nature o f the multi-steps
involved in such processes. In order to determine the optimum conditions for a
chromatographic process, decisions have to be made on the trade-offs between the
speed o f separation, resolution and recovery. This trade-off relationship is often
represented qualitatively as a triangle, where each apex symbolises a single objective
in the optimisation o f a chromatographic separation (Figure 1.2).
Speed
Recovery Resolution
Figure 1.2: The major three elem en ts of p ro cess trade-offs in chrom atographic separation.
Realising the most desirable values for all three objectives at the same time is
considered impossible because they are closely interdependent on each other. For
example an increase in recovery is often achieved only at the expense o f speed or
resolution. Similarly to achieve higher resolution, the process time may have to be
lengthened and the recovery will then be sacrificed. Chromatographic purification
processes tend currently to be optimised empirically. Separation media, running
C hapter 1: Introduction
expertise o f the responsible scientists (Jungbauer and Kaltenbrunner, 1999), and this
is often done in another lengthy “trial and error” development process.
Chromatograms are the final outputs o f a mathematical chromatographic simulation
or a chromatographic experiment. The quantity o f raw data generated in such trials is
considerable and there is a requirement for an effective approach to handle the large
amount o f chromatographic data systematically and to identify suitable operating
strategies rapidly. Such an approach would be capable o f reducing the time for
engineers or scientists^ are involved in the lengthy “trial and error” process
development.
Strategies for the selection o f cutting points for product pooling is another area that
has not been extensively studied. The only research^has been reported is for an
HPLC experimental system to produce a semisynthetic lipopeptide antifungal (Oram
et al., 2001). However this work was system-specific and the generic nature o f the
method was not proven.
Studies had been carried out to investigate the optimised conditions for a single
chromatographic separation (Golshan-Shirazi and Guiochon, 1991; Felinger and
Guiochon, 1996, 1998; Jacobson et al., 1992; Mao and Hearn, 1996; Klatt et al.,
2000, Teoh et al., 2001). To date, no optimisation studies have been reported
analysing chromatographic sequences. However all these studies rely heavily on
chromatographic data produced by the mathematical models developed. The systems
simulated were either semi-preparative or preparative, and no research work on
process scale has been demonstrated. In biotechnology, computer-aided simulation is
less far advanced than in chemical engineering. The major obstacle o f mathematical
modelling o f chromatography in biotechnology, is the complexity o f the variables,
problems with the estimation o f the parameters o f the process and o f the relevant
biological systems, and the highly non-linear nature o f the chromatography. A
chromatographic system involved in a bioprocess is unique in terms o f the
combinations o f physical properties o f the biological materials dealt with and
C hap ter 1: Introduction
the outcome o f the separation. Besides, the complexity o f the partial equations
system, parameter estimation and numerical techniques used to solve the
mathematical model are the unfavourable drawback for engineers or operators.
Therefore a generic methodology, which does not necessary rely on mathematical
modelling to produce the chromatograms, is required to find the optimum conditions,
in terms o f speed, resolution and recovery, for the chromatographic steps.
The separation goals o f a chromatographic run sometimes can be viewed from two
different angles: product purification and contaminant removal. The former has the
intent o f increasing the recovery and the final purity o f the product. The latter
focuses on the removal o f undesired contaminants present in the product to avoid
adverse effects may be caused by the contaminants. The former is important to
develop a cost-effective process, the latter is important in the validation o f the
chromatographic step. In making operating decisions, the consideration o f the trade
offs between these two different separation goals has to be dealt with simultaneously.
In biotechnology, it is very common for the product and impurity o f a
chromatographic separation to be expressed in different units and for there to be no
mass equivalence. This leads to a further feature to be examined. For example, in the
separation o f an enzyme from total protein the enzyme level is often expressed in
terms o f enzymatic activity whilst total protein is expressed in normal concentration
units i.e. mgml '; in the purification o f plasmid DNA for gene therapy the DNA level
is often expressed in mgml ' whereas that o f a major contaminants, endotoxin, is
expressed in EU (endotoxin unit). Conversion to consistent units is often not
. o f
straightforward. Process optimisation and generation^operating windows for such
systems would be difficult because o f the inconsistency o f the masses expressed.
This PhD study aims to address a number o f the above-mentioned problems and
C hapter 1: Introduction
1.3
General Background o f Chromatography
Having defined the background and main motivations pertinent to this PhD study,
the following sections serve as a general introduction to chromatographic
separations. The theoretical background o f chromatography will be discussed in the
next chapter.
1.3.1 Historical Background
Chromatography has long been established as an effective and reliable separation
means in biology and biochemistry since 1906, when the Italo-Russian botanist
Michael Tswett (1872-1919) applied the technique in the separation o f the pigments
o f chlorophyll into bands on a column o f chalk (Tswett, 1906). There was no major
development until the 1930s when thin-layer and ion-exchange chromatography
were each established as regularly-used separation techniques. The next major
developments occurred in the late 1940s and early 1950s when the Swedish scientist
Tiselius (1940, 1943) was awarded a Nobel Prize in 1948 for his research on
‘Electrophoresis and Adsorption Analysis’. He developed the new classical
procedures by observing the properties o f solutions in the chromatographic process
and classifying these into three major groups, differing in the principle o f the
separation (which will be discussed further in Section 1.4), namely elution
chromatography,displacement chromatography and frontal analysis. Later the British
researchers Martin and Synge (1943) were the 1952 Nobel Prize winners for the
invention o f ‘partition chromatography’.
The 1960s and 1970s saw a rapid rise in the routine use o f chromatography as a
universal analytical technique, particularly in chemistry, biology and medicine.
While chromatography was maintaining its predominant position as a routine
analytical tool and in trace analysis, this period also marked a revival o f interest in its
role as a technique for preparative separation, particularly at process-scale.
Chapter 1: Introduction
the early 1980s for the production of insulin and serum proteins. Currently, almost all processes for the purification of therapeutic agents require the excellent resolving
power offered by chromatography to meet the stringent purification specifications set down by the regulatory authorities. Table 1.2 shows the list of some of the most
important commercial biotechnological products destined for therapeutic administration that involve chromatographic separation in their purification.
H o r m o n a l p rep aration s
Insulin T reatm en t o f d ia b e te s m e ll it u s
B l o o d C o a g u la tio n factors. T reatm en t o f b lo o d d isord er s e.g. p rod uc ts serum alb um in h a e m o p h ilia
C y t o k i n e s In terleukins, in terferons
T reatm en t o f c a n c e r and in fe c t io u s d is e a s e s
E n z y m e s U ro k in a se, asp aragin ase , tPA
T h r o m b o ly ti c a g e n t s, d i g e s t i v e aids, d eb rid in g a g e n t s (i.e. c l e a n s i n g o f w o u n d s ) V a c c i n e s H epatitis B su rface
an tige n , H IV an tige n s
V a c c in a t io n a g a in st v a r io u s d is e a s e s
M o n o c l o n a l R aised again st P a ssiv e im m u n is a t io n a g a in st various a n t ib o d i e s s p e c if i e d a n tig e n s d is e a s e s , c a n c e r treatm en t, general d ia g n o s i s
Table 1.2: Chromatographically purified biochemical products destined for therapeutic administration.
1.3.2 What is Chromatography?
Chromatography, by definition, involves the differential distribution of solute molecules between two phases, one of which is known as the stationary phase, and
C hapter 1: Introduction
chromatographic column dissolved in a gas or liquid stream known as the mobile
phase, eluent or carrier. The mobile phase in gas chromatography (GC) is usually an
inert gas such as nitrogen or helium, but may be replaced by (or admixed with) a
vapour or by a supercritical fluid. The mobile phase in liquid chromatography (LC)
may be water, an aqueous solution o f an acid, base or salt, organic solvents or
mixtures thereof. The mobile phase and the sample will be introduced to the column
at the inlet and the effluent will be collected and monitored at the outlet. The success
o f the separation depends on the ability o f the mobile phase to elute selectively the
components retained by the stationary phase as it flows through the column.
1.3.3 Process Perspective of Chromatography
As biotechnology moves from the research laboratory into the marketplace, the need
for large-scale production processes becomes pressing. Within this thesis the
materials o f study are mainly proteins, therefore this section focuses on the role o f
chromatography in protein purification. There are many proteins that are currently
available as drugs, such as insulin, hepatitis B vaccine, interferon and human growth
hormone. Many more biotech-produced therapeutics proteins are expected soon and
manufacturing approaches must keep in pace with the development o f these products
and their movement into the marketplace. To manufacture these products, a process
that operates at large scale, producing large quantities economically must be evolved.
The production processes for such biological materials are generally divided into
upstream and downstream operations. A generalised downstream processing scheme
typically utilised in the production o f protein-based products destined for therapeutic
or diagnostic application is outlined in Figure 1.3.
The upstream element includes fermentation and cell culture. The downstream
operations include recovery and purification steps o f which chromatography is key.
C hapter 1: Introduction
Liquid preparation
Extracellular Protein R ecovery o f cells
Rem oval o f debris Intracellular Protein
Powdered preparation (freeze dried) Cellular disruption (hom ogenisation)
R em oval o f cells Source Material
Final Product Size exclusion chromatography H ydrophobic interaction chromatography
Concentration o f extract (ultrafiltation, precipitation, ion-exch ange) Ion-exchange chromatography
Incorporation o f stabilisers, preservatives and adjustment o f potency to required value
Figure 1.3: G eneralised outline for the production of protein products destined for therapeutic or diagnostic application (Walsh and H eadon, 1996).
separation o f product from whole cells and other insolubles by a solid/liquid
separation means, such as centrifugation or filtration. In the case o f intracellular
materials, cell disruption, by for example homogenisation, is carried out after the
harvesting step. (Sharma, 1986). Centrifugation is then used for the further removal
o f any remaining whole cells and cellular debris.
In the case o f extracellular proteins, often enzymes and antibodies, a concentration
step is usually employed first. This can be achieved by ultra-filtration, precipitation
or batch ion-exchange procedures. In the case o f most intracellular proteins, this
concentration step is unnecessary, although precipitation and, in particular, batch
C hapter 1: Introduction
particulate matter or lipids which might subsequently foul the chromatography
columns.
Chromatography is then employed to achieve the required levels o f high-resolution
purification. Chromatography is frequently the only operation capable o f providing
the very high purity levels required. Moreover, other purification techniques, such as
fractional precipitation, electrophoresis, isoelectric focusing and membrane filtration
often involve heat generation or the presence o f strong shear forces each o f which
might damage the product. Chromatography usually permits milder processing
conditions close to physiological, so avoiding dénaturation (unfolding o f the protein
molecule) and retaining biological activity. Chromatography also offers the
advantages o f process speed, resolving power, and ability to handle small amounts of
material.
The chromatographic separation usually involves a series o f chromatographic steps,
rather than a single step, to achieve the desired high degree o f purification. The
number o f steps solely depends on the recovery achieved by each individual step, on
the overall purity required and on the nature and ease o f removal o f the contaminants
from the product. Often the number o f these chromatographic steps is kept to be the
minimum for the process to be economical, and hence, it is very important to
optimise or fully utilised each individual step in order to achieve maximum
resolution and recovery.
1.4
Elution Modes o f Chromatography
There are three major ways o f desorbing bound solutes from the stationary phase i.e.
medium o f chromatography. They are elution, frontal and displacement
C hapter 1: Introduction
1.4.1 Elution Chromatography
The elapsed time from the initial application o f the elution buffer until the exit o f the
sample peak from the column is the elution time or the retention time (//?), the
volume o f the elution buffer applied in this time is the elution volume (Vr). A plot o f
the concentration o f the solute in the effluent against the elution time, or volume
registered by a detector at the column outlet would typically appear as Figure 1.4,
showing complete separation of the individual components.
à i
tR l
Solute concentration
time
Figure 1.4: Elution profile of a binary mixture by chromatography.
The technique shown in Figure 1.4 o f achieving the separation o f the sample
components is called elution chromatography. In elution chromatography, the feed
mixture is introduced into the column approximately as a Dirac pulse. If the
composition o f the mobile phase does not change throughout the separation, the
process is referred to as isocratic elution. If the composition o f the mobile phase is
changed abruptly to elute the solute the process is called step elution. If the
composition is varied gradually during the process, it is known as gradient elution or
differential elution. Protein adsorption tends to follow the all-or-nothing principle
C hapter 1: Introduction
molecules will either adsorb strongly to the surfaee o f the stationary phase or show
no tendeney to adsorb at all. Since the elution windows o f all sample proteins will
rarely overlap, their separation by isocratie elution is difficult. Hence, step or
gradient elutions are applied to bring about the separation o f a multieomponent
protein mixture. Elution with an appropriate gradient or with step gradient will result
in relatively sharp peaks and a reduction o f peak "tailing". The elution mode o f
chromatography in commonly employed is preparative and process chromatography.
1.4.2 Frontal Chromatography
Frontal chromatography or frontal development constitutes a binary separation
process in which only the least-retained component can be separated. A plot o f solute
concentrations vs. effluent volume for frontal chromatography would appear as
shown in Figure 1.5. If the mixture contains three components A, B and C, and if
compound A is less strongly retained than B and C, compound A appears first in the
effluent from the column, followed by a mixture o f A and B and then by a mixture o f
A, B and C. This method cannot be used for preparative separation o f A, B and C,
but is useful for the removal o f small quantities o f strongly retained impurities from
bulk o f the material.
Solute concentration
A+B+C
Elution volume
Chapter 1: Introduction
1.4.3 Displacement Chromatography
Displacement chromatography involves the use o f a displacing agent, say D, which
has a stronger affinity toward the stationary phase than any o f the sample
components A, B and C. Figure 1.6 shows the typical concentration profile o f the
effluent for a displacement chromatography. After the introduction o f the sample
onto the stationary phase, a solution o f D in a suitable solvent is allowed to pass
through the column. As it moves down the column, compound D competes with
sample components for the active sites on the stationary phase and displaces them.
C ompound C, in turn, displaces the less strongly retained components A and B, and
so on, resulting in a series o f contiguous zones, one for each component.
Solute concentration
Elution volume
Figure 1.6; Solute concentration profile of the column effluent in displacement chromatography, shaded areas are the mixed zones. (Ravindranath, 1989).
I'he zones o f pure compounds are interspersed with those o f the mixed fractions that
may be collected and recycled. Displacement chromatography is primarily important
for preparative separations as it uses the column capacity much better than in elution
(Horvath, 1985). A comparison o f overloaded elution and displacement in
preparative chromatography shows that the choice between the two modes depends
largely on the comparative economics or displacing agent recovery and fraction
C hapter 1: Introduction
1.5
Types o f Chromatography
An appropriate choice o f the chromatographic method is very important in order to
achieve an effective separation o f compounds. Much ingenuity has been exercised in
devising many types o f chromatography and only the most basic and relevant to this
PhD study will be discussed. Since this research project is confined to conventional
fixed-bed liquid chromatography and, to a limited extent, on expanded bed
adsorption, no further explanations on gas chromatography, supercritical fluid
chromatography, perfusion chromatography, chiral chromatography, and
countercurrent chromatography will be given.
1.5.1 Configuration of Chromatographic Bed
1.5.1.1 Packed Bed System
The most common bed configuration for chromatography is that o f the packed bed in
so called column chromatography. The stationary phase is packed into a tube through
which the mobile phase, or buffer, is pumped. Once the bed is packed, the bed height
o f the m atrix is unchanged during the whole chromatographic process. Packed bed
chromatography can be performed as low pressure, medium pressure or high
pressure. The sample load is normally applied at the top o f the column while the
fractions are collected from the bottom o f the column.
In packed bed chromatography, it is very crucial to achieve good column packing.
The packing techniques and procedures employed differ depending on the type o f
stationary phase (gel matrix). The most important discriminating^is the rigidity o f the
gel matrix. Detailed packing instmctions are usually provided by the manufacturers
C hapter 1: Introduction
1.5.1.2 Expanded Bed System
Expanded bed chromatography is a special case o f fluidised bed adsorption in which
a specially designed agarose/crystalline quartz composite adsorbent, and 4 ^ 0
column sample distributor plate, stabilises the fluidised bed to the extent that a plug
flow situation prevails during the sample application cycle (Ersson et a l, 1998). This
will lead to a relatively high binding efficiency in a single sample application cycle.
The particle size and density gradients o f the adsorbent particles forming the column
helps to achieve the stabilisation o f the bed.
Figure 1.7 is a schematic illustration o f an expanded bed adsorption. In expanded bed
adsorption, the adsorbent particles are poured into the column until the bed settles to
a certain sedimented bed height (Figure 1.7(1)). The buffer is then pumped
continuously upward through the bed, causing the bed to expand two or three-fold
(Figure 1.7(2)). After stabilisation o f the expanded bed is complete, the sample is
loaded from the bottom o f the column (Figure 1.7(3)). Once sample loading is
complete, the column is washed with buffer to remove entrapped particles e.g. cells,
cell debris and to wash out nonadsorbed species. Elution takes place, in a reversed
flow direction, either stepwise (step elution) or by applying a salt or pH gradient
(gradient elution) as depicted in Figure 1.7(4). The concentration profiles obtained
from the output o f the expanded bed adsorption are the same as the chromatograms
o f the fixed bed systems.
1.5.2 Scale of Operation
This section is intended to distinguish the different scales o f the chromatographic
systems. The scale o f the operation can be classified into three groups: analytical,
preparative and process chromatography. These three categories differ in terms o f
size of the column and quantity o f the materials, they are carried out. Table 1.3
Chapter 1: Introduction
(3)
Figure 1.7: Schematic illustration of a typical expanded bed adsorption cycle. (1) sedim entation of adsorbent particles; (2) expansion of bed; (3) loading of sample and washing step; (4) elution in reversed flow. Arrows show the directions of flow.
( VJilliS,.
x o c c )
Internal diameter Typical dimension (mm) Quantity of
Analytical 1 - 6 2 5 0 x 4 .6 Pg
Semi-preparative 7 - 2 5 250 X 1 0 - 2 5 mg
Preparative 2 5 - 1 5 0 3 0 0 x 5 0 - 100 g
Process > 150 1 0 0 0 x 3 0 0 kg
Table 1.3: The difference in scales of chrom atographic operations (Teoh, 2002)
Besides the scale o f the operations involved, the fundamental difference between
analytical, preparative and process scale chromatography is the intended separation
goals. Analytical chromatography is defined as a procedure carried out for the sole
C hapter 1: Introduction
o f a sample. Generally a very small sample size is applied onto the column and the
maximum resolution is in order to identify the solute accurately.
Preparative and process scale chromatography on the other hand have the same
separation goal. They are carried out for the purpose o f purifying and isolating a
compound from a mixture. The product is the component o f interest in the sample
which has been separated and collected, and may be used for further analysis,
research testing, assay reagents, clinical trials, or commercial sale. In contrast to the
analytical chromatography, the maximum throughput, instead o f the maximum
resolution, at a defined purity is the principal consideration in preparative and
process chromatography. The sample is applied as a high concentration solution or in
a large volume as a very dilute solution in order to maximise the throughput.
Preparative chromatography and process scale chromatography may be carried out
on a wide range o f scales, from nanograms to lO’s or lOO’s o f kilograms, depending
upon the application.
1.5.3 Chromatographic Techniques
There are fundamentally two different mechanisms involved in liquid
chromatography: one is based on adsorption and another is independent of
adsorption. Adsorption involves the interaction or binding o f the sample components
at the solid stationary phase. The binding can be either non-covalent in nature e.g.
ion exchange and hydrophobic interaction or covalent in nature e.g. affinity
chromatography. Adsorption usually involves competition between different solute
components in the sample for the adsorbed phase. In size exclusion chromatography
the separation mechanism is non-adsorptive. For a given sample and matrix, the rate
o f migration within the size exclusion chromatographic column is primarily
determined by kinetic factors such as the hydrodynamic volume o f the solute. In
adsorption chromatography the rate o f migration o f the sample is primarily
C hap ter 1: Introduction
characteristics), and the shape o f the elution profiler is determined by the kinetic
factors (diffusion characteristics).
The types o f adsorption chromatography are classified according to the interaction
that occurs between the sample component and the stationary phase. Ion exchange
chromatography is based on the electrostatic interactions between molecules in the
sample and the ion exchange matrix. Hydrophobic interaction and reversed phase
chromatography are based on the interactions between hydrophobic portions o f the
sample and a hydrophobic solid phase. Affinity chromatography is based on specific
interactions between the sample and a complementary structure bonded to the solid
phase. In the case o f size exclusion chromatography, the separation is based on the
different rates o f diffusion o f molecules in a porous matrix.
Ion exchange chromatography, size exclusion chromatography, affinity
chromatography and hydrophobic interaction chromatography are the most common
types o f chromatography and are used extensively in manufacturing o f
pharmaceuticals. These four different modes chromatographic techniques will be
discussed according to the preferred sequence o f used concluded in the analysis by
Bonnerjea et al. (1986). This study showed that ion exchange chromatography was
most often used as the first chromatographic step, followed by hydrophobic
interaction chromatography and affinity chromatography. Size exclusion
chromatography often functions as the ‘polishing step’ and was placed last step in
the sequence.
1.5.3.1 Ion-exchange Chromatography (lEC)
1.5.3.1.1
Basic Concepts
The basis o f separation in ion-exchange chromatography is the electrostatic attraction
between the solute molecules and dense clusters o f charged groups on the solid
C hapter 1: Introduction
attached to a peptide backbone. These groups may be positively or negatively
charged, or they may be electrically neutral, hence proteins are considered
"amphoteric". The ion exchange resin contains electrically charged species, such as
carboxyl or quaternary ammonium groups, covalently attached to the resin.
Associated with each linked charge is a counter-ion o f opposite charge, bound only
by ionic attraction.
The retention mechanism is governed by the simple exchange o f solute ions o f solute
X and mobile phase ions Y with charged groups R o f the stationary phase, which can
be expressed as equations below:
X + R^Y 4^ Y + R^X (Anion exchange)
X^ + R Y^ 4^ Y^ + R X^ (Cation exchange)
Solute ion X in the mobile phase displaces another ion Y from the stationary phase
and is thereby retained at the ion exchange site, R. These reactions are reversible.
Solute ions X that compete only weakly with the mobile phase eluent ions Y for ion
exchanger sites R will be retained only slightly on the column. Solute ions that
interact strongly with the ion exchanger elute later in the chromatogram. The
mechanisms o f these reactions used to bring lEC about resemble those o f adsorption
so closely that for most engineering purposes lEC can be simply considered as a
special case o f adsorption.
Common chromatographic column packings include carboxymethyl and
diethylaminoethyl groups attached to cellulose, agarose and dextran. The last two
resins are widely used for protein chromatography. Solutes are eluted by changing
the pH or ionic strength o f the mobile phase. Salt gradients are the most common
C hap ter 1: Introduction
1.5.3.1.2
Applications
Ion exchange is a versatile separation technique, with applications throughout the
biochemical-process industries. Ion exchange chromatography is capable o f
providing high resolution o f macromolecules in separation and has been employed
extensively for the fractionation o f multicomponent ionic mixtures such as
antibiotics and proteins.
At physiological pH values most proteins exhibit a net negative charge, and hence
anion exchange chromatography is more commonly used than cation exchange. The
amphoteric nature o f proteins ensures that conditions exist under which almost any
soluble protein can be purified by ion exchange chromatography. The relatively mild
binding and elution conditions allow high protein recovery with intact biological
activity. While the protein must be soluble, ion exchange matrix can withstand harsh
conditions, allowing the use o f nonionic detergents and chaotropic agents to maintain
sample solubility.
lEC is often employed in the early stage o f purification i.e. the first step in
chromatographic sequence (Bonnerjea et al., 1986) because it can deal with
relatively high sample loads. The volume and concentration o f the sample can be
very high since all product is adsorbed, unless the solution contains a high
concentration o f competing ionic substances (e.g. has a high ionic strength). The
maximum sample loading is recommended to be below 80% o f the maximum
capacity o f the ion-exchange column. For cases where high purity and recovery are
desired, the sample load may be restrained to 30% o f the capacity o f the
cliromatographic medium (Sofer and Hagel, 1997).
The vast majority o f protein purification procedures employ at least one ion
exchange step (Ersson et a l, 1990). Besides this, lEC also plays an important role in
the purification o f many antibodies and nucleic acids, and to a lesser extent peptides.
The popularity o f ion-exchange chromatography is based upon the high level o f