R E S E A R C H
Open Access
A multiband RF signal sampling frequency
selection method based on cylindrical
surface spectrum analysis
Haijiang Wang
1,2*, Yangyang Deng
1,2, Bao Dong
1,2, Ling Yang
1,2, Zhendong Yao
1,2and Debin Su
1,2Abstract
Sampling frequency selection is a key issue in direct digitalization of the radio frequency (RF) signals. In this paper, we propose a cylindrical surface spectrum and arc distance-based sampling frequency selection method for multiband RF signals. In this method, a 3D visual expression of cylindrical surface spectrum of digital signal is introduced. This expression reflects better the circulatory nature of the spectrum of digital signals. It is found more intuitive, heuristic, and effective in dealing with undersampling issues of multiband RF signals than conventional spectrum expressions are. A function of arc distance between two frequency bands are also introduced which turns out to be useful in the determination of sampling frequency and design of digital filters.
Keywords:Cylindrical surface spectrum, Arc distance, Multiband, Sampling
1 Introduction
In the application of modern electronic technology, sam-pling from continuous (analog) signal to obtain digital signal has become one of the most common technolo-gies. The relationship between an analog signal and the digital signal sampled from it can be mathematically de-scribed by the sampling theorem. As for the baseband signal, the Nyquist criterion requires that the sampling frequency must be more than twice the upper limit of analog signal frequency band, which has long been well known in engineering design. However, with the rapid development of technology, the direct sampling of high frequency signal has become a reality and the Nyquist criterion under literal meaning has long been broken through. What is called “undersampling” technology (which means sampling at a rate below the Nyquist fre-quency) has been developed. But meanwhile, with the application of software radio idea and the emergence of new types of radar and new communication system, the RF signals and their spectrums are more and more com-plex. For example, in dual-frequency or multi-frequency
radar, the RF echos contain multibands. And in 4G and the upcoming 5G communications, multicarrier or multiband RF signals are very common. These complex multiband signals pose new challenges to their sam-pling. In the past two decades, sampling and efficiently reconstructing multiband RF signals has been investi-gated in many literatures in recent years. The earliest study can be traced to the end of the last century. For example, Raman Venkataramani and Yoram Bresler inves-tigated periodic nonuniform sampling and multichannel processing based sub-Nyquist sampling of multiband sig-nals [1, 2]; Dennis M. Akos et al. studied direct bandpass sampling of multiple distinct RF signals and proposed a novel technique to determine the absolute minimum sam-pling frequency for direct digitization of multiple, nonad-jacent, frequency bands [3]. Moshe Mishali et al. discussed blind sampling and reconstruction of multiband signals and realized compressive sensing for multiband analog signals with relative small sampling rate under the condi-tion that only the number of bands and their widths are assumed without any other limitations on the frequency support [4], but the theoretical lower bound on the aver-age sampling rate is still twice the minimal rate of known-spectrum recovery. In [5], Satyabrata et.al presented an al-gorithm to determine the minimum bandpass sampling frequency for direct downconversion of multiple distinct
* Correspondence:[email protected]
1College of Electronic Engineering, Chengdu University of Information
Technology, Chengdu, Sichuan 610225, China
2CMA Key Laboratory of Atmospheric Sounding, Chengdu, Sichuan 610225,
China
RF signals, but in this literature, the iteration-based algo-rithm was a little complicated and besides, only the case of two frequency bands was considered. In [6], Jie-Cherng Liu reported an efficient method to find the ranges of valid bandpass sampling frequency for direct downcon-verting multiple bandpass analytic signals (single-sideband RF signals). The algorithm results in the ranges of valid bandpass sampling frequency for the complex signals in terms of bandwidths and band positions of the single-sideband RF signals. But in fact, just as the author said, compared to real bandpass sampling, the valid sampling frequency ranges of the analytic signals are easier to find than those of the real sampling. In recent years, the under-sampling of multiband RF signals was still an issue which was frequently researched on, and many meaningful re-sults were achieved [7–10]. For example, in [10], the authors proposed a method to select aliasing-free band-pass sampling frequency in optical phase-modulated and coherent detection (PM-CD) radio-over-fiber (RoF) links, but only two bands were considered. In the existing literatures for multiband signal sampling, all the analysis methods are based on frequency axes under the Cartesian coordinate system. Although the theoretical principle of these methods is still the sampling theorem, because of the disconnectivity between positive and negative fre-quency bands of the spectrum, getting digital signal spectrum from the analog signal spectrum according to the sampling theorem needs to shift the positive and negative frequency bands many times, which constitutes a complex picture. The key points of the problem are usu-ally concealed by this seeming complexity, making us un-able to obtain the essentials easily. Because the sampling problem of this kind of multiband signal has been increas-ingly common and important, to seek a more simple and clear geometric interpretation will be helpful in sampling and filtering the processing for this kind of signal in concept and even engineering design. So the cylindrical surface spectrum is proposed in this paper.
This tool has the advantage of intuition in concept, similar to the cylindrical phase surface in the oscillation theory and Riemann surface in the theory of complex vari-able functions [11]. It is more of a tool that is assisting with the thinking and imagination than with the comput-ing. With the assistance of this tool, the main points of the problem sometimes will be revealed more intensively and clearly, so it will even provide some enlightenment to solutions of some problems involving RF signal processing.
With the cylindrical surface spectrum tool, the concept of arc distance between digital signal frequency bands is introduced. This concept has some practical value in quantitative calculation of the sampling frequency selection and filter design for multiband RF signal digitalization.
2 Derivation of the cylindrical surface spectrum Suppose that the continuous-time signal u(t) has the follow relationship with its frequency spectrumU(f)
U fð Þ ¼
Provided that the sampling period isTs, sampling from
u(t)can produce the following sequence.
x nð Þ ¼u nTð sÞ ð2Þ
The sequence has the following spectrum according to the sampling theorem [12, 13].
Xð Þ ¼ω X
In the equation, fs= 1/Ts, representing the sampling
frequency.
The familiar result leads us to obtain the spectro-gram naturally by making left and right shift of the analog spectrum diagram on the frequency axis infin-ite time. That is to say, to show digital signal spectrum derived from sampling, more curves should be drawn. It is convenient to handle the sampling problem of the baseband signal in this way because the positive and negative frequency bands of this kind of signal spectrum are mutually connected. Moreover, it is enough to meas-ure the serious degree of aliasing effect by making the right shift of an analog spectrum, and the contribution of further shift terms can be ignored. If we discuss the under-sampling problem of the modulating signal, shift terms of the analog spectrum involved will be many. Further-more, the positive and negative frequency bands of the spectrum for analog signal are mutually separate; con-sequently, the shifts of the two parts must be taken into account thus making the method of analog spectrum shift no longer an ideal tool for analyzing.
Xð Þ ¼ω ⋯þfsU fs
2πðωþ2πÞ
þfsU fsω
2π
þfsU fs
2πðω−2πÞ
þ⋯
ð4Þ
In Eq. (4) we focus on one term equivalent to Eq3. (3) in whichm= 0. For simplicity, the symbolV(ω) is intro-duced to express it.
Vð Þ ¼ω fsU fsω
2π
ð5Þ
Although X(ω) is periodic with period of 2π,V(ω) is not, and its shape is consistent with the analog spectrum U(f) . On the horizontal axis,however, there is a flexible scale factor, that is
ω¼2π
fsf ð6Þ
Meanwhile, there is an amplitude factorfs. In this paper, we
callV(ω) the scaled analog spectrum in the later parts. When using the symbols in Eq. (5), Eq. (4) can be expressed as
Xð Þ ¼ω ⋯þVðωþ2πÞ þVð Þ þω Vðω−2πÞ þ⋯
¼ X∞ k¼−∞
Vðωþ2kπÞ
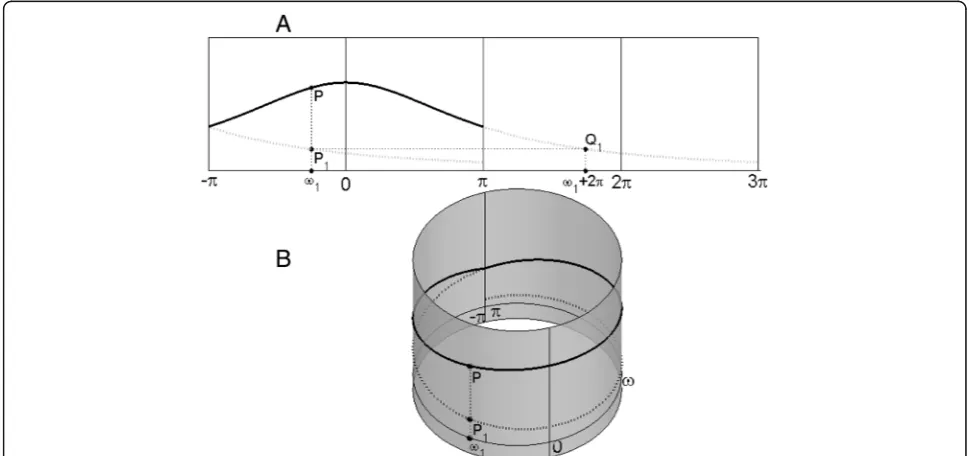
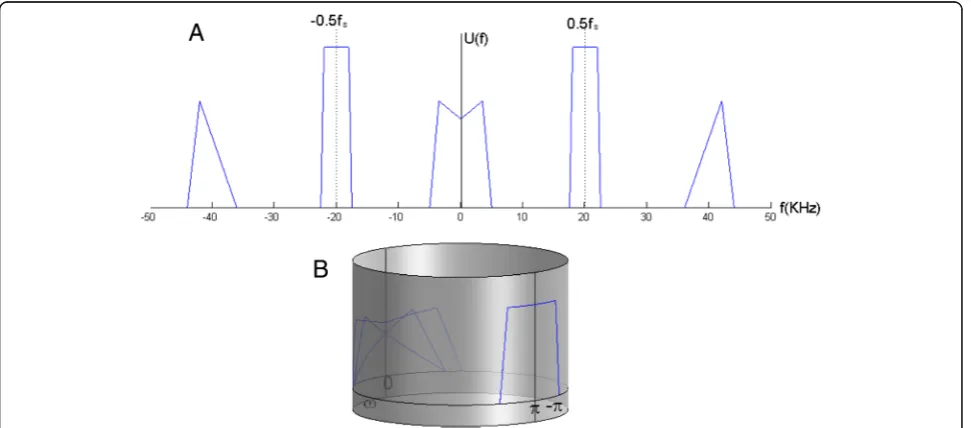
ð7Þ Firstly, only two terms in Eq. (7) are taken into consid-eration that is V(ω) and V(ω+2π). In Fig. 1a, as for a
length of amplitude magnitude of one signal’s scaled analog spectrum in the interval (−π,π], |V(ω)| is drawn by a solid line. At the same time, |V(ω+ 2π)| is drawn by a dotted line. Suppose that ω1 is any point in the interval (−π,π],
and its corresponding amplitude magnitude |V(ω1)| is expressed byP, while |V(ω1) + 2π| is expressed byP1. Their
corresponding complex numberV(ω) andV(ω+2π) should be added together according to Eq. (7). Otherwise, the value |V| whose abscissa is ω1+ 2π in the interval (π, 3π] also equals to |V(ω1+ 2π)|, and it can be expressed by Q1. Suppose that we cut down this strip of paper on
which the scaled analog spectrum in the interval (−π,π] is drawn and stick it on a cylinder whose cross section is a unit circle in the following way. Fix the origin of coordi-nates (0,0) on a point of R on the cylinder, and make the vertical coordinate direction parallel to the axis of the cy-linder. Furthermore, place the horizontal coordinate ω along the unit circle of the cylindrical cross section, which is perpendicular to the ordinate axis. The value of the horizontal coordinateωis equal to the arc length from the origin point to this abscissa point. Consequently, it is equal to the angle between the vector OR and the vector from the center of a unit circle O to this abscissa point. For the purpose of clarity, the abscissa that is fixed on the cylindrical surface is called circumferential coordinate, and the ordinate is called axial coordinate. Obviously, this paper just fully covers the cylinder surface because the width of the paper along the horizontal axis is exactly 2π. Next, choose the strip of paper on which the scaled analog spectrum in the interval (−π, 3π] is drawn, and fix it on the former paper in the same way to make them coincide with each other. Suppose that the pieces of paper are transplant, then the situation shown in Fig. 1b can appear, andP1overlaps together withQ1by now.
Thinking about the other terms in Eq. (7), we repeat the above steps. The transparent piece of paper in the interval ((2k−1)π, (2k+ 1)π] displays the amplitude mag-nitude ofV(ω+ 2kπ), which is any term in Eq. (7). As the value of k increases, the whole scaled analog spectrum |V(ω)| can be continuously expressed on the cylindrical surface. Therefore, the way of using a single curve and twining the cylindrical surface many layers replaces the way of using each shift term to represent the digital signal spectrum. By now, the aliasing effect is shown by twining the cylindrical surface with the same curve: more than one axis coordinate which are not equal to zero appear on the same circle coordinate of the curve. As a result of the addition of their corresponding complex number value, the shape of the digital spectrum is no longer similar with the spectrum of the analog signal used for sampling.
As a three-dimensional space curve, the expression on the cylindrical surface for the amplitude magnitude of the scaled analog spectrum is a three-dimensional vector type, andωis used as its parameter.
rð Þ ¼ω ½cosω; sinω; jVð Þω j ð8Þ As we see from Eqs. (5) and (6), the scale analog spectrum V(w) is proportional to the analog spectrum U(f). The spectrum on the cylindrical surface of the sampled digital signal can be derived from the spectrum of the analog signal directly. If we are only interested in the position and shape of the spectrum, then
r fð Þ ¼ cos2πf
fs ; sin
2πf
fs ; jU fð Þj
ð9Þ
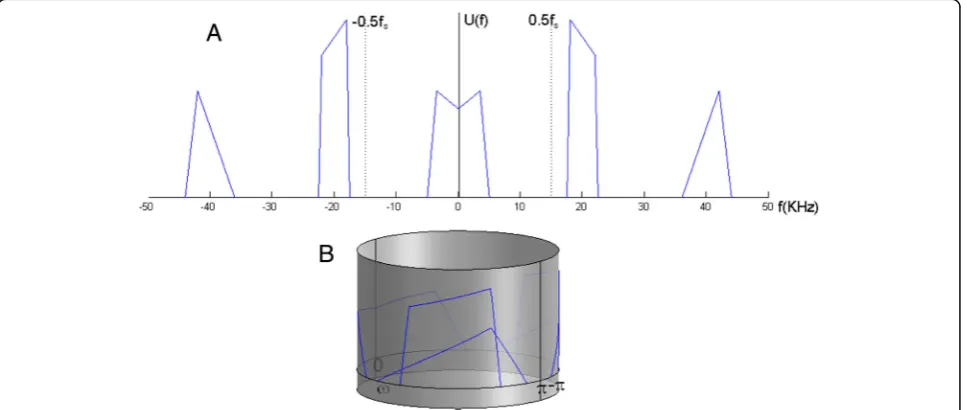
The following example can demonstrate it. Suppose that an analog signal has the spectrumU(f), as depicted
in Fig. 2a. Obviously, it contains a baseband signal whose bandwidth of double sideband is B0= 10KHzand
two modulating signals. Among the two modulating signals, the carrier frequency and modulation band-width of one isf1= 20KHz,B1= 5KHz, and of the other
is f2= 40KHz,B2= 8KHz. If the sampling frequency is
30 KHz, its spectrum on the cylindrical surface can be drawn according to Eq. (9), as illustrated in Fig. 2b.
It can be seen from the figure above, at such sampling rate, although in digital frequency domain, the two modu-lating signals are separate from the baseband signal, they overlaps and cannot be separated by filtering. We will return back to use this example in the fourth section, and use the arc distance of frequency band to obtain the appropriate sampling rate, so as to separate the signals.
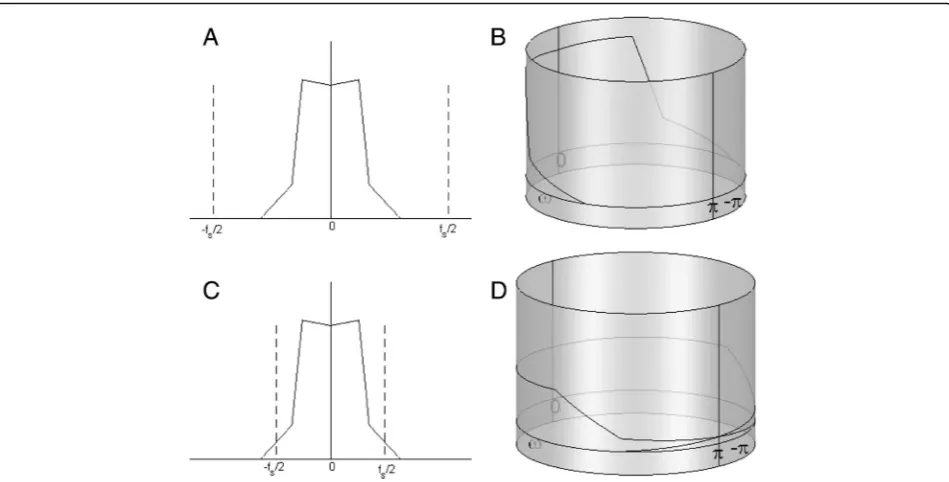
The meaning of Nyquist criterion is expressed by the cylindrical surface spectrum in Fig. 3. What Fig. 3a ex-presses is a baseband signal whose highest frequency is below half the sampling frequency. Its cylindrical surface spectrum is depicted in Fig. 3b. Because digital signal spectrum cannot cover the whole cylindrical surface, there will not be aliasing at this time. The same analog signal is illustrated in Fig. 3c; however, the half sampling frequency is below the highest frequency of the spectrum. Then the digital spectrum enters into another cylindrical layer from its original “layer”, consequently, the aliasing occurs, as illustrated in phase 3D.
3 The arc distance between the digital signal spectrum
As we can see from introducing the cylindrical surface spectrum, after multiplying the horizontal axisfby a scale factor 2πTs(Ts=1/fsis the sampling period), the scaled
co-ordinate axis obtained is twined around the unit circle as
the cylindrical cross section, and we can also see it from Eq. (6). Suppose that the analog frequency f2>f1, then
their corresponding points on the unit circle are z1
¼ej2πIsf1andz
2¼ej2πTsf2, respectively. Moreover, the arc
distance between the two points is defined as the absolute value of the argument of the quotient of the two complex numbers.
Dc¼jarg zð 2=z1Þj
¼πjmodð2Tsðf2−f1Þ þ1; 2Þ−1j
ð10Þ
To simplify the calculation, the arc length of the semi-circle is served as the calculation unit, then the factorπat the right most of the above equation can be eliminated. Moreover, among the filter calculating functions in MATLAB, it is used as the unit of the digital frequency.
The arc distance between the two digital frequencies changes when their corresponding analog frequency dif-ference changes, and the changing law is illustrated in Fig. 4.
Now, we discuss the arc distance between the two digital frequency bands. The arc distance between the two frequency points has been defined in Eq. (10), and the frequency band can be regarded as a set of points inside the distance space. According to the principle of set theory, suppose that there is any point u1∈U1 and any point u2∈U2, the distance
between the two sets of points U1 and U2 is the
greatest lower bounding of the distance d(u1,u2) :
d(U1,U2) = inf{d(u1,u2) :u1∈U1, u2∈U2}. Suppose that
there are two analog signals, and their center fre-quency are f01 and f02, and their bandwidth are B1
and B2,respectively. The corresponding arc distance of
the two center frequency is
Fig. 3The Nyquist criterion described in cylindrical surface spectrum: (a) the analog spectrum of a baseband signal whose highest frequency is lower than half of the sampling frequency; (b) the corresponding cylindrical surface spectrum of (a) after sampling; (c) the analog spectrum of a baseband signal whose highest frequency is higher than half of the sampling frequency; (d) the corresponding cylindrical surface spectrum of (c) after sampling
Dc0¼jmod½2Tsðf02−f01Þ þ1; 2−1j
¼jmodðα0þ1; 2Þ−1j
ð11Þ
Dc0(α0) has been depicted by dotted dash lines in Fig. 5.
Now, we take into account the arc distance between the corresponding digital frequency of any point f01+Δf1
and f02+Δf2. They are in the interior of frequency band
1 and frequency band 2.
Dc¼jmod½2Tsðf02þΔf2−f01−Δf1Þ þ1; 2−1j
¼jmod½2Tsðf02−f01Þ þ2TsðΔf2−Δf1Þ þ1; 2−1j
¼Dc0ðα0þξÞ
ð12Þ
In the equation, ξ= 2Ts(Δf2−Δf1). Let δ=Ts(B1+B2),
obviously,−δ≤ξ≤δ.
That is to say, by shifting the arc distance function Dc0(α0) of the center frequency a amount of ξ, the arc
distance between any two points inside the frequency band can be obtained. Under the condition of−δ≤ξ≤δ, change the value to obtain a curve family which moves horizontally, as illustrated in the shaded area in Fig. 5. For the given abscissa α0=α1, the distance between the
frequency band is the minimum value between its corre-sponding vertical coordinates (the point P in Fig. 5) among the curve family. Change the abscissaα1and to ob-tain the function as expressed by a heavy line in Fig. 5, and the heavy line is just the lower boundary of the shaded area. The process is as follows: move Dc0(α0) down an
amount ofδand replace the negative value by zero.
DcBðα0; δÞ¼maxð0; jmodðα0þ1; 2Þ−1j−δÞ
¼maxð0; jmod½2Tsðf02−f01Þ
þ1; 2−1j−TsðB1þB2ÞÞ
ð13Þ
4 Simulation and discussion of undersampling of the narrow-band signal
As one application example, we will discuss the under-sampling problem of the narrow-band signal. Suppose that the carrier frequency of the narrow-band signal is fc, the bandwidth is B, and the sampling period is Ts.
Then, α0= 2Ts[fc−(−fc)] = 4Tsfc, δ= 2TsB. The arc
dis-tance between its two frequency bands which are mirror symmetric is
Fig. 5The arc distance between two digital frequency bands
DcBð4Tsfc; 2TsBÞ ¼maxð0; jmodð4Tsfc
þ1; 2Þ−1j−2TsBÞ
ð14Þ
Because the maximum value of the functionDcB(α0, δ)
is 1−δ, it must be positive-valued. Otherwise,DcB(α0, δ)≡0,
meaning that the two mirror frequency bands are al-ways overlapping with each other, and it is impos-sible to separate them. This request can be expressed as
δ= 2TsB< 1⇒fs> 2B.
BecauseDcB(α0, δ) is a periodic function ofα0, its area
which is greater than zero appears periodically on theα0 axis. Such kth area is( illustrated in Fig. 5)
2kþδ<α0<2ðkþ1Þ−δ ð15Þ The already known results can be derived from it.
k
2fsþ
B
2<fc<
kþ1 2 fs−
B
2 ð16Þ
Let us go back to the example mentioned in the sec-ond section. As can be seen in Eq. (13), the arc distance between the frequency band is a function of five vari-ablesDcB(f01,B1,f02,B2,Ts). If the positive frequency bands
of the modulated signal whose center is f1 needs to be
extracted, we can calculate the distance between this
Fig. 7The cylindrical surface spectrum (b) of a multiband signal (a) when the minimum arc distance is 0.155
frequency band and other four frequency bands. The parameterx=f1Tsis introduced to reflect the change of
the sampling period.
Dc1¼DcBðf1;B1; f2; B2; x=f1Þ; Dc2
¼DcBðf1;B1; 0; B0; x=f1Þ;
Dc3¼DcBðf1;B1; −f2; B2; x=f1Þ; Dc4
¼DcBðf1;B1; −f1; B1; x=f1Þ;
In order to separate the frequency band f1 and other
four frequency bands, the minimum arc distance value should be calculated.
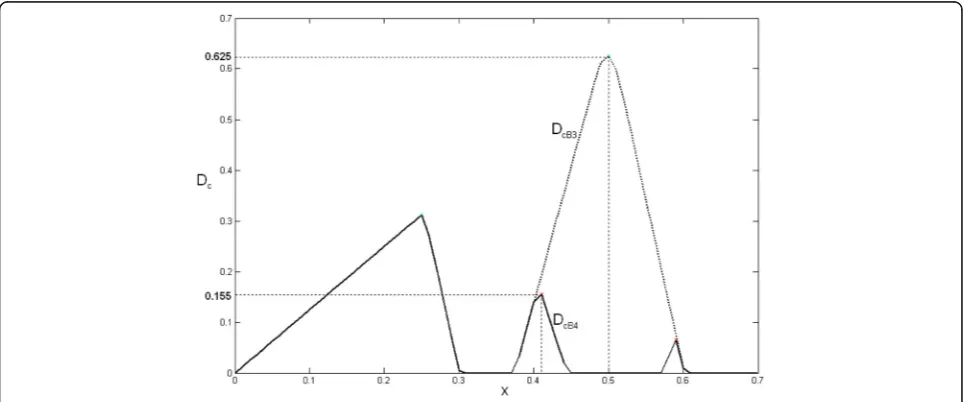
DcB4ð Þ ¼x min Dð c1;Dc2;Dc3;Dc4Þ ð17Þ Then, to find out the maximum value of Dc(x), the
parameterxshould be varied.
The above-mentioned function is illustrated by the solid line in Fig. 6. Its first extreme point appears when x= 0.25, and its corresponding sampling frequency is 80KHz. This is close to the Nyquist frequency under the literal meaning. Obviously, it is not the ideal choice. The second extreme point appears whenx= 0.41, and its cor-responding sampling frequency is 48.7805 KHz. The shortest arc distance between the frequency band expected to extract and the other frequency bands is 0.155. At this moment, the cylindrical surface spectrum is illustrated in Fig. 7. As can be seen from the figure, the frequency band f1that is expected to extract has been separated from the
other frequency bands. If this frequency band needs to be extracted, the quadrature demodulation must be con-ducted, and then, it should pass the low-pass filter. The shortest arc distance value 0.155 is the main basis which determines the transition bandwidth of the filter.
The assumption above is that the signal spectrum does not have the symmetry about the center frequency, mean-ing that it contains the information of phase. In order to obtain this information, the complex-valued signal needs to be obtained firstly. However, if the frequency bandf1is
a simply modulated audio signal, then the spectrum has the symmetry about the center frequency, that is to say, the two mirror frequency bands can overlap together. Thus, after removing the the arc distance between the sig-nal band and its mirror frequency bands, the arc distance in Eq. (17) turns out to be
DcB3ð Þ ¼x min Dð c1;Dc2;Dc3Þ ð18Þ Its value with the change ofxis illustrated by the dot-ted line in Fig. 6. Its extremum value is 0.625, and its corresponding sampling frequency is 40 KHz. The cylin-drical surface spectrum of the signal is illustrated in Fig. 8. At this moment, the demodulation will be very simple. In order to rotate the frequency spectrum an angle of 180°, the sequence only needs to be multiplied by 1 and −1
alternately. Then the low-pass filter should be used to deal with the signal. Because the shortest arc distance of the frequency band needed to be filtered is as big as 0.625, the design of the filter will be very easy.
5 Conclusions
As can be seen from the discussion above, the cylindrical surface spectrum reflects the periodicity of the digital spectrum more naturally and intuitively. Consequently, it becomes an effective and powerful tool in analyzing and designing the sampling and processing problems of the high-frequency signals. Obviously, they can help us form a clear and intuitive point of view about such problems.
The cylindrical surface spectrum can better reflect the existing operation of the digital signal processing such as demodulation and filtering more simply. Moreover, it can reflect the inner connection of all kinds of filtering charac-teristics more effectively.
With the help of MATLAB, the translucent cylindrical plotting becomes easy and workable, so it has the poten-tial for popularizing. In addition, the concept of the arc distance between the signal bands is very useful in the sampling rate determination and the filter design.
Funding
Research for this paper was funded by the Science and Technology Department of Sichuan Province (Project 2016JY0106) and the Education Department of Sichuan Province (Project 16ZA0209) of China.
Competing interests
The authors declare that they have no competing interests.
Received: 12 July 2016 Accepted: 28 November 2016
References
1. R Venkataramani, Y Bresler, Sub-Nyquist sampling of multiband signals: perfect reconstruction and bounds on aliasing error. Proceedings of IEEE Int. Conf. on Acoustics, Speech, and Signal Processing, ICASSP '98
3, 1633–1636 (1998)
2. R Venkataramani, Y Bresler, Perfect reconstruction formulas and bounds on aliasing error in sub-Nyquist nonuniform sampling of multiband signals. IEEE Trans. on Inform Theory46(6), 2173–2183 (2000)
3. DM Akos, M Stockmaster, JBY Tsui, J Caschera, Direct bandpass sampling of multiple distinct RF signals. IEEE Trans. on Communications47(7), 983–988 (1999)
4. M Mishali, YC Eldar, Blind multiband signal reconstruction: compressed sensing for analog signals. IEEE Trans. on Signal Processing57(3), 993–1009 (2009) 5. S Sen, VM Gadre,An Algorithm for Minimum Bandpass Sampling Frequency
for Multiple RF Signals in SDR System. IEEE/SP 13th Workshop on Statistical Signal Processing, 2005, pp. 327–332
6. JC Liu, Complex bandpass sampling and direct down conversion of multiband analytic signals. Signal Processing90(2), 504–512 (2010) 7. Q Wei, T Jin, F Yu, Effective frequency selection algorithm for bandpass
sampling of multiband RF signals based on relative frequency interval. 2010 International Conference on Computer Application and System Modeling, ICCASM’201010, 431–435 (2010)
8. JM Muñoz-Ferreras, R Gómez-García, F Pérez-Martínez, RF front-end concept and implementation for direct sampling of multiband signals. IEEE Trans. on Circuits and Systems—II: Express Briefs58(3), 129–133 (2011)
10. M. Cao, J. Li, F. Yin, Y. Dai, K. Xu,Digital coherent detection with bandpass sampling in multiband phase-modulated radio-over-fiber Links. 2014 13th International Conference on Optical Communications and Networks , ICOCN’2014, pp. 1-4, 9-10 (2014).
11. SN Elaydi,Oscillation Theory(Springer, New York, 1999)
12. AV Oppenheim, RW Schafer,Discrete-time signal processing(Prentice-Hall, Englewood, Cliffs, 1989)
13. SK Mitra,Digital Signal Processing, A computer-based approach(McGraw-Hill& Tsinghua University Press, Beiijng, 2001)
Submit your manuscript to a
journal and benefi t from:
7 Convenient online submission
7 Rigorous peer review
7 Immediate publication on acceptance
7 Open access: articles freely available online
7 High visibility within the fi eld
7 Retaining the copyright to your article