a
Corresponding author: [email protected]
The effect of the salinity level on conductivity sensor calibration
Caroline Le Bihana, Florence Salvetat, Nolwenn Lamandé, and Chantal Compère
IFREMER, Institut français de recherche pour l’exploitation de la mer, LDCM, Centre de Bretagne, Technopôle de Brest Iroise, 29280 Plouzané, France
Abstract.This paper presents a study on the calibration of conductivity sensors. The puropse is to demonstrate the effect of the salinity concentration on the response of conductivity sensor. Several experiments are performed on three sensors of different technologies: a Seabird Sbe37-SIP MicroCAT, a Falmouth Scientific Inc. IMCTD-MBP-D and a NKE Instrumentation Smatch. The analysis of the results shows an overall impact of the salinity level on the sensor response. This effect is discussed regarding the oceanographic requirements.
1 Introduction
In the field of oceanography, salinity measurements have been performed for more than fifty years. Salinity, or Absolute Salinity, as it is also called, is traditionally defined as the mass fraction of dissolved material in seawater. This seemingly simple definition has led to numerous measuring approaches depending on what dissolved material is considered. That is why, over the years, different salinity variables have been proposed.
In 1978, Absolute Salinity was considered as impossible to measure directly1, therefore, the Practical Salinity scale was adopted [1]: it defined the practical salinity “in terms of the ratio K15 of the electrical conductivity of a seawater sample at a temperature of 15°C2 and a pressure of one atmosphere, to that of a potassium chloride solution (KCl) in which the mass fraction of KCl is 32.4356×10⁻³ at the same temperature and pressure”. Thus, salinity measurement was based on conductivity measures and, to collect in situ salinity data, a wide range of sensors based on conductivity measurement has been proposed by manufacturers.
In 2010, the participants of the SCOR/IAPSO Working Group 127 chose to come back to the use of Absolute Salinity [2]: “Absolute Salinity is preferred over Practical Salinity because the thermodynamic properties of seawater are directly influenced by the mass of dissolved constituents whereas Practical Salinity depends only on conductivity”. Furthermore, “Absolute Salinity is expressed in SI units and it includes the influence of the small spatial variations of seawater composition in the global ocean”.
1 Definition of the Practical Salinity Scale, 1978 p. 14 of
[1]
Still, as there is no easy direct way to measure Absolute Salinity at the moment, conductivity measurements remain the main technology to obtain salinity measurements. It is also recommended in order to ensure the comparability of measurement in oceanographic data bases.
To assure the quality of the data collected by conductivity sensors, their calibration is compulsory. Most of the metrology laboratories calibrate these conductivity sensors in natural or artificial seawater bathes regulated by temperature. By changing temperature, the conductivity of the seawater changes, thereby, obtaining different levels of conductivity.
At Ifremer, all laboratories are provided with natural seawater pumped directly from the ocean which allows us to carry out calibrations with natural seawater that have been diluted with fresh water to achieve different levels of salinity. By doing so, we not only obtain conductivity calibrations at different temperatures but also at different levels of salinity; however, this is an unusual way to proceed. This specific protocol has been performed for more than twenty years now, and it proves that the trueness of conductivity sensors is affected by the salinity level of the water. Indeed, the adjustment of a conductivity sensor can be significantly different depending on the salinity of the surrounding water.
In this document, we will illustrate our findings from a specific study carried out on a Seabird Sbe37-SIP MicroCAT conductivity-Temperature-Depth (CTD) probe, a Falmouth Scientific Inc. (FSI) IMCTD-MBP-D and a NKE Instrumentation Smatch CTD. These three probes with three different technologies were calibrated at the same time in a same bench at different levels of salinity in order to highlight any influence.
2 On the International Practical Temperature Scale of
We are therefore going to present: - the facilities of the laboratory
- the three probes, their technology and manufacturer specifications,
- the protocol carried out,
- the results obtained and the analysis of the experiment.
2 Ifremer metrology laboratory facilities
For more than twenty years, the metrology laboratory of Ifremer has been performing calibrations on several oceanographic parameters: temperature, pressure, conductivity/salinity, dissolved oxygen, celerity, turbidity, fluorescence and current.
The policy of Ifremer is to work under the standards of accreditation, when possible, and to develop new accreditation fields when none are available.
Thus, our laboratory is COFRAC3 accredited for the calibration of two parameters:
- Temperature (Range: -1.5°C to 40°C) - Pressure (Range: 0.1MPa to 80MPa)
And we are currently developing a new field for dissolved oxygen calibration.
This quest for quality excellence leads us to use high quality reference instruments and methods.
For the present study, we operated:
- a high stability temperature calibration bath,
- a low uncertainty reference temperature measuring chain,
- and a high quality reference salinometer.
2.1 Temperature calibration bath
The temperature calibration bath is a Hart Scientific model 7015. Its volume is 95 liters (W x H x L = 70 x 30 x 33 cm).
Figure 1: Hart Scientific 7015 temperature calibration bath
This bath can be filled with seawater or freshwater. Its homogeneity and its stability are respectively better than 0.005°C and 0.001°C.
2.2 Reference temperature measuring chain
The reference temperature measurements are made with a 162CE Rosemount 25 ohms Standard Platinum Resistance Thermometer (SPRT) associated to a Measurement
3 Comité Français d’Accréditation. Calibration
accreditation no.2-1192 and 2-1212. “Scopakene available
International 6010B Direct Current Comparator Resistance Bridge and a 9330 10Ω Guildline Standard Resistor.
Figure 2: Rosemount 162CE 25 ohms SPRT
Figure 3: Measurement International 6010B bridge
Figure 4: Guildline 9330 Standard resistor
The measurement uncertainty of this temperature chain is ± 0.003°C.
2.3 Reference salinometer
Figure 5: Guildline 8400B Autosal Salinometer
2.1.1 Measuring principle
Figure 6: Guildline Salinometer Flow Diagram
2.1.2 Calibration
The Autosal is adjusted with IAPSO4 standard seawater. Although these standards are not traceable to SI5, they have been considered for years by the oceanographic community as the most reliable standards available. Today, they are worldwide recognized standards.
The adjustment is performed with “normal standard” seawater (P-Series) which salinity is about 35 and controlled with “Low salinity” seawater (10L-Series) which salinity is about 10.
2.1.3 Interlaboratory comparison
As there is no effective way to trace conductivity/salinity measurements for oceanographic range, our laboratory participated in 2008 [3] and in 2012 at a european interlaboratory comparison conducted by the PTB6. The last one was proposed in the framework of the EMRP7 Joint Research Project ENV05: Metrology for ocean salinity and acidity. One of the objectives of this project is to work on the traceability of conductivity/salinity measurements. The results showed that our measurements agreed with the other participants over the range 10 to 43mS/cm (En scores < 1). The estimated uncertainty of our conductivity measurement is ±0.003mS/cm.
3
The probes tested
In order to improve the study, three CTD probes of different technologies are tested:
- a Seabird SBE37-SIP MicroCAT - a FSI IMCTD-MBP-D
- a NKE Instrumentation Smatch CTD
4 International Association for Physical Sciences of the Ocean
5 International System of units
3.1. Seabird SBE37-SIP MicroCAT probe
3.1.1 Conductivity specifications
Figure 7: Seabird SBE37-SIP MicroCAT probe
Range: 0 to 70mS/cm Accuracy: ± 0.003mS/cm Resolution: 0.0001mS/cm
3.1.2 Measuring principle
The Seabird conductivity sensor is a three electrodes cell.
Figure 8: Diagram of Seabird conductivity sensor
The first and the third electrodes are connected in order to cancel any difference of potential between them. This system prevents from external current fields, therefore making the cell indifferent to the surroundings.
3.2 FSI
3.2.1 Conductivity specifications
Figure 9: FSI IMCTD-MBP-D probe
Range: 0 to 70mS/cm Accuracy: ± 0.005mS/cm Resolution: 0.0001mS/cm
3.2.2 Measuring principle
This sensor uses an inductive cell to measure conductivity.
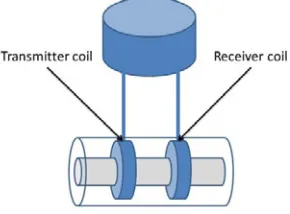
Figure 10: Diagram of FSI IMCTD-MBP-D conductivity sensor
An electrical current goes through the transmitter coil which generates an electromagnetic field. This field induces the motion of the ions of the water thus creating a current which is measured with the receiver coil.
This technology presents one disadvantage: the magnetic field generated by the transmitter coil is also external to the sensor and all nearby objects can affect it. This means that the response of the sensor is affected by the surroundings of the sensor.
3.3 NKE
3.3.1 Conductivity specifications
Figure 11: NKE Instrumentation Smatch CTD
Range: 0 to 70mS/cm Accuracy: ± 0.050mS/cm Resolution: 0.0012mS/cm
3.3.2 Measuring principle
This probe uses a four electrodes cell to measure conductivity.
Figure 12: Diagram ofNKE conductivity sensor
A current is applied on the two external rings to create a constant difference of potential in the two inside rings. As current is negligible, the electrodes are not polarized and the conductivity is directly proportional to the current imposed.
4 Protocol
The protocol is similar to the one commonly performed to calibrate sensors at Ifremer metrology laboratory.
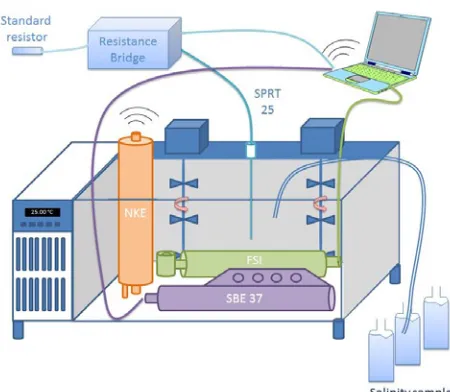
All sensors are totally immersed in the bath except for the NKE probe which requires its top part to be emerged to communicate and to recover data. They are calibrated simultaneously.
Figure 13: Diagram of the experiment
The aim of this study is to examine the effect of salinity on the response of conductivity sensor with the objective to know whether protocols for conductivity sensor calibration should include calibration at different levels of salinity or not. That is why all sensors measurements are compared to reference measurements made by the Autosal: we calculate for each conductivity sensor its correction, which is the reference conductivity minus the sensor conductivity. As Autosal only performs conductivity ratio measurements at a stable temperature (in our case 20.992°C), the reference conductivity is calculated using the equations given by the Unesco technical papers in marine science [4]:
- With the Autosal, we measure the conductivity ratio of the salinity samples of the bath.
- From the conductivity ratio and the temperature of the Autosal, we calculate the reference salinity of the bath.
- From this reference salinity and the reference temperature of the bath, we calculate the reference conductivity of the bath.
As we know, water at a precise salinity and a precise temperature develops conductivity properties, which means that conductivity is the resultant of different salinity and temperature conditions. Our experiment implies to compare the responses of a sensor subjected to similar conductivities produced with different conditions of salinity and temperature. To reproduce similar conductivities with the temperature range of the bath, we limit the experiment to a range of conductivity going from 17mS/cm to 32mS/cm. The following chart illustrates this:
Table 1: Plan of the experiment
In other words, five calibrations of the same sensor are performed at five salinity levels (from salinity 10 to salinity 35): for each salinity, we calibrate the sensor at several temperatures to cover a range of conductivity going from 17mS/cm to 32mS/cm and get the correction curve for each salinity.
The dilutions of seawater are made by adding fresh water.
For each point of measurement, the probes and the reference temperature chain are recorded simultaneously for a duration of 20 minutes minimum. In case of bubbles, the probes are shacken and a new recording is executed. After these measurements, we sample three bottles of water.
5 Results
The calibration results for the Seabird and the NKE CTD are summarized respectively on Figure 14 and Figure 17. Due to troubles of communication, the FSI probe was removed and replaced during the experiment, thus, making the results unusable.
For each graph, the correction to apply to the conductivity sensor is plotted as a function of the reference conductivity.
The graphs present:
- the corrections of the conductivity sensor for several salinities,
- the least square regression lines for each salinity.
5.1.1 Seabird Sbe37-SIP MicroCAT results
Rough Salinity Temperature (°C) Aimed conductivity (mS/cm)
10 30
14 10
17 5
10 35
14 15
17 10
24 0
10 40
14 20
17 15
24 5
14 25
17 20
24 10
14 30
17 25
24 15
35 0
17 30
24 20
35 5
28
33 18
20
22
Figure 14: Sbe37-SIP MicroCAT results in natural seawater
The results show that, for each salinity, we have a different curve of correction.
The points at salinity 35 and salinity 10 don’t follow the same trend as the other salinities:
- For salinity 35, the issue comes from the low limit of temperature of the bath: only two points could be performed, the linear fit is not reliable.
- For salinity 10, the difficulty comes from the high temperature of the bath needed to reach these values of conductivity: at 30°C, 35°C and 40°C, water evaporates thus increasing salinity and conductivity. This drift of conductivity is recorded by the probes, making it difficult to perform reliable measurements.
However, the same calibration was performed in 2011 on the same probe. As we can see in Figure 15, this experiment led to the same kind of results.
Figure 15: Sbe37 results in natural seawater in 2011
Although the corrections were different, we obtained the same trends. This first experiment carried out in 2011 also indicates that, even with an adjusted sensor (we can
In order to highlight a possible influence of temperature on the response of the sensor, we plot the results of our current experiment for each temperature (Figure 16).
Figure 16: Sbe37 results in natural seawater plotted for each temperature
The graph does not reveal any clear effect of temperature on corrections. There is of course a general trend indicating that the higher temperature, the higher the conductivity correction is (except for 35°C and 40°C), but this trend can be due to salinity as well (when temperature increases we decrease salinity to stay at the same conductivity).
Finally, in our current experiment, the greatest discrepancy measured between the curves is 0.007mS/cm for the Sbe37 sensor; its accuracy is supposed to be around 0.003mS/cm. This observation means that calibration protocol may include several temperatures calibration.
5.1.2 NKE Smatch CTD results
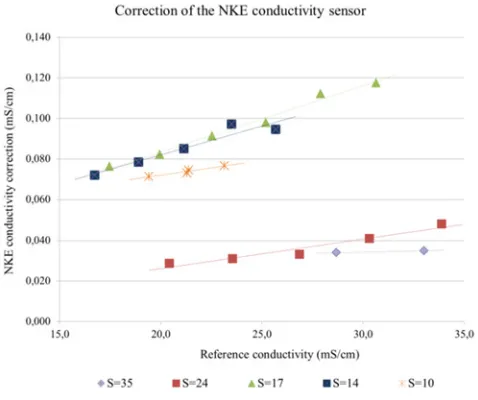
Figure 17: NKE Smatch CTD results in natural seawater
first behaviour for salinity around 17 or less, and a second behaviour for salinity around 24 or more.
Although the accuracy of the sensor given by the manufacturer is quite large (± 0.050mS/cm), it might not explain the discrepancy between the corrections at different salinity that can reach 0.080mS/cm.
6 Discussions
6.1 Results analysis
For the Seabird and NKE probes, the results showed that the largest discrepancy obtained between calibrations at different salinities exceed the manufacturer specifications. However, generally, the discrepancies are in the same order as the specifications.
Even though the tests were performed only once or twice and just on one specimen of each sensor, all the tests indicated this salinity effect. This observation reinforces the confidence in the results of the study. Nevertheless, repeatability tests should be performed on batches of freshly calibrated sensors, in order to strengthen the study.
6.2 Reference measurement
All the study is based on reference measurement performed with a salinometer. We did not discuss its role in the results of this study.
Indeed, this salinometer performs the conductivity measurement with a four electrodes cell that can also be affected by the salinity level (like the other probes). However, if the effect observed came only from the salinometer, all the graphs should present the same discrepancy between corrections at different salinities. One way to solve this question would be to perform reference practical salinity measurement by weighing salts or even better to know the exact composition of the solution and to deduce reference conductivity. Unfortunately, this cannot be carried out for the kind of volumes used to calibrate oceanographic probes (100 liters).
6.3 Investigation of the salinity effect
This document focuses on the observations made at Ifremer when calibrating conductivity sensors. It doesn’t explain the origin of the phenomenon observed. However, we have started to investigate different hypotheses.
One of them is that, due to the high quantity of salts in seawater, the mobility (and so the conductivity) of the ions species could be obstructed more or less depending on the design of the sensor. An experiment with a solution made of a unique type of salt (NaCl) was performed to test this theory, but it couldn’t be fully explored due to the difficulty to find valid equations to link conductivity to salinity and temperature for pure salt solutions. However, we plan to follow up this lead furthermore.
Another possibility that will be investigated is about the accuracy of the PSS78 equations to calculate the reference conductivity measurements from which all our deductions
are made ([1] and [2]). Indeed, salinity residuals up to 0.002 were determined when the PSS78 was approved [5].
7 Conclusions and perspectives
The results of this study show that the calibration curves of conductivity sensors are dependent on the salinity level of the seawater for two different technologies of conductivity sensors.
Even though this study needs to be strengthen with repeatability testing (especially on batches of sensors), the reported observations make it clear that conductivity calibration protocols have to be reviewed and improved.
Still, this dependence is not yet fully explained and will need further investigation (ions species mobility, PSS78 equations).
Finally, from a metrological point of view, we have to keep in mind that the discrepancies obtained between the different calibration curves are not so large compared to the whole calibration uncertainty (U § ± 0.004 mS/cm) and could be interpreted as insignificant. However, the real needs for the oceanographic field are to perform measurements with uncertainties around ± 0.001mS/cm. In that case, the phenomenon raised by our study can be critical.
References
1. UNESCO, ICES, SCOR, IAPSO Tenth report of the joint panel on oceanographic tables and standards, Unesco Technical papers in marine science, 36 (1981)
2. IOC, SCOR and IAPSO, 2010: The international thermodynamic equation of seawater – 2010: Calculation and use of thermodynamic properties. Intergovernmental Oceanographic Commission, Manuals and Guides No. 56, UNESCO (English), 196 pp.
3. S. Seitz , P. Spitzer and R. J. C. Brown, CCQM-P111 study on traceable determination of practical salinity and mass fraction of major seawater components, Accreditation and Quality Assurance, 15, pp. 9-17 (2010)
4. UNESCO, ICES, SCOR, IAPSO Algorithms for computation of fundamental properties of seawater, Unesco Technical papers in marine science, 44 (1983)
5. UNESCO, ICES, SCOR, IAPSO Background papers and supporting data on the Practical Salinity Scale 1978, Unesco Technical papers in marine science, 37 (1981)
Acknowledgements
The authors would like to thank Emmanuel Rinnert and Morgan Tardivel from Ifremer for respectively their assistance in the analysis of chemical issues and in the reviewing of the paper.