IJEDR1602199
International Journal of Engineering Development and Research (www.ijedr.org)1136
Optimization of Multi-pass Turning Parameters to
improve Surface Roughness of EN8 (080M40) by
Response Optimizer
1
Amey S. Kulkarni,
2Mukund V. Kavade,
3Gunaji A. Sawant
1Assistant Professor, 2Professor, 3Lecturer1, 2, 3 Mechanical Engineering Department
1,3Finolex Academy of Management & Technology, Ratnagiri, India. 2Rajarambapu Institute of technology, Sangli, India.
Abstract- This paper elaborates about optimization of multi-pass turning process parameters by using design of experiment tool viz. response surface methodology. Three process parameters that are cutting speed, feed and depth of cut are taken into account for the optimization procedure wherein intended to minimize the surface roughness.Multi-pass turning, where multiple passes are used for rough turning operation and single pass is used for finishing operation.
Keywords— Response Surface Methodology, Multi-pass Turning, Optimization, Response Optimizer, EN8, SR.
I.INTRODUCTION
The machining processes are commonly used in industries to produce components with high quality and also having cost effectiveness. Also these components not only have simple operations but also varying complex geometry. So to select appropriate combination of process parameters is important key to achieve quality as well as low cost. Single pass turning operations doesn’t allow us to optimize the rough cut and finish cut independently so that multi-pass turning operations has advantage over single pass turning operation.
Suleyman Neseli et. al. [1] focuses on the influence of tool geometry on the surface finish obtained in turning of AISI 1040 steel. In order to find out the effect of tool geometry parameters on the surface roughness during turning, response surface methodology (RSM) was used and a prediction model was developed related to average surface roughness (Ra) using experimental data.
Makadia and Nanavati [2] used design of experiments to study the effect of the main turning parameters such as feed rate, tool nose radius, cutting speed and depth of cut on the surface roughness of AISI 410 steel.
Naga Phani Sastry et al. [3] set the three levels of the feed, three levels of speed, three values of the depth of cut, two different types of work materials and have been used to generate a total 20 readings in a single set. After having the data from the experiments, the performance measures surface roughness (Ra) of the test samples was taken on a profilometer and MRR is calculated using the existing formulae.
Gowd et. al. [4] applied the Response Surface Methodology (RSM) to accurately predict the mathematical models to estimate feed force, thrust force, cutting force and surface roughness on Inconel 600.
II.RESPONSE SURFACE METHODOLOGY
Response surface methodology (RSM) [1] is the strategy of doing experiments in order to optimize the target response, for which it uses the statistical and mathematical techniques. The relation between input and output response is postulated in low degree polynomial as
𝑦 = 𝑓(𝑥1, 𝑥2) + 𝜀
Where 𝜀 is error or noise.
Here, we used the central composite design (CCD) which comprises 23 factorial designs wherein 𝛼 value kept as 1.633 to get rotatability feature of CCD. The value of 𝛼 is selected such that CCD should not be in face centred because these designs are not rotatable.
III.METHODOLOGY
IJEDR1602199
International Journal of Engineering Development and Research (www.ijedr.org)1137
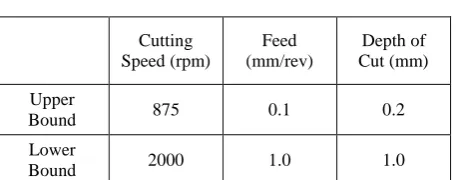
Table І: Cutting Data
Cutting Speed (rpm)
Feed (mm/rev)
Depth of Cut (mm)
Upper
Bound 875 0.1 0.2
Lower
Bound 2000 1.0 1.0
Specimen material chosen was EN8 (080M40) because of wide application for industrial purpose. It is in round bar shape of having 40mm diameter. But 39mm was taken and 1mm relaxed for oxidation layer, stains etc. Machining was done by TNMG Cutting tool with nose radius 0.8mm. Machining was carried out on CNC Turning Centre consequently the experiments as specified in table II.
IV.OBJECTIVE FUNCTION
Here, area of interest is mainly on minimizing the Ra (𝜇𝑚)value of surface roughness and maximizing the material removal rate (MRR) (mm3/min.) in order to get high quality surface finish with higher MRR.
A. Surface roughness
This response is largely influenced by feed rate and tool nose radius and related by
𝑅𝑚𝑎𝑥 =
0.0321𝑓2 𝑟
Where, 𝑅𝑚𝑎𝑥 = maximum height of profile r = Tool nose radius
Beside of above two parameters, cutting speed and depth of cut also take part in influencing the surface roughness value. Here, we kept the tool nose radius as constant parameter value.
B. Material removal rate
The aim of any turning experiment is maximizing MRR and to achieve that it is necessary to obtain optimal combination of cutting speed, feed and depth of cut. MRR is function of above said parameters and related as
MRR= v × f × d in mm3/min, Where, v = cutting speed
f = feed and d = depth of cut
V. RESULTS AND DISCUSSIONS
Second order model is used for analysis in respect to effect of input variables on output variables because second order model uses a quadratic term which helps to get curvature of output response. Results generated by Minitab 16 software are discussed and interpreted in this paper. Contour plots and surface plots are drawn by using mentioned software are presented and interpreted in successive pages.
IJEDR1602199
International Journal of Engineering Development and Research (www.ijedr.org)1138
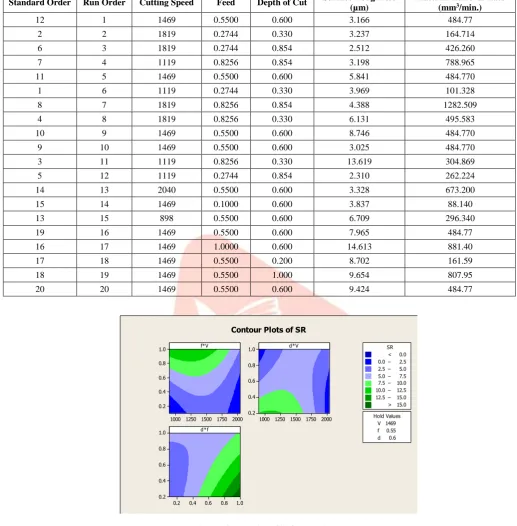
Table II: Run order of experiment and their responses
Standard Order Run Order Cutting Speed Feed Depth of Cut Surface Roughness (µm)
Material Removal Rate (mm3/min.)
12 1 1469 0.5500 0.600 3.166 484.77
2 2 1819 0.2744 0.330 3.237 164.714
6 3 1819 0.2744 0.854 2.512 426.260
7 4 1119 0.8256 0.854 3.198 788.965
11 5 1469 0.5500 0.600 5.841 484.770
1 6 1119 0.2744 0.330 3.969 101.328
8 7 1819 0.8256 0.854 4.388 1282.509
4 8 1819 0.8256 0.330 6.131 495.583
10 9 1469 0.5500 0.600 8.746 484.770
9 10 1469 0.5500 0.600 3.025 484.770
3 11 1119 0.8256 0.330 13.619 304.869
5 12 1119 0.2744 0.854 2.310 262.224
14 13 2040 0.5500 0.600 3.328 673.200
15 14 1469 0.1000 0.600 3.837 88.140
13 15 898 0.5500 0.600 6.709 296.340
19 16 1469 0.5500 0.600 7.965 484.77
16 17 1469 1.0000 0.600 14.613 881.40
17 18 1469 0.5500 0.200 8.702 161.59
18 19 1469 0.5500 1.000 9.654 807.95
20 20 1469 0.5500 0.600 9.424 484.77
Figure I: Contour plots of Surface Roughness
f*V
2000 1750 1500 1250 1000 1.0
0.8
0.6
0.4
0.2
d*V
2000 1750 1500 1250 1000 1.0
0.8
0.6
0.4
0.2
d*f
1.0 0.8 0.6 0.4 0.2 1.0
0.8
0.6
0.4
0.2
V 1469 f 0.55 d 0.6 Hold Values
> – – – – – – < 0.0 0.0 2.5 2.5 5.0 5.0 7.5 7.5 10.0 10.0 12.5 12.5 15.0 15.0 SR
IJEDR1602199
International Journal of Engineering Development and Research (www.ijedr.org)1139
Figure II: Contour plots of Material Removal Rate (MRR)
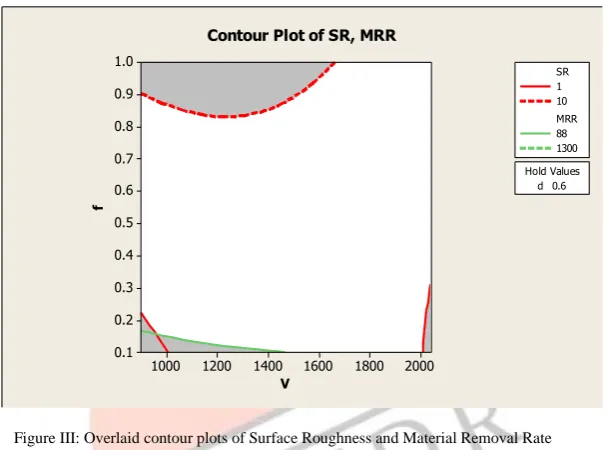
Figure III: Overlaid contour plots of Surface Roughness and Material Removal Rate
Blue coloured region on feed vs. Cutting speed plot and on depth of cut vs. Cutting speed plot gives the optimal combination of variables which denotes that feed in range of 0.1 to 0.35 mm/rev. At cutting speed in range of 875 to 1200 rpm attains optimal solution. On another graph of depth of cut vs. cutting speed gave out optimal solution ranging where depths of cut get from 082 to 1mm and where cutting speed 1950 to 2000rpm. Surface plot clears it by plotting 3 dimensional graph showing dipping surface gives lower surface roughness.(Not included in this paper). So by setting values between this regions gave the output in terms of best surface finish.
A contour plot in of MRR (figure II) denotes that we can surely get higher MRR by keeping all parameter values at higher levels. Green shades are self-explanatory about setting the combination suitable to get higher MRR in case of rough cuts.
Overlaid contour plot (figure III) of surface roughness and material removal rate is drawn so that it will give idea about to maintain parameter values in white region in order to get best response.
Figure IV: Plot by response optimizer
f*V 2000 1750 1500 1250 1000 1.0 0.8 0.6 0.4 0.2 d*V 2000 1750 1500 1250 1000 1.0 0.8 0.6 0.4 0.2 d*f 1.0 0.8 0.6 0.4 0.2 1.0 0.8 0.6 0.4 0.2 V 1469 f 0.55 d 0.6 Hold Values > – – – – – – < 200
200 400 400 600 600 800 800 1000 1000 1200 1200 1400 1400 MRR
Contour Plots of MRR
V f 2000 1800 1600 1400 1200 1000 1.0 0.9 0.8 0.7 0.6 0.5 0.4 0.3 0.2 0.1 d 0.6 Hold Values 1 10 SR 88 1300 MRR
IJEDR1602199
International Journal of Engineering Development and Research (www.ijedr.org)1140
Response optimizer tool in Minitab software generated the plot to get variables at optimal combination and the same self-explained in figure IV.VI. CONCLUSION
All discussed points above are concluded in the manner that the three parameters; cutting speed, feed and depth of cut values must be different for rough cut operation and finish cut operation. But here we defined the variable levels for improving Surface Roughness and MRR was not optimized. Hence according to desired response to obtain best results we may set the target for any response to optimize another response variable and same is achieved by using response optimizer
Table III: Optimized input variables
Variable Setting
v 2040
f 0.10
d 0.20
REFERENCES
[1] Suleyman Neseli, Suleyman Yaldız, Erol Turkes (2011) Optimization of tool geometry parameters for turning operations based on the response surface methodology, Measurement 44, 580–587
[2] Ashvin J. Makadia, J.I. Nanavati (2013) Optimisation of machining parameters for turning operations based on response surface methodology, Measurement 46, 1521–1529.
[3] Dr. M. Naga Phani Sastry, K. Devaki Devi, Dr, K. Madhava Reddy (2012) Analysis and Optimization of Machining Process Parameters Using Design of Experiments, Industrial Engineering Letters, 2(9), 23-32.
[4] Dr. G.Harinath Gowd, M. Gunasekhar Reddy, Bathina Sreenivasulu (2012) Empirical modeling of Hard Turning process of Inconelusing Response Surface Methodology, International Journal of Emerging Technology and Advanced Engineering, 2(10), 498-504.