1
All Things Being Equal: Spatiotemporal Differences between Open and
1
Women’s 16-Goal Polo
2
3
Authors: 4
Russ Best1,2*
5
Regan Standing1
6
1. Centre for Sports Science and Human Performance, Wintec, Hamilton, New Zealand
7
2. School of Health and Social Care, Teesside University, Middlesbrough, United Kingdom
8
*Correspondence: [email protected]
9 10
Key words: 11
Polo, Equestrian, GPS, Horse welfare, Horse management
12
Word count: 3973
13
Funding: No funding was received for the preparation of this manuscript.
14
Competing interests: The authors have no competing or conflicts of interest to declare.
15
Ethical statement: This research was carried out with owner informed consent and in accordance
16
with ethical animal research guidelines (International Guiding Principles for Biomedical Research
17
Involving Animals). Ethical approval for this investigation was provided by Waikato Institute of
18
Technology’s (Wintec) ethics committee (Approval code: WTFE2601102018).
19
Acknowledgements: The authors would like to thank Lucy Ainsley and Nina Clarkin for
20
facilitating this research.
21
Data Accessibility: An anonymised dataset used in this study can be found online at:
22
https://doi.org/10.3390/data4030095
23 24
2 Summary
25
Polo is an equestrian team sport, consisting of Open and Women’s only handicapping systems. As
26
cumulative player handicap increases in Open Polo, distance covered, average speeds and high
27
intensity work performed per chukka also increase. These activities may differ in terms of
28
distribution of, and their affect upon, match outcome in Women’s Polo, and thus have implications
29
for equine preparation and management.
30
To quantify spatiotemporal differences between Open and Women’s Polo when matched for
31
handicap and assess their affect upon chukka and match outcome using a prospective cohort
32
design. Distance, speed and high intensity activity data were collected via player worn global
33
positioning system (GPS) units during 16-goal Open and Women’s Polo tournaments. Notational
34
analysis quantified chukka duration and chukka and game outcomes. Between group differences
35
were assessed by independent samples t-tests, and two factor mixed effects ANOVA for within
36
group analyses. Between group differences were analysed using an independent samples t-test with
37
alpha defined a priori as p<0.05.
38
Open and Women’s Polo differed by a small to large extent (ES: 0.54 – 1.81) for all spatiotemporal
39
metrics. In Open Polo, players covered moderately more distance (429.0m; 238.9m to 619.0m),
40
with small to large increases in high intensity activities performed in games won. Whereas in
41
Women’s Polo, moderately higher maximum speeds were attained in games won (17.13 km/h;
42
11.86 km/h to 22.40 km/h) and a small increase in accelerations performed (5.1; 0.2 to 10.0).
43
Open and Women’s Polo, when matched for handicap, present with small to large spatiotemporal
44
differences that are likely of practical significance, and influence game outcome differently
45
between codes. These differences do not necessarily mean that Polo ponies need to be trained
46
differently for each code.
3 Introduction
49
Polo is an equestrian team sport contested by two teams of four players. Play is divided into
seven-50
minute chukkas, and a player must change horses between chukkas, to ensure adequate equine
51
physiological recovery [1-3]. Individual handicaps are awarded from –2 to +10 goals, with level
52
of play dictated by the cumulative handicap of each member of a team [3,4]. Female players can
53
hold parallel Open and Women’s handicaps, despite being scored on the same variables these
54
handicaps are weighted differently e.g. a female player may be an Open 4-goal player, but
10-55
goals in Women’s Polo. The reason for implementing a parallel system is to account for
56
compression brought about by increased participation in women’s Polo internationally [5]. This
57
allows for greater differentiation between female players, with a similar Open handicap, with
58
Women’s handicaps usually higher than an equivalent open handicap [6].
59
Previously, we have shown increases in average speed attained and distance covered per chukka
60
[7] as cumulative handicap increases in Open Polo; cumulative handicap may also affect high
61
intensity activities [7], imposing additional internal physiological loads upon horses and players
62
[8-12]. Thus, an understanding of the equine demands of Women’s Polo is required. At present
63
these demands are unknown and there may be important points of difference to Open Polo, that
64
may affect equine preparation for Polo participation, and in game horse management strategies.
65
Hence, the aim of this study is to explore the differences in spatiotemporal characteristics between
66
handicap-matched levels of Open and Women’s Polo, and to quantify the relationship between
67
spatiotemporal characteristics and match outcomes in Open and Women’s Polo.
4 Methods
69
All data collection took place over the 2018-2019 New Zealand Polo season, specifically at two
70
16-goal tournaments; one open and one women’s tournament, employing a cross sectional design.
71
Handicaps were as awarded by the New Zealand Polo Association. Women’s equivalent Open
72
handicaps were sourced from the New Zealand, Australian and Hurlingham Polo Associations.
73
Ethical approval for this investigation was provided by Waikato Institute of Technology’s
74
(Wintec) ethics committee (Approval code: WTFE2601102018), and as per the International
75
Guiding Principles for Biomedical Research Involving Animals as issued by the Council for the
76
International Organizations of Medical Sciences. Data for the present study are freely available
77
online [13].
78 79
Sample population
80
This study comprised observations from two distinct playing groups: two open teams and three
81
women’s teams – both groups played in the 16-goal sections of their respective tournaments. Open
82
participants consisted of eight Polo players (7 males and 1 female; Handicap range 0–7 goals),
83
whereas women’s participants consisted of 12 female Polo players (Handicap range 0–10 goals).
84
Handicaps of individual players are listed in Table 1. Prior to study involvement, informed consent
85
was obtained from players and owners.
86
Players selected their own strings of ponies, with ponies stabled either truck-side or in open air
87
yards prior to playing. Warm up and feeding protocols were at the players’ and grooms’ discretion.
88
Playing distribution and strategy of Polo ponies within a player’s string was also at the discretion
89
of each player.
5
Data collection procedures
92
Data were collected from a total of 258 chukkas across both Open and Women’s Polo tournaments
93
(n = 130 and n = 128, respectively; no a priori sample size calculations were performed but this
94
represents two entire tournaments across multiple teams) using player worn GPS monitors (VX
95
Sport) set to equestrian mode with a sampling frequency of 10 Hz and a speed range of 0 – 60
96
km/h. We have previously shown this method to produce reliable results for the metrics assessed
97
in the present investigation [10], when mounted either between the players’ shoulders or worn on
98
players’ belts.
99
GPS units were turned upon arrival at the playing venues to obtain an initial satellite lock and were
100
then turned on again 30 min prior to the start of games, to ensure a secure connection to multiple
101
satellites was established. All players opted to wear GPS units in a pouch fixed to their belts. The
102
belt pouch was secured with insulation tape to minimise oscillation of the unit during games. Upon
103
game completion, units were turned off and data downloaded using specialist software as provided
104
by the manufacturer (VX Sport). The initial satellite lock period was trimmed from the data, and
105
the game period was divided into chukkas as per an accompanying notational analysis to normalise
106
data for between and within groups analyses. Speed zones using in-built software thresholds were
107
derived as follows: Zone 1: 0–19.2 km/h; Zone 2: 19.2–23.4 km/h; Zone 3: 23.4–28.2 km/h; Zone
108
4: 28.2–47.4 km/h; and Zone 5: 47.4–60 km/h. Total distance (m), distance covered (m) in each
109
speed zone, the number of accelerations, decelerations, impacts and sprints were selected as
110
dependent variables from the GPS output (metrics defined as per [13]), with chukka duration
111
(min:s) reported from the notational analysis. Data were then exported to Microsoft Excel for
112
further analysis as detailed below. Players were provided with a brief data analysis and feedback
113
following each tournament.
6
Statistical Analyses
116
Data were considered normally distributed if they passed the mean and SD test (2xSD>mean), or
117
if the mean and median were within 10% of each other. Following these tests, homogeneity and
118
sphericity between group differences were analysed using an independent samples t-test with alpha
119
defined a priori as p<0.05. A two factor mixed effects ANOVA was used to assess the effect of
120
chukka (win/loss) and game outcomes (win/loss) upon spatiotemporal characteristics, at the same
121
alpha level. It should be noted that the absence of statistical significance does not signify lack of
122
practical importance, with respect to Polo performance. All analytical procedures were computed
123
using SPSS (v24). Effect sizes for between group comparisons (Cohen’s d) and accompanying
124
95% confidence intervals (C.I.) were calculated using a customised spreadsheet. Magnitudes of
125
effect were interpreted using the descriptors suggested by Hopkins et al., [14]. An effect was
126
deemed unclear if its confidence interval crossed zero and the threshold for a small effect [15]. For
127
within group comparisons (chukka and game win loss outcomes) data are reported as raw
128
differences between outcomes with accompanying 95% confidence intervals, effect sizes (Cohen’s
129
d) and magnitude-based descriptors.
7 Results
132
Significant differences between Open and Women’s Polo were found for all spatiotemporal
133
characteristics assessed, although these differences varied in terms of magnitude (Small to Very 134
Large); as presented in Table 2, with differences per speed zone between Open and Women’s play 135
shown in Figure 1. Significant results of two factor mixed effects ANOVAs are grouped by metrics
136
and reported for Open and Women’s play in the subsections below. Complete results can be found
137
in supplementary material Tables 1 and 2 for Open and Women’s Polo, respectively.
138 139
Distance metrics
140
There were large differences (ES: 1.54; 95% CI: 1.26 to 1.81) in total distance covered per chukka
141
between Open and Women’s Polo. Between groups differences for independent speed zones 1 – 5
142
are presented in Figure 1. In Open Polo, distance per chukka was significantly influenced by both
143
chukka (F (1,126) = 5.80; p = 0.018) and game (F (1,126) = 19.95; p < 0.001) outcomes, with
144
winning chukkas showing a small reduction in distance covered (-231.2m; -421.3m to -41.2m) but
145
moderately more distance covered in games won (429.0m; 238.9m to 619.0m). Whereas, in
146
women’s Polo neither chukka nor game outcome significantly affected total distance per chukka,
147
but there was a significant interaction between chukka and game outcome with respect to total
148
distance. More specifically, distance covered in speeds zones 1 (F (1,126) = 28.47; p < 0.001), 2
149
(F (1,126) = 4.29; p < 0.041) and 5 (F (1,126) = 5.18; p < 0.025) in Open Polo were significantly
150
affected by game outcome, whereas in Women’s Polo only distance covered in speed zone 4
151
showed a chukka by game interaction (F (1,124) = 2.01; p = 0.017).
152 153
Speed metrics
154
Absolute maximum speeds for Open and Women’s play were 61.5 and 59 km/h respectively, with
155
8
differences in average playing speed (p = 0.019; Table 2). Maximum speed data for each category
157
of play are shown in Figure 2 to demonstrate the distribution of maximal speeds between groups.
158
A small reduction in average speed (-1.37 km/h; -2.33 km/h to -0.40 km/h) was seen in winning
159
games in Open Polo (F (1,126) = 7.91; p = 0.006), whereas in Women’s Polo maximum speed was
160
moderately higher (17.13 km/h; 11.86 km/h to 22.40 km/h; F (1,124) = 41.40; p < 0.001).
161 162
High intensity metrics
163
Small to Large differences between Open and Women’s Polo were found for all high intensity
164
activities (all p ≤ 0.001; Table 2). Within Open Polo, more sprints (8.3; 5.9 to 10.7), accelerations 165
(7.6; 2.4 to 12.9) and decelerations (7.0; 2.0 to 11.9) were performed in games won (all p ≤ 0.006), 166
but their effect upon chukka outcome was unclear. Conversely, in Women’s Polo a small increase
167
in accelerations (5.1; 0.2 to 10.0) were performed in games won (p = 0.041). Despite differing
168
between groups (Table 2), the role of impacts in chukka or game outcome was either trivial or
169
unclear.
170 171
Duration 172
Chukka durations differed significantly (p < 0.001) between Open and Women’s Polo by a large 173
extent. In Open Polo, chukkas won were significantly (p = 0.017) shorter by a small extent (-01:06;
174
95% C.I. -02:00 to -00:11), despite games won being moderately longer than games lost (02:45;
175
01:51 to 03:39; p < 0.001). In Women’s Polo, however, the difference in duration between games 176
won and lost was small (00:40; 00:02 to 01:17; p = 0.037), with no statistically significant
177
difference between chukkas won or lost.
9 Discussion
180
This investigation aimed to assess the differences in spatiotemporal characteristics between
181
handicap-matched levels of Open and Women’s Polo. With a secondary aim of assessing the effect
182
of chukka and game outcome upon spatiotemporal characteristics in Open and Women’s Polo.
183
Between group comparisons (Table 2) showed statistically significant differences between Open
184
and Women’s Polo for all spatiotemporal characteristics (all p ≤ 0.001), with differences ranging 185
in magnitude from small to large. Of importance are the large differences in chukka duration
186
between groups and the nearly 700m discrepancy in total distance covered per chukka when
187
Women’s Polo is compared to Open play. Whilst distance covered only differed by a trivial extent
188
in games won and lost in Women’s Polo, distance covered was moderately greater in games won
189
(429.0; 238.9 to 619.0) and reported a significant chukka by game interaction (p = 0.049)
190
suggesting that covering more ground than one’s opponents in at least one chukka resulted in a
191
greater win rate. The same interaction effect is seen in Women’s Polo, but the magnitude of this
192
interaction is small, this is likely driven by the lesser distance covered per chukka in Women’s 193
Polo, and the bidirectional nature of confidence limits for chukka and game outcomes. The
194
implications of these findings upon Polo horse preparation and management during games are
195
explored throughout this discussion.
196
The differences in distance between groups are further emphasised by Figure 1. Women’s Polo
197
displays a U-like distribution with broad error bars especially in speed zone 4 (0–1622m), whereas
198
Open Polo represents an inverted-U with greater consistency within the velocities attained.
199
Practically, this indicates very different rhythms of play; Open Polo is characterised by a
200
maintenance of a cruising velocity with relatively little distance accumulated at low or near
201
maximal speeds. Most accelerations and decelerations may also occur within this speed zone,
202
hence its emphasis. High speeds are still consistently attained though (Figures 1 and 2), suggesting
203
these maximal efforts may take place with a shorter lead in (i.e. greater rates of acceleration) and
10
serve a different tactical purpose in comparison to Women’s Polo. Speed shows a more polarised
205
distribution (Fig.1) of a seemingly stochastic nature in Women’s Polo; accompanying error
206
margins (Fig.1 and 2) highlight that whilst players may be physically and technically proficient
207
[16], their ponies must also be physically conditioned to cope with a slow/fast playing style. Such
208
conditioning may take the form of high intensity interval training [13,17,18], although this has
209
been noted to be potentially injurious in thoroughbreds [18]. Injury may also occur in s if the
210
relationship between speed and limb force exceeds a critical limit during turns [19] but Polo ponies
211
typically display a greater tolerance to this and can turn in tighter circles than race horses [19].
212
Irrespective of the source, injury risk must be minimised by appropriate loading of ponies [20,21]
213
playing in either Open or Women’s Polo, due to the relatively high acceleration, deceleration and
214
sprint counts sustained per chukka (Table 2).
215
Maximum speeds significantly differed (p < 0.001) between groups (Large; 1.39; 1.22 to 1.69),
216
also showing markedly different distributions and ranges (Figure 2). Higher maximum speeds may
217
still be of practical or tactical importance in Women’s Polo despite higher speeds being attained
218
more frequently and consistently in Open Polo. Hence, training for both Open and Women’s Polo
219
should expose ponies to near maximal velocities, to ensure adequate speed capacity, condition
220
ponies to game demands and minimise the risk of injury [20,21]. By extension, Polo ponies should
221
also be conditioned to perform high intensity activities as more sprints, accelerations and
222
decelerations were performed in games won than in games lost, despite differing by a small to
223
large extent between Open and Women’s Polo (p ≤ 0.001). Indeed, such movements likely impact 224
upon the health of the horse’s lower limb, with tendon injuries frequently reported in Polo
225
[7,22]. Such injury is likely due to repetitive eccentric loading across multiple joints [23] brought
226
about by simultaneous braking and turning forces [24,25], attention should also be paid to the
227
speed at which these movements are trained [19] to minimise injury risk, regardless of code of
228
Polo played.
11
Collectively, these data support the use of a parallel handicap system for Women’s Polo due to
230
differences observed in distribution of playing speeds (Fig. 1), typical distances covered per
231
chukka (Table 2) and the greater variability within these characteristics (Fig.1 and 2). These
232
spatiotemporal differences are likely accompanied by differences in technical proficiency and
233
tactical behaviours, evidenced in part by differences in Open handicap (Table 1), which likely
234
contribute to chukka and game outcomes alongside the differences in spatiotemporal
235
characteristics identified in the present study. Concomitant measures of internal load such as horse
236
heart rate would also be of value in assessing the physiological consequences of distances covered
237
per speed zone. It is unclear whether spatiotemporal differences of the present magnitudes signify
238
a genuine need to prepare ponies differently for Open and Women’s Polo, or more likely that
239
ponies should be managed differently in games e.g. opting to half chukka ponies in Open Polo.
240
A possible limitation is that some of these differences may be perceived as occurring simply due
241
to differences in average chukka length. Whilst some influence cannot be ruled out, it is unlikely
242
the sole explanatory factor as the most likely explanation for longer chukkas would either be due
243
to the ball going out of play more frequently, conceding of more penalties by either team or injuries
244
sustained by a player or horse. These incidents all slow down Polo play, therefore fewer metres
245
are accrued in higher speed zones, so the differences between Open and Women’s play have
246
occurred in spite of longer chukka lengths in Open Polo. A further limitation of this study is the
247
use of player worn GPS, whilst this is the most feasible strategy for Polo due to multiple horse
248
changes [10], it means braking and turning forces cannot be calculated at the joint and thus our
249
work does not directly support that of Tan and Wilson [19] who calculated the forces experienced
250
by turning Polo ponies. However, due to the high volume of turning and braking movements
251
performed per chukka, and games played per season, we recommend prudent preparation of ponies
252
within a periodised Polo training programme that progressively exposes ponies to the intensities
253
and movement requirements of in-season play.
12
In conclusion, Open and Women’s Polo, when matched for their cumulative handicaps, present
255
with small to large spatiotemporal differences that may be of practical and statistical significance.
256
Within Polo codes, a greater number of variables were affected by game and chukka outcome in
257
Open Polo, whereas in Women’s Polo fewer variables were associated with chukka or game
258
outcome. A further point of difference was the distribution of distance covered within playing
259
speed zones (Figure 1) and maximal speeds attained (Figure 2). These differences, whilst likely of
260
practical importance on the Polo pitch and further influenced by players’ technical proficiency, do
261
not necessarily mean that Polo ponies need to be trained differently for each code. We recommend
262
the incorporation of sufficient aerobic development to cover between 2500 – 3000m per chukka,
263
and progressive exposure to high speeds and braking and turning forces during preparation for
264
Polo, irrespective of whether one is playing Open or Women’s Polo.
265 266
Manufacturers details: 267
SPSS: (v24, IBM, United States)
268
VX Sport: (350, Lower Hutt, New Zealand) 269
270
Supplementary legends: 271
Supplementary 1: Results of factorial ANOVA for Open Polo; Significant p values are presented
272
in bold. All raw differences are calculated as WIN-LOSS. Raw differences are not provided for
273
interaction effects. Magnitudes of effect sizes are denoted by the following symbols: *: Small; #
274
Moderate; †: Large; ‡: Very Large
275
Supplementary 2: Results of factorial ANOVA for Women's Polo; Significant p values are
276
presented in bold. All raw differences are calculated as WIN-LOSS. Raw differences are not
277
provided for interaction effects. Magnitudes of effect sizes are denoted by the following symbols:
278
*: Small; # Moderate; †: Large; ‡: Very Large
13 References
280
1. Fiander, A. and Williams, J. (2014) The Impact of Playing Strategies on Recovery in
281
Low‐Goal Polo‐Ponies. Equine Vet. J.46, 12–12.
282
2. Williams, J.M. and Fiander, A. (2014) The impact of full vs. half chukka playing
283
strategies on recovery in low goal polo ponies. Comparative Exercise Physiology 284
10, 139–145.
285
3. Hurlingham Polo Association (2018) Outdoor Rule and Regulations 2018,
286
Hurlingham Polo Association.
287
4. THE INTERNATIONAL RULES FOR POLO FEDERATION OF
288
INTERNATIONAL POLO (2013) THE INTERNATIONAL RULES FOR POLO
289
FEDERATION OF INTERNATIONAL POLO. 1–17.
290
5. Oliver, G.D., Gilmer, G.G., Barfield, J.W. and Brittain, A.R. (2019) Differences in
291
trunk and upper extremity kinematics and segmental velocities during the offside
292
forehand polo swing between male and female athletes. Journal of Sports Sciences 293
00, 1–7.
294
6. Hurlingham Polo Association Handicapping Explained. Hurlingham Polo 295
Association.
http://hpa-polo.co.uk/wp-content/uploads/2019/03/Handicapping-296
Explained.pdf. Accessed August 23, 2019.
297
7. Best, R. and Standing, R. (2019) The Spatiotemporal Characteristics of 0–24-298
Goal Polo. Animals9, 446.
299
8. Marlin, D.J. and Allen, J.C. (1999) Cardiovascular demands of competition on
low-300
goal (non-elite) polo ponies. Equine Vet. J.31, 378–382.
301
9. Zobba, R., Ardu, M., Niccolini, S., Cubeddu, F., Dimauro, C., Bonelli, P., Dedola,
302
C., Visco, S. and Pinna Parpaglia, M.L. (2011) Physical, Hematological, and
303
Biochemical Responses to Acute Intense Exercise in Polo Horses. Journal of Equine 304
Veterinary Science31, 542–548.
305
10. Best, R. and Standing, R. (2019) Feasibility of a Global Positioning System to
306
Assess the Spatiotemporal Characteristics of Polo Performance. Journal of Equine 307
Veterinary Science79, 59–62.
308
11. Gondin, M.R., Foz, N.S.B., Pereira, M.C., Flagliari, J.J., Orozco, C.A.G.,
309
D’Angelis, F.H.F., Queiroz-Neto, A. and Ferraz, G.C. (2013) Acute Phase
310
Responses of Different Positions of High-Goal (Elite) Polo Ponies. Journal of 311
Equine Veterinary Science33, 956–961.
312
12. Wright, L.R. and Peters, M.D. (2017) A heart rate analysis of the cardiovascular
313
demands of elite level competitive polo. International Journal of Performance 314
Analysis in Sport8, 76–81.
315
13. Best, R. and Standing, R. (2019) Distance, Speed and High Intensity Characteristics
316
of 0 to 24-Goal, Mixed and Women’s Polo. Data 2019, Vol. 4, Page 954, 95.
14
14. Hopkins, W.G., Marshall, S.W., Batterham, A.M. and Hanin, J. (2009) Progressive
318
Statistics for Studies in Sports Medicine and Exercise Science. Medicine & Science 319
in Sports & Exercise41, 3–13.
320
15. Batterham, A.M. and Hopkins, W.G. (2006) Making meaningful inferences about
321
magnitudes. Int J Sports Physiol Perform1, 50–57.
322
16. Standing, R. and Best, R. (2019) Strength and Reaction Time Capabilities of New
323
Zealand Polo Players and Their Association with Polo Playing Handicap. JFMK4,
324
48–9.
325
17. Eto, D., Yamano, S., Mukai, K., Sugiura, T., Nasu, T., Tokuriki, M. and Miyata, H.
326
(2004) Effect of high intensity training on anaerobic capacity of middle gluteal
327
muscle in Thoroughbred horses. Res. Vet. Sci.76, 139–144.
328
18. Birch, H.L., Wilson, A.M. and Goodship, A.E. (2008) Physical activity: does
long-329
term, high-intensity exercise in horses result in tendon degeneration? Journal of 330
Applied Physiology105, 1927–1933.
331
19. Tan, H. and Wilson, A.M. (2010) Grip and limb force limits to turning performance
332
in competition horses. Proc. R. Soc. B278, 2105–2111.
333
20. Castejon-Riber, C., Riber, C., Rubio, M.D., Agüera, E. and Muñoz, A. (2017)
334
Objectives, Principles, and Methods of Strength Training for Horses. Journal of 335
Equine Veterinary Science56, 93–103.
336
21. Carrier, T.K., Estberg, L., Stover, S.M., Gardner, I.A., Johnson, B.J., Read, D.H. and
337
Ardans, A.A. (1998) Association between long periods without high-speed workouts
338
and risk of complete humeral or pelvic fracture in thoroughbred racehorses: 54 cases
339
(1991-1994). J Am Vet Med Assoc212, 1582–1587.
340
22. Inness, C.M. and Morgan, K.L. (2015) Polo pony injuries: player-owner reported
341
risk, perception, mitigation and risk factors. Equine Vet. J.47, 422–427.
342
23. Butler, D., Valenchon, M., Annan, R., Whay, H.R. and Mullan, S. (2019) Living the
343
'Best Life' or “One Size Fits All-”Stakeholder Perceptions of Racehorse Welfare.
344
Animals9, 134.
345
24. Chateau, H., Camus, M., Holden-Douilly, L., Falala, S., Ravary, B., Vergari, C.,
346
Lepley, J., Denoix, J.-M., Pourcelot, P. and Crevier-Denoix, N. (2013) Kinetics of
347
the forelimb in horses circling on different ground surfaces at the trot. The 348
Veterinary Journal198, e20–e26.
349
25. Brocklehurst, C., Weller, R. and Pfau, T. (2014) Effect of turn direction on body
350
lean angle in the horse in trot and canter. The Veterinary Journal199, 258–262.
15
Table 1 Player Handicaps (goals) for Open and Women’s handicaps. Male Open players are not eligible for a
354
Women’s handicap but all female players have both an Open and Women’s handicap.
355
Team Player # Open handicap Women’s handicap
Open 1 1 0 N/A
2 4 10
3 5 N/A
4 7 N/A
Open 2 1 2 N/A
2 3 N/A
3 6 N/A
4 5 N/A
Women’s 1 1 -2 0
2 -1 0
3 1 5
4 4 10
Women’s 2 1 -1 1
2 0 3
3 1 5
4 1 6
Women’s 3 1 -1 1
2 0 2
3 0 3
4 2 10
16
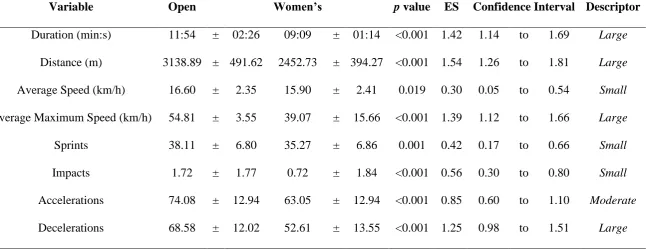
Table 2 Comparison between spatiotemporal characteristics of Open and Women's Polo. Raw values are
presented as means ± standard deviations, with accompanying p values, effect sizes and C.I. and magnitude
descriptors
Variable Open Women’s p value ES Confidence Interval Descriptor
Duration (min:s) 11:54 ± 02:26 09:09 ± 01:14 <0.001 1.42 1.14 to 1.69 Large
Distance (m) 3138.89 ± 491.62 2452.73 ± 394.27 <0.001 1.54 1.26 to 1.81 Large
Average Speed (km/h) 16.60 ± 2.35 15.90 ± 2.41 0.019 0.30 0.05 to 0.54 Small
Average Maximum Speed (km/h) 54.81 ± 3.55 39.07 ± 15.66 <0.001 1.39 1.12 to 1.66 Large
Sprints 38.11 ± 6.80 35.27 ± 6.86 0.001 0.42 0.17 to 0.66 Small
Impacts 1.72 ± 1.77 0.72 ± 1.84 <0.001 0.56 0.30 to 0.80 Small
Accelerations 74.08 ± 12.94 63.05 ± 12.94 <0.001 0.85 0.60 to 1.10 Moderate
17 Figure legends
Figure 1: Box and whisker plot showing the distribution of playing speeds (by speed zones) in
Open (green boxes) and Women’s Polo (purple boxes). Data are presented as medians (change of
colour tone) with first and third quartiles; error bars denote minimum and maximum values.
Magnitudes of effect sizes are denoted by the following symbols: *: Small; # Moderate; †: Large;
18
Figure 2: Maximum speeds attained in Open and Women’s Polo. Individual data points are