† Corresponding author
DOI: 10.18488/journal.aefr/2015.5.3/102.3.426.438 ISSN(e): 2222-6737/ISSN(p): 2305-2147 © 2015 AESS Publications. All Rights Reserved.
426
THRESHOLD EFFECTS IN THE RELATIONSHIPS OF REITS AND OTHER
FINANCIAL SECURITIES IN DEVELOPED COUNTRIES
Hui-Na Lin
1†--- Wo-Chiang Lee
21Associate Professor, Department of Finance, Chihlee Institute of Technology, , New Taipei City, Taiwan, R.O.C 2Professor, Department of Banking and Finance, Tamkang University, Tamsui, Taipei County, Taiwan, ROC
ABSTRACT
We use a Panel Smooth Transition Regression model (PSTR) to investigate the nonlinear dynamic
relationship between financial variables and REITs1 of Japan and U.S with 3-month interest rate
change as threshold variable. We discuss the relationship between explained variable of REITs
return and explanatory variables (10 year bond interest rate, real estate return and stock return)
within two regimes. Empirical results show that the transition function is an exponential type with
region one, and two regimes. In regime 1, the relationships between REITs return and two
explanatory variables (10-year bond interest rate change and real estate return) are significantly
positive. The relationship between REITs return and stock return is significantly negative. In
regime 2, the relationships between REITs return and two explanatory variables (real estate return
and stock return) are significantly positive. REITs act as hedgy against stock market downturn
when the magnitude of 3-month interest rate reduces greater than 0.9886%. In the low interest rate
change regime, the REITs behave more like fix income and real estate than risky stock. In the high
interest rate change regime, REITs behave more like stock and real estate than fix income.
© 2015 AESS Publications. All Rights Reserved..
Keywords:
REITs, Panel smooth transition regression model, Threshold, Regime, Dynamic relationship, Hedgy, Realestate.
1 real estate investment trusts. A security that sells like a stock on the major exchanges and invests in real estate directly, either through
properties or mortgages
Asian Economic and Financial Review
ISSN(e): 2222-6737/ISSN(p): 2305-2147© 2015 AESS Publications. All Rights Reserved.
427
Contribution/ Originality
The study contributes in two ways. The first is to use a Panel Smooth Transition Regression
model (PSTR) to investigate the nonlinear dynamic relationship between financial variables (real
estate index returns, stock index returns, and ten year bonds) and REITs of Japan and U.S with
month interest rate change as threshold variable. The second is to investigate at what level of
3-month interest change will induce REITs markets serve as stock market hedgy under economic
shock.
1. INTRODUCTION
REITs (Real-estate Investment Trust Security) have proven to be popular with investors who
view stocks as too risky and bonds as not giving enough yield. REIT stocks not only offer more
stable returns than common stocks, but they also provide higher dividend yields than low interest
rates, which averaged 0.19% in Japan and 1.58% in U.S. for three-month deposits. Since the start
of 2000, the yield on 10-year Japanese government bonds has averaged about 1.3%. In contrast,
Japan REITs (Hence JREITs ) have higher yields of about 3.5% to 4%.
The United States is the initiator of REITs, which have prevailed in US capital markets since
1960. REITs in United States are popular investment products with a long and successful history as
active forms of real estate investment. REITs in the United States had grown from $1.4 billion in
1978, to 438 billion at the end of 2006, and then decreased to $192 billion at the end of 2008 due to
the financial crisis, then grew to $271 billion in 2009. Up to 2010, there have been approximately
150 publicly traded REITS in the U.S.
Japan opened the REIT market in September 2001 which is the earliest country in Asia to
initiate REIT legislation. In April, 2003, the Tokyo REITs index was compiled based on the closing
price of March 31, 2003. The total sale of REITs reached ¥1 trillion 800 billion in December
2004. By June 2005, 17 J-REITs have been listed on the Tokyo Stock Exchange. As of the end of
December 2007, the JREITs market has 41 listings and 16-fold increase in market capitalization to
¥5 trillion. At the end of 2012, the JREIT equity market capitalization stood at ¥4.51 trillion, a
rise of 53.4 percent from the previous year end figure of ¥2.94 trillion.
From the above evidence, one can see that the JREIT market development is faster than the
U.S. In terms of market size and the speed of growth, the importance of JREIT as an asset class has
grown considerably in the Asian market. REITs have become an increasingly important property
investment vehicle in both Japan and the U.S. in recent years. The rapid growth has increased the
importance of understanding the REITs market in Japan and U.S.
The overall Japan and U.S. REITs markets are examined in this paper. The two countries are
deservedly important and therefore warrant investigation for a variety of reasons. First, both are the
most developed and industrialized countries in the world. Second, the two nations play an
important and leadership role in the mature financial markets. Additionally, both have dramatic
REITs sectors growth and significant market capitalization as well as a number of listings.
© 2015 AESS Publications. All Rights Reserved.
428 the originator of the world REITs market. Therefore, this study investigates these two markets.
Thus, we use three-month interest rate as the threshold variables to examine the threshold effects in
the relationships of REITs and other Financial Securities including ten years bonds, real estate
returns, and stock returns in developed countries namely U.S and Japan.
The remainder of this paper is organized as follows. The section “Literature Review” reviews
the literature on the relationship of interest rates, stocks, bonds, and direct real estate to REITs of
Japan and the U.S. as a whole. The section “Research methodology” shows methodology. The
section “Empirical Results and Analysis” presents the data, model and main results. Section “Conclusion” section gives some concluding remarks.
2. LITERATURE REVIEW
Some studies on the interest rate sensitivity of REITs are conflicting. Some agree that REITs
and interest are highly correlated, while others believe that REITs are not correlated to interest
rates. The following researchers prove that REITs returns are sensitive to various interest rate
changes. For example, Chen and Tzang (1988) reported significant equity REITs sensitivity to
changes in yields of long-term government bonds. Sanders (1996; 1998) reported that return on
high yield (Baa) corporate bonds and sometimes high grade long-term corporate bonds, have
significant explanatory power for REITs returns. Allen et al. (2000) focus only on interest rate risk
and observe that Equity REIT returns are sensitive to changes in long- and short-term interest rates.
Swanson et al. (2002)found that REITs risk premium and interest rate are significantly correlated.
Chen et al. (1998) showed that unexpected interest period structure was highly correlated with
REIT return. McCue and Kling (1994) found that three-month Treasury bills best explains REIT
returns. Chen and Tzang (1988)found that from 1973 to 1979 the REITs returns are most sensitive
to long and short term interest rates. Khoo et al. (1993) illustrated that the relationship between
diversification and both interest rate and market betas differs by individual REITs. These factors
are also found to be useful in REITs return analysis (Chan et al., 1990).
Other arguments (Li and Wang, 1995; Mueller and Pauley, 1995) agreed that the overall
correlation of REITs and interest rate is weaker. Sanders (1998) and Chen and Tzang (1988)
suggest that interest rate sensitivities of REITs returns are different for different time periods. In
their study, Liang et al. (1995) find insignificant sensitivity of equity REITs to changes in monthly
holding period returns on long-term government bonds. Moreover, hybrid REITs were less
interest-rate sensitive than mortgage REITs during the same period. He et al. (2003) analyzed seven
different interest rate proxies and found that different interest rates lead to different consequences,
and that Equity REITs are only sensitive to the interest rate spread of long term government bonds
and Baa cooperate bonds.
Studies on the performance of REITs in investment portfolios and their correlations with other
financial assets had been executed (Cheok et al., 2001; Chiang et al., 2008; Kutsuna et al., 2008;
Quek and Ong, 2008; Su et al., 2010; Ong et al., 2011). Most researchers have documented that
© 2015 AESS Publications. All Rights Reserved.
429
Ross and Zisler, 1987; Goetzmann and Ibbotson, 1990; Ennis and Burik, 1991; Ross and Zisler,
1991; Liu and Mei, 1992; Myer and Webb, 1993; Myer and Webb, 1994). In addition, some
researchers provided empirical results in which the stock market plays an important role in pricing
REIT stock (Gyourko and Linneman, 1988; Giliberto, 1990; Park et al., 1990; Mengden, 1998;
Ewing and Payne, 2005). Stevenson (2002) found that the S & P 500 has a greater influence on
volatility in each REITs sector than in any other equity sector. These conclusions clearly indicate
that the stock market plays an important role in REITs performance. Furthermore, some researchers
argue that REITs behave like shares of common stock (Gyourko and Linneman, 1988; Park et al.,
1990; Ewing and Payne, 2005). Conover et al. (2000), Hoesli and Moreno (2007), and Su et al.
(2010) who found that REITs performance is explained by stock market return when in either bull
or bear markets.
In contrast to the above studies, Ziering et al. (1997) argued that REITs are less like stock.
Evidence provided by Glascock et al. (2002a; 2002b), Simpson et al. (2007), and Chan et al.
(2005) suggested that the behavior of REITS differs from that of traditional stock before the early
1990s. The study of Su et al. (2010) showed that the positive relationship between stock and REITs
only emerges in low-risk regime. The stock return does not have significant effects on the REITs
returns in high-risk regime. Avanidhar (2007) found that returns in the stock market negatively
forecast REITs return. Thus, REITs markets are viewed as substitute investment for stock markets,
which cause downturn in the stock market to increase money flows to the REITs market (Bhasin et
al., 1997; Ling and Naranjo, 1999). Moreover, the primary evidence supporting this claim is the
decreased correlation between NAREIT and S&P 500, and the inability of stock and bond factors
to explain REITS returns since the early 1990 compared to 1970s and 1980s (Ghosh et al., 1997;
Ziering et al., 1997).
Because the majority of REITs income consists exclusively of rentals from real estate, one can
view REITs as fixed-income securities. The advantages of fixed income offer a good hedgy against
equities market severe change (Liang and Mclntosh, 1998). The research of Su et al. (2010)
demonstrated that REITs are hybrid by nature in that they possess the characteristics of both the
traditional stock and fixed-income sector. Hoesli and Moreno (2007) reported that the risk nature of
REITs returns is mixed as in the case of stock and bond. The above research suggests that REITS
are similar to fixed-income securities.
Some research proves that the contemporaneous correlation between securitized and direct real
estate return is relatively low (Brounen and Eichholtz, 2003; Mueller and Mueller, 2003).
However, some studies have documented that over long horizons the linkages between indirect and
direct real estate are quite strong (Giliberto, 1990; Seck, 1996; Ziering et al., 1997; Geltner and
Kluger, 1998; Seiler et al., 2001; Mackinnon and Zaman, 2009; Oikarinen et al., 2011; Hoesli and
Oikarinen, 2012). The study of Hoesli and Oikarinen (2012) shows that long-run REIT market
performance is much more like the direct real estate market than the general stock market, while
the short term comovement between REITs and stocks is stronger than that between REITs and
© 2015 AESS Publications. All Rights Reserved.
430 We use the Panel Smooth Transition Regression (PSTR) model, which was recently developed
by Gonzàlez et al. (2005) to set 3-month interest rate change as threshold variables, and to
determine the relative influence of stock, fixed-income securities and direct real estate to Japan and
the U.S. REITs as a whole in different regimes. The objectives of this study are five-fold: (1) to
prove the nonlinear relationship of REITs with some financial variables (2) to demonstrate the
threshold effect of REITs with some explanatory variables, (3) to examine some of key
relationships in the REITs market in different regimes (4) to investigate at what 3-month interest
change will induce REITs market serve as stock market hedgy under economic shock, and (5) to
determine REITs behavior. Should they act like traditional stocks as suggested by prior studies?
Should they be treated as fixed-income security from steady rentals of real estate? Or should they
act like direct real estate?
3. RESEARCH METHODOLOGY
This paper used a Panel Smooth Threshold Regression (PSTR) model developed by Gonzàlez
et al. (2005) to analyze nonlinear relationship between 3-month interest rate, real estate index,
stock index, 10 year of bond and REITs of Japan and U.S. as a whole. This approach permits a
smooth change in market-specific correlation depending on the threshold variables. Consequently,
we consider one threshold variables, namely 3-month interest rate change, which can potentially
explain the heterogeneity in time according to the market. We will first briefly review the PSTR
model.2 The basic PSTR model with two extreme regimes is defined as follows:
(1) for i = 1, . . . , N, and t = 1, . . . , T, where N and T denote the cross-section and time dimensions of the panel, respectively. The dependent variable yit is a scalar, xit is a k-dimensional vector of time-varying exogenous variables, μi represents the fixed individual effect, and uit are the errors. Transition function
g
(
q
it;
,
c
)
is a continuous function of the observable variable qit and is normalized to be bounded between 0 and 1, and these extreme values are associated with regressioncoefficients
0and
0
1. More generally, the value of qit determines the value ofg
(
q
it;
,
c
)
and thus the effective regression coefficients
0
1g
(
q
it;
,
c
)
for individual i at time t. The widely used transition function is a logistic specification as in equation (2)(2)
where c = (c1, . . , cm)
'
is an m-dimensional vector of location parameters and the slope parameter
determines the smoothness of the transitions. The restrictions
0
and c1≤ . . . ≤ cm are imposed for identification purposes. In practice it is usually sufficient to consider m = 1 or m = 2, as these values allow for commonly encountered types of variation in the parameters. For m = 1, the model implies that the two extreme regimes are associated with low and high values of qit with a single monotonic transition of the coefficients from
0 to
0
1 as qit increases, where thechange is centered around c1. When
,g
(
q
it;
,
c
)
becomes an indicator function2 For more detail, see Gonzàlez, Terasvirta and VanDijk (2005).
it it
it it
i
it
x
x
g
q
c
u
y
1'(
;
,
)
'
0
m m j j itit
c
q
c
with
and
c
c
c
q
g
1 2
© 2015 AESS Publications. All Rights Reserved.
431
]
[
I
q
it
c
1 , defined as I [A] = 1 when the event A occurs and 0 otherwise. In that case the PSTR model in equation (1) reduces to the two-regime panel threshold model of Hansen (1999). For m = 2, the transition function has its minimum at (c1 + c2)/2 and attains the value 1 both at low and high values of qit. When
, the model becomes a three-regime threshold model whose outer regimes are identical and different from the middle regime. In general, when m > 1 and
, the number of distinct regimes remains two, with the transition function switching back and forth between zero and one at c1, . . . , cm. Finally, for any value of m the transition function becomes constant when
0
, in which case the model collapses into a homogenous or linear panel regression model with fixed effects. A generalization of the PSTR model to allow for more than two different regimes is the additive model(3)
where the transition functions
g
j(
q
it(j);
j,
c
j)
,j=1,…,r, are of the logistic type. If m = 1,it j
it
q
q
( )
and
j
, for all j = 1, . . . , r, the model in equation (3) becomes a PTR modelwith r + 1 regimes. Consequently, the additive PSTR model can be viewed as a generalization of the multiple regime panel threshold model in Hansen (1999). Additionally, when the largest model that one is willing to consider is a two-regime PSTR model with r = 1 and m = 1 or m = 2, equation (3) plays an important role in the evaluation of the estimated model. In particular, the multiple regime equation (3) is an obvious alternative in diagnostic tests of no remaining heterogeneity. The PSTR model building procedure consists of specification, estimation and evaluation stages. Specification includes testing homogeneity, selecting the transition variable yit and, if homogeneity is rejected, determining the appropriate form of the transition function, that is, choosing the proper value of m in equation (2). Statistically, the PSTR model is not identified if the data-generating process is homogenous, and a homogeneity test is necessary to avoid the estimation of unidentified
models. As to the estimation of parameters
(
0',
1',
,
c
')
' in the PSTR model is a relatively straightforward application of the fixed effects estimator and nonlinear least squares. Whereas evaluation of an estimated PSTR model is an essential part of the model building procedure, including the tests of parameter constancy over time and of no remaining nonlinearity.4. RESEARCH METHODOLOGY EMPIRICAL RESULTS AND ANALYSIS
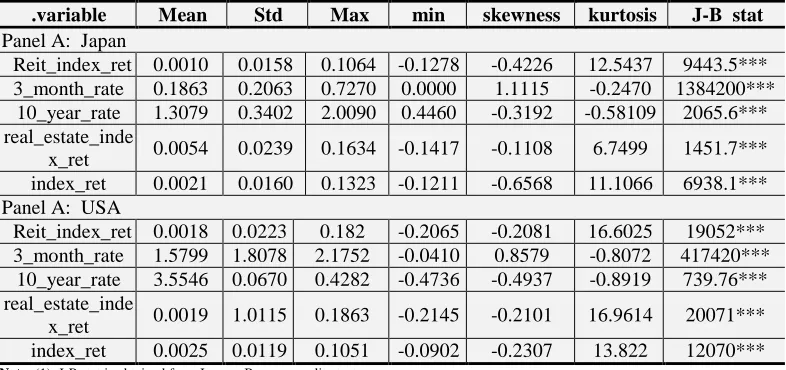
Table 1 reports the descriptive statistics of all variables. It shows high Kurtosis except 3-month and 10-year bond interest rate and left skewness except 3--month interest rate in both Japan
and the U.S. In addition, all variables reject the hypothesis of normal distribution. The mean returns
and standard deviation of REITs in Japan and U.S. are ((0.001 0.0158), (0.0018 0.0223),
respectively. It shows that REITs behaves like stock (0.0021 0.0160) and (0.0025 0.0119) in Japan
and the U.S. instead of fix-income securities (1.3079 0.3402) and (3.5546 0.0670) in Japan and the
U.S., as well as unlike real estate (0.005 0.0239) and (0.0239 1.0025) in Japan and the U.S.
respectively. The above results are different from that REITs performance and therefore much
more closely related to direct real estate market than to the general stock market indicated in Hoesli
and Oikarinen (2012).
Designed empirically, we set the 3-month interest rate change as the threshold variable, while
explanatory variable included: Dow Jones industrial average, Nikii index, 10 year bond rate, real
it j j j it j it r
j j it
i
it
x
x
g
q
c
u
y
)
,
;
(
( )1 ' '
0
© 2015 AESS Publications. All Rights Reserved.
432 estate index return in Japan and U.S. The explained variable is REITs returns in U.S. and Japan.
Table 2 presents the test of linearity results between the 3-month interest rate change and the U.S.
and Japan REITs index return. The LM, Fisher and LRT linearity tests clearly lead to reject the null
hypothesis of linearity. This result implies that there is strong evidence of the relationship between
3-month interest rate change and REITs index return in the U.S. and Japan is non-linear.
Table-1. Summary statistics of variables
Table 1 shows the statistics of variables in Japan and U.S. include REITs index return (Reit _index_ret), 3-monrh interest
rate (3_month_rate); 10 year bond interest rate (10_year_rate), real estate index return (real_estate_index_ret), and DOW &
NIKII index return (index_ret).
.variable Mean Std Max min skewness kurtosis J-B stat
Panel A: Japan
Reit_index_ret 0.0010 0.0158 0.1064 -0.1278 -0.4226 12.5437 9443.5***
3_month_rate 0.1863 0.2063 0.7270 0.0000 1.1115 -0.2470 1384200***
10_year_rate 1.3079 0.3402 2.0090 0.4460 -0.3192 -0.58109 2065.6***
real_estate_inde
x_ret 0.0054 0.0239 0.1634 -0.1417 -0.1108 6.7499 1451.7***
index_ret 0.0021 0.0160 0.1323 -0.1211 -0.6568 11.1066 6938.1***
Panel A: USA
Reit_index_ret 0.0018 0.0223 0.182 -0.2065 -0.2081 16.6025 19052***
3_month_rate 1.5799 1.8078 2.1752 -0.0410 0.8579 -0.8072 417420***
10_year_rate 3.5546 0.0670 0.4282 -0.4736 -0.4937 -0.8919 739.76***
real_estate_inde
x_ret 0.0019 1.0115 0.1863 -0.2145 -0.2101 16.9614 20071***
index_ret 0.0025 0.0119 0.1051 -0.0902 -0.2307 13.822 12070***
Note: (1). J-B stat is obtained from Jarque -Berra normality test.
(2).*** indicates the statistical significance and the rejection of null hypothesis at 1% significance level.
Furthermore, we apply a sequence of tests to determine the order m of the logistic function. In practice, it is usually sufficient to consider m = 1 (monotonically increasing with two regimes) or m=2 (symmetric or exponential) transition function, as these values allow for commonly encountered types of variation in the parameters. The results of the specification test sequence, shown in Table 3, we will select m = 2 because the rejection of H02 is the strongest one. We find
that exponential type in Figure 1.
© 2015 AESS Publications. All Rights Reserved.
433 Figure 1 show the transition function is exponential type. There is one region with 2 regimes. Threshold value is -0.009886. While the slope parameter is 32649.5019, it shows rapid transition.
Table-2. Test of linearity
The LM and pseudo LRT statistics have a chi-square distribution with mK degrees of freedom, whereas the F statistics has a F (mK; TN – N- K (m + r + 1)) distribution. LMF is its F-version. Pseudo LRT can be computed according to the same
definitions by adjusting the number of degree of freedom. H0:linear model against H1:PSTR model with at least one
threshold variable (r 1)
statistics P-value
Wald Tests (LM) 76.888 0.000***
Fisher Tests (LMF) 8.659 0.000
***
LRT Tests (LRT) 77.493 0.000***
Note: ****denote significant at 1% significance level.
Table-3. Sequence of homogeneity tests for selecting m. Select m=2 if the rejection of H02 is the strongest one, otherwise select m=1.
statistics P-value
H03:B3=0 F3 = 2.276 0.015***
H02:B2=0|B3=0 F2 = 5.009 0.000***
H01:B1=0|B2=B3=0 F1 = 1.340 0.210
Note: ****denote significant at 1% significance level.
The next step is to determine the number of transitions in the model. Table 4 testing for non remaining nonlinearity consists of checking whether there is one transition function ( H0 : r = 1 ) or
whether there are at least two transition functions ( H1 : r = 2 ). The testing results show that the
reasonable numbers of threshold r =1, which means that there is one region and the region has two regimes.
Table-4. Testing the Number of Regimes.
Tests of no Remaining non-linearity. Max r=5,m=1, the reasonable numbers of threshold r=1. H0: PSTR with r = 1 against H1: PSTR with at least r = 2
statistics P-value
Wald Tests (LM) 4.901 0.557
Fisher Tests (LMF) 0.815 0.558
LRT Tests (LRT) 4.903 0.556
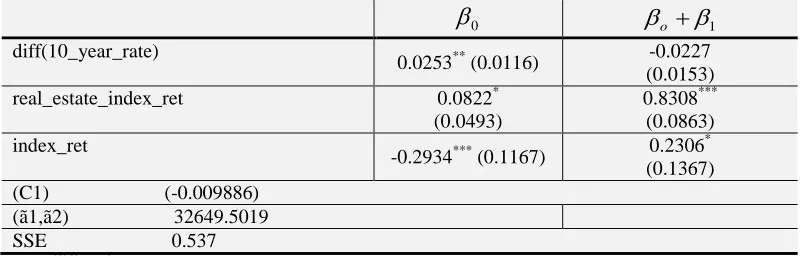
Table 5 shows the overall U. S. and Japan PSTR models parameters estimated results. The transition function is exponential specification (m=2 with two regimes) and there is one region (r=1), C is the location parameters, the values is -0.009886. The above result shows there is structural change at this point. The slope parameter indicates how rapidly the transition of g from 0 to 1 takes place. While the slope parameter is 32649.5019, it shows rapid transition. Equation 4 shows the full PSTR model (See also Figure 1).
-0.048_10_year_bond_rate_rate 0.7486realestate_index_ret 0.524index_ret
5019 . 32649 ), 009886 . 0 ( , ate 3_monthe_r ex_ret 0.02934ind (4) ex_ret estate_ind 0.0822real rate_rate year_bond 0.0253_10_ _ret Reit_index ' 1 it it it i it g
With regard to the explanatory variables, in the first regime, one can observe that the 10-year bond interest rate is significantly positive (0.0253), the real estate index return is also significantly positive (0.0822) and the stock index return is significantly negative (-0.2934) if there is not any structure change for the 3-month interest rate change. Pablo and Fabrizio (2005) documented that the real 3-month interest rates are mildly procyclical of economic cycle in developed countries. It is convenient to conclude that a change of the 3-month interest rate below -0.009886 in this (low) regime implies decreased interest rates during economic downturn. REITs can often take advantage
© 2015 AESS Publications. All Rights Reserved.
434 of lower interest rates by reducing their interest expenses and thereby increasing their profitability,
thus, returns of REITs and real estate grow. When the economy is slow, people maintain a conserved stance, removing fund from risky stock market to avoid risk, choosing rather to put their money in the less risky markets such as 10-year bonds, REITs market and the real estate market. Therefore, the relationship between real estate return, 10-years bond interest rate and REITs return are significantly positive, whereas the relationship between REITs and stock market is significantly negative. Another possible explanation is that a low interest rate causes an eventual boom, as people generally buy property when they can afford to service the debt. Eventually REITs and Real estate return increase although the economy experiences a slump and the stock market falls. Thus, when the magnitude of the 3-month interest rate reduces greater than 0.9886%, the REITs market serves as hedgy to the stock market. This conclusion is consistent with the result of Simon and Ng (2009), who found that REITS provides better protection against severe U.S stock market downturns.
In the second (high) regime, when the 3-month interest rate change is greater than -0.009886, it implies a rising 3-month interest rate. Rising interest rates would drive up REIT prices because increasing rates correspond to economic growth and more demand (Pablo and Fabrizio, 2005). Rising interest rates tend to be good for apartment REITs as people prefer to remain renters rather than purchase new homes. When the economy growth, the fund will invest in the stock market, real estate and the REITs market Therefore, the relationships between stock return and real estate return to REITs return are significantly positive, 0.2306 and 0.8308, respectively.
In addition, our results indicate that in the low interest regime the behavior of REITs is more like fixed income and real estate (coefficient are positives) than risky stock (coefficient is negative). However in the high interest regime, the behavior of REITs is more like that of stock and real estate (coefficients are positives) than that of fixed income (coefficient is insignificant). When the economy is booming, REITs behave more like stock and real estates than fixed income because investors are more aggressive. When economy is bad, REITs behave more like fixed income and real estate than stock because investors hold conservative stances. REITs behave more like real estate in strong economic conditions than in bad. In the research by Oikarinen et al. (2011), evidence shows correlation between both returns of securitized and direct real estate approach 1 in the long run, which is consistent with our results.
Table-5. Parameter Estimation Results for PSTR Model.
Table 5 shows the results from the model defined in Eq. 4.. Explained variable is REITs index return (Reit_index_ret) Threshold variable is 3-monrh interest rate change (diff(3_month_rate)); explanatory variables are 10 year bond interest rate change (diff(10_year_rate)) , real estate index return (real_estate_index_ret), and DOW & NIKII index return (index_ret). (2). C1 are location parameters, ã is slope parameter (smooth parameter or transition speed)
0
o
1diff(10_year_rate)
0.0253** (0.0116) -0.0227
(0.0153)
real_estate_index_ret 0.0822*
(0.0493)
0.8308*** (0.0863) index_ret
-0.2934*** (0.1167) 0.2306
*
(0.1367) (C1) (-0.009886)
(ã1,ã2) 32649.5019 SSE 0.537
© 2015 AESS Publications. All Rights Reserved.
435
5. CONCLUSION
This study utilized a Panel Smooth Threshold Regression (PSTR) to anlyze the nonlinear dynamic relationship between REITs and threshold variables of 3-month interest rate change. The PSTR model provides a robust way to appraise the heterogeneous relationship between financial variables of 3-month interest rate change, 10-years of bond rate change, real estate index, stock index (Dow, and Nikii) and REITs index of Japan and the US.
Empirically, one can find that a nonlinear dynamic relationship exists between 3 -month interest rate change and REITs in Japan and the U.S. The transition function is an exponential type. The results also show that transition speed (32649.5019) which exhibits the shape of rapid transition function. The model has one region and 2 regimes. In regime one, when 3-month interest rates change below -0.009886, implying the economic cycle is in downturn, the investors will withdraw their funds from risky stock markets and invest their money in safe instruments such as REITs and fix income (10 year bonds). The real estate market and REITs market will eventually prosper due to the decline of the 3-month interest rate due to the fact that REITs and real estate often take advantage of low interest rates by reducing their interest expense and thereby increasing their profit. Thus, the relationship between the 10-year bond interest rate, real estate return, and REITs return is significantly positive; however, the relationship between stock return and REITs is significantly negative. REITs act as hedgy against stock market downturn when the magnitude of the 3-month interest rate reduces more than 0.9886%. The results imply that when the extent of the 3-month interest rate decrease is greater than 0.009886, the investors should exert the policy of withdrawing their money from the stock markets to the safe haven of fixed income instruments.
In regime two when the 3-month rate changed above -0.009886, the interest rate increased. A rise in interest rates usually signifies an improving economy, which is good for REITs as people are spending and businesses are renting more space, thus, pushing the REITs and real estate markets up. Thus, the relationship between REITs and real estate is significantly positive. Because the economy improves, the stock markets go up, the relationship between stock and REITs is significantly positive as well.
From analysis of mean return and standard deviation, we see that REITs behave more like stock than fixed-income securities and real estate. When we analyze the behavior of REITs within structure change context, in the low interest change regime, when economy is poor, REITs behave more like fixed income and real estate than risky stock. In the high interest change regime, while the economy is prosperous, REITs behave more like stock and real estate than fixed income. Thus, REITs are hybrid by nature in that they own the characteristics of traditional stock, fixed-income, and real estate sector according to economic states.
REFERENCES
Allen, M.T., J. Madura and T.M. Springer, 2000. REIT characteristics and sensitivity of REIT return. Journal
of Real Estate Finance and Economics, 21(2): 141-152.
Avanidhar, S., 2007. Liquidity, return and order-flow linkages between REITs and the stock market. Real
Estate Economics, 35(3): 383-408.
Bhasin, V., R. Cole and J. Kiely, 1997. Change in REIT liquidity 1990-1994: Evidence from intraday
transactions. Real Estate Economics, 25(4): 615-630.
Brounen, D. and P. Eichholtz, 2003. Property, common stock and property shares. Journal of Portfolio
Management, 29(5): 129-137.
Chan, K.C., P.H. Hendershott and A.B. Sanders, 1990. Risk and return on real estate: Evidence from equity
© 2015 AESS Publications. All Rights Reserved.
436 Chan, S.H., W.K. Leung and K. Wang, 2005. Change in REIT structure and stock performance: Evidence
from the monday stock anomaly. Real Estate Economics, 33(1): 89-120.
Chen, K.C. and D.D. Tzang, 1988. Interest rate sensitivity of real estate investment trust. Journal of Real
Estate Research, 3(3): 13-22.
Chen, S.J., C. Hsieh, T.W. Vines and S.N. Chiou, 1998. Macroeconomic variables, firm specific variables and
returns to REITs. Journal of Real Estate Research, 16(3): 269-277.
Cheok, S.M.C., T.F. Sing and I.C. Tsai, 2001. Diversification as a value-adding strategy for Asian REITs: A
myth or reality? International Real Estate Review, 14(2): 184-207.
Chiang, Y.H., C.K. So and B.S. Tang, 2008. Time-varying performance of four Asia-pacific REITs. Journal of
Property Investment and Finance, 26(3): 210-231.
Conover, M.C., H.S. Friday and S.W. Howton, 2000. An analysis of the cross section of returns for ERETs
using a varying-risk beta model. Real Estate Economics, 28(1): 141-163.
Ennis, R. and P. Burik, 1991. Pension fund real estate investment under a simple equilibrium pricing model.
Financial Analyst Journal, 47(3): 20-30.
Ewing, B. and J. Payne, 2005. The response of real estate investment trust returns to macroeconomic shocks.
Journal of Business Research, 58(3): 293-300.
Geltner, D. and G. Kluger, 1998. REIT-based pure-play portfolio: The case of property types. Real Estate
Econnomic, 26(4): 581-612.
Ghosh, C., R.S. Guttery and C.F. Simans, 1997. The effects of real estate crisis on institutional stock prices.
Real Estate Economics, 25(4): 591-614.
Giliberto, M., 1990. Equity real estate investment trusts and real estate return. Journal of Real Estate Research,
5(2): 259-263.
Glascock, J.L., C. Lu and R.W. So, 2002a. Further evidence on the integration of REIT, bond, and stock
returns. Journal of Real Estate, Finance and Economics, 20(2): 177-194.
Glascock, J.L., C. Lu and R.W. So, 2002b. REIT return and inflation: Perverse or reverse causality effect?
Journal of Real Estate Finance and Economics, 24(3): 301-317.
Goetzmann, W.N. and R.G. Ibbotson, 1990. The performance of real estate as an asset class. Journal of
Applied Corporate Finance, 13(1): 65-76.
Gonzàlez, A., T. Terasvirta and D. VanDijk, 2005. Panel smooth transition regression model. Economics and
finance quantitative finance research center. University of Technology, Sidney. Working Paper, 604.
Gyourko, J. and P. Linneman, 1988. Owner-occupied homes,income-producing propertiew, and REITs as
inflation hedges: Empirical findings. Journal of Real Estate Finance and Economics, 1(4): 347-372.
Hansen, B., 1999. Inference when a nuisance parameter is not identified under the null hypothesis.
Econometrica, 64(2): 413-430.
He, L.T., R. Jame, F.C. Webb and N. Myer, 2003. Interest rate sensitivity of REITs returns. International Real
Estate Review, 6(1): 1-21.
Hoesli, M. and C.S. Moreno, 2007. Securitized real estate and its link with financial assets and real estate: An
© 2015 AESS Publications. All Rights Reserved.
437 Hoesli, M. and E. Oikarinen, 2012. Are REITs real estate? Evidence from international sector level data.
Swiss Finance Institute Research Paper Series No. 12 – 15.
Khoo, T., D. Hartzell and M. Hoesli, 1993. An investigation of the change in real estate investment trust betas.
Journal of the American Real Estate and Urban Economics Association, 21(2): 107-130.
Kutsuna, K., W. Dimovski and R. Brooks, 2008. The pricing and underwriting cost of Japanese REIT IPOs.
Journal of Property Research, 25(3): 221-239.
Li, Y. and K. Wang, 1995. The predictability of REIT returns and market segmentation. Journal of Real Estate
Research, 10(2): 471-482.
Liang, Y., W. Mcintosh and J.R. Webb, 1995. Inter-temporal changes in the riskness of REITs. Journal of
Real Estate Research, 10(4): 427-443.
Liang, Y. and W. Mclntosh, 1998. REIT style and performance. Journal of Real Estate Portfolio Management,
4(1): 69-78.
Ling, D. and A. Naranjo, 1999. The integration of commercail real estate markets and stock markets. Real
Estate Econmics, 27(3): 483-515.
Liu, C.H. and J. Mei, 1992. The predictability of returns on equity REITs and their co-movement with other
assets. Journal of Real Estae Finance and Economics, 5(4): 401-418.
Mackinnon, G.H. and A.I. Zaman, 2009. Real estate for the long term: The effect of return predictability on
long-horizon allocations. Real Estate Economics, 37(1): 117-153.
McCue, T.E. and J.L. Kling, 1994. Real estate returns and the macroeconomy: Some empirical evidence from
real estate investment trust data, 1972-1991. The Journal of Real Estate Research, 9(3): 277-287.
Mengden, A.E., 1998. Real estate investment trusts-sensitivity of dividend yields to changes in interest rates.
New York: Salomon Brothers, Inc.
Mengden, A.E. and D.J. Hartzell, 1986. Real estate investment trusts – are they stocks or real estate. New
York: Salmon Brothers, Inc.
Mueller, A.G. and G.R. Mueller, 2003. Public and private real estate in a mixed-asset portfolio. Journal of
Real Estate Portfolio Management, 9(3): 193-203.
Mueller, G.R. and K.R. Pauley, 1995. The effect of interest rate movement on real estate investment trusts.
Journal of Real Estate Research, 10(3): 319-326.
Myer, N.F.C. and J.R. Webb, 1993. Return properties of equity REITs, common stocks, and commercial real
estate: A comparison. Journal of Real Estate Research, 8(1): 87-106.
Myer, N.F.C. and J.R. Webb, 1994. Retail stocks, real REITs and retail real estate. Jouranl of Real Esate
Research, 9(1): 65-84.
Oikarinen, E., M. Hoesli and C. Serrano, 2011. The long-run dynamics between direct and securitized real
estate. Journal of Real Estate Research, 33(1): 73-103.
Ong, S.E., T.L. Ooi and Y. Kawaguichi, 2011. Seasoned equity issuance by Japan and Singapore REITs.
Journal of Real Estate Finance and Economics, 43(1): 205-220.
Pablo, A.N. and P. Fabrizio, 2005. Business cycles in emerging exonomices: The role of interest rates. Journal
© 2015 AESS Publications. All Rights Reserved.
438 Park, J.Y., D.J. Mullineaux and I.K. Chew, 1990. Are REITs inflation hedges? Journal of Real Estate Finance
and Economics, 3: 91-103.
Quek, M.C.H. and S.E. Ong, 2008. Securitizing China real estate: A tale of two China-centric REITs. Journal
of Property Investment and Finance, 26(3): 247-274.
Ross, S.A. and R.C. Zisler, 1987. Managing real estate portfolios part 2: Risk and return in real estate. New
York: Goldman Sachs.
Ross, S.A. and R.C. Zisler, 1991. Risk and return in real estate. Joural of Real Estate Financeand Economics,
4: 175-190.
Sanders, A., 1998. The historical behavior of REIT returns: A capital markets perspective, in real estate
investment trusts: Structure, analysis and strategy. NY: McGraw-Hill.
Sanders, A.M., 1998. A note on the relationship between corporate bonds and equity REITs. Real Estate
Finance, 13: 61-63.
Seck, D., 1996. The substitutability of real estate assets. Real Estate Economics, 24(1): 75-96.
Seiler, M., J. Webb and F. Myer, 2001. Can real estate portfolios be rebalanced/diversified using equity REIT
shares. Journal of Real Estate Portfolio Mangement, 7(1): 25-41.
Simon, S. and W.L. Ng, 2009. The effect of the real estate downturn on the link between REITs and the stock
market. Journal of Real Estate Portfolio Mangement, 15(3): 211-219.
Simpson, M.W., S. Ramchander and J.R. Webb, 2007. The asymmetric response of equity REIT return to
inflation. Journal of Real Estate Finance and Economics, 34: 513-529.
Stevenson, S., 2002. An examination of volatility spillovers in REIT returns. Real Estate Portfolio
Management, 8(3): 229-238.
Su, H.M., C.M. Huang and T.Y. Pai, 2010. The hybrid characteristic of REIT returns: Evidence from Japanese
and U.S. markets. Journal of Real Estate Literature, 18(1): 77-98.
Swanson, Z., J. Theis and K.M. Casey, 2002. REIT risk premium sensitivity and interest rates. Journal of Real
Estate Fiancé and Economics, 24(3): 319-330.
Ziering, B., B. Winograd and W. Mclntosh, 1997. The evolution of public and private market investing in the
new real estate capital markets. Parsippany, NJ: Prudential Real Estate Investor.