Simulation Based Analysis of Target Area
Calculation and Key Pre Distribution Scheme in
WSNs using Node Deployment Knowledge
M.L.G.N.Chellarao1 M. Kalyan Ram2Department of CSE, Aditya Engineering College, Surampalem, A.P, INDIA
Abstract — Recent advances in electronics and wireless communication technologies have enabled the development of large-scale wireless sensor networks that consist of many low-powers, low-cost and small-size sensor nodes. Sensor networks hold the promise of facilitating large-scale and real-time data processing in complex environments. Some of the application areas are health, military, and home. Deployment of nodes in Wireless Sensor Networks (WSNs) is a basic issue to be addressed as it can influence the performance metrics of WSNs connectivity, resilience and storage requirements. Many deployment schemes have been proposed for wireless sensor networks. In this paper we consider the implications of Grid and Random deployment schemes for the connectivity and resilience of the WSNs. The way we can calculate geographical irregular shape’s area is also presented. We present the analytical and simulation-based results of the simple key distribution EG scheme for WSN using the deployment knowledge to motivate the use of these emerging paradigms. We configured the node parameters such as sensing, temperature, energy capabilities using Mannasim based on NS-2.3.4
Keywords - Wireless Sensor Networks, Key Distribution, Deployment Knowledge
I.INTRODUCTION
Wireless sensor networks (WSNs) have been an active research field in many recent real-time application domains includes monitoring of the environment (e.g. temperature, humidity, and seismic activity as well as numerous other ecological, law enforcement, and military settings). Usually sensor networks are composed of one or more base stations and a number of sensor nodes, where the base stations serve as the commanders and the data sinks, from which the commands will be broadcasted to the sensors, and upon receiving those commands, sensors will send results back to the base stations [1].
A WSN can be composed of homogeneous or heterogeneous sensors, which possess the same or different communication and computation capabilities, respectively. However in this paper we consider the homogeneous WSNs which can provide less complexity and better manageability. As discussed in [4], in a homogeneous network, we refer the connectivity as the ability of any two nodes to communicate with each other across the network. Resilience can be defined as the ability of the WSN to get back to its original state after nodes have been captured by the adversaries and a good deployment scheme can meet the competing requirement of low memory usage.
Depending on the size of the deployment area, the transmission range of the sensor nodes, and the base station, sensor nodes can communicate with the base station directly or indirectly by computing a hop-by-hop route to it [2]. Two nodes that are within range can communicate securely if they share a common key. But, as specified in [4], if two neighbouring nodes do not share a key may be able to communicate securely by using a two-hop path with the assistance of an intermediate node that is within range of, and shares a key with both of the nodes.
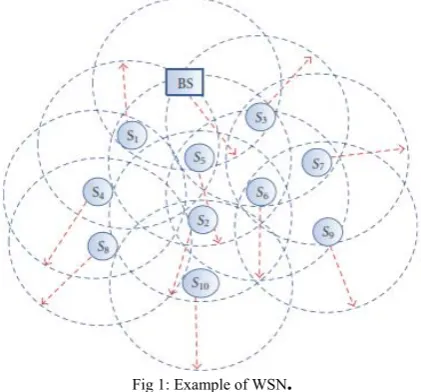
Fig 1: Example of WSN.
Figure 1 show an example of a WSN composed of ten sensor nodes deployed randomly around a base station, which broadcasts commands to each sensor node within the communication area of the network. Upon receiving the commands, the sensor nodes send results back to the base station. In our study, we illustrate two node deployment strategies, random and grid and a simple random key distribution scheme for wireless sensor networks and analysed the implications of these schemes for the performance metrics, connectivity, resilience and storage requirements.
IIRELATED WORK
A. Deployment Schemes for WSNs
In WSNs, the major challenge is the deployment of the nodes in the deployment region to satisfy continuous sensing with extended network lifetime while maintaining uniform coverage. Various architectures and node deployment strategies have been developed for wireless sensor network, depending upon the requirement of application [6]. An excellent survey of the current state of the research on optimized node placement in WSNs is explained in [5]. In this work, we focus on two deployment schemes for sensor networks environments, Random Deployment and Grid-based Deployment.
Random Deployment - Random approach for node
deployment is deeply discussed in [7], which has considered as one of the competitors. Random deployment means setting positions of wireless sensor nodes randomly and independently in the target area. When practical application scenarios are considered, random deployment is a feasible and practical method, and sometimes it is the only feasible strategy though costs a relatively larger number of nodes to achieve the deployment goal [5].
Grid- based Deployment- Thus, so far we have only considered the non-deterministic deployment scheme, random deployment, in which the sensor nodes are thrown randomly to form a network. However, since excess redundancy is required to overcome uncertainty it could be very expensive.
In [6], the researchers state that grid-based deployment is an attractive approach for moderate to large-scale coverage-oriented deployment due to its simplicity and scalability. In this research, the authors illustrate the amount of connectivity and resilience of the sensor nodes against the adversaries when they are deployed in grid fashion. Grid-based deployment is conducted by dropping sensors row-by row using a moving carrier. However, in practice, it is often infeasible to guarantee exact placement due to various errors, including misalignments and random misplacement. There are three popular grid layouts namely, unit square, an equilateral triangle, a hexagon, etc. Among them, we investigate a square grid because of its natural placement strategy over a unit square.
In [8], the authors have considered the situation where sensors are deployed in a battlefield. Suppose the adversary captures one region and captures all the sensors. Then, we must ensure that other regions are not affected by such a compromise. For this the whole target region where the sensor nodes are to be deployed is partitioned into equal size squares or grids as in Liu and Ning [2003, 2005].
III.KEY DISTRIBUTION SCHEME
The prior key distribution scheme for WSNs proposed by Eschenauer and Gligor is presented in [3], which is elegant, simple, and provides effective tradeoffs between robustness and scalability. For key distribution, this scheme describes three phases, namely key pre-distribution, shared-key discovery, and path key establishment.
The steps involved in EG scheme are:
Step 1: Generate a large pool of keys (e.g., 10,000 keys).
Step 2: Randomly take k keys out of the pool to establish a key ring, where k << N, where N is the total number of nodes. Each node receives its own unique key ring, consisting of a subset of keys.
Step 3: When two nodes must communicate, they
search for a common key within the key ring by broadcasting the identities (IDs) of the keys they have. If such a key does not exist, they attempt to communicate through a common third party, who is able to establish communications with both nodes.
IV.OUR CONTRIBUTION
A. Simulation Architecture
We had designed two deployment schemes, Random and Grid which has been simulated by NS-2 and mannasim. For key distribution EG Scheme has been chosen.
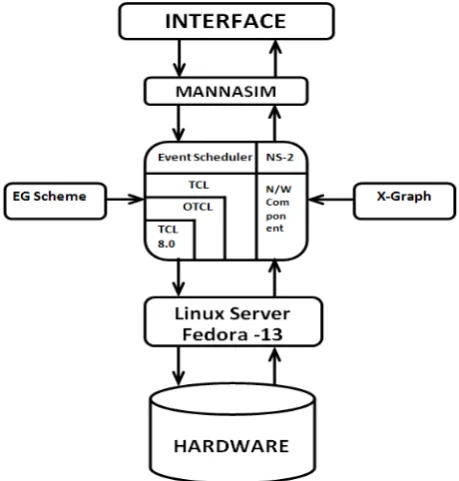
In Figure 2, we use the interface Nam which is a Tcl/TK based animation tool for viewing network simulation traces and real world packet trace data. MANNASIM is a framework for WSN simulation based on NS-2 [4]. It extends NS-2 by introducing new modules for design, development and analysis of different WSN applications. The goal of MANNASIM is to develop a detailed simulation framework, which can accurately model different sensor nodes and applications while providing a versatile test bed for algorithms and protocols.
Fig 2: WSN Simulation Architecture
Eschenauer and Gligor presented one of the prior key distribution schemes for WSNs that is elegant, simple, and provides an effective trade-offs between robustness and scalability [3].
B. The Node Configuration
The following parameters are required for simulating the WSNs using mannasim [10].
$ns_ node-config -addressType hierarchical -adhocRouting AODV
-llType LL
-macType Mac/802_11
-ifqType Queue/DropTail/PriQueue -ifqLen 50
-antType Antenna/OmniAntenna -propType Propagation/TwoRayGround -phyType Phy/WirelessPhy
-topologyInstance $topo
-channel Channel/WirelessChannel -agentTrace ON
-routerTrace ON -macTrace OFF -movementTrace OFF
V.SIMULATION WITH MANNASIM
A. Random Deployment
Fig 3: Simulation of WSN using Random Deployment
In our work, we use a framework MANNASIM with NS-2 for WSN simulation. We have choosen to work with two different scenarios, one with random deployment of sensor nodes and other with grid deployment of sensor nodes.Each of the scenarios consists of 10 nodes including one access point as shown in Figure 3 & 4 respectively.
B. Grid Deployment
Fig 4: Simulation of WSN using Grid Deployment
C. Key Distribution using EG-Scheme
Fig 5: Key Generation of WSN using EG Scheme
Fig 6: Key distrubution using EG Scheme
VI.ANALYSIS OF FINDING TARGET AREA
A. Boundary- Fill approach
Boundary Fill Approach[11] is used to calculate the irregular shaped area. In order to find the total area of an irregular shaped geographical area we can approach the following way.
First let us consider an unshaped region as shown in Fig. 7. Now take two positions whose distance is known to us. And these points are in such a manner that these two points lie on the unshaped region, let these positions be A & B as shown in Fig. 8.
Fig. 8: Irregular Shaped geographical area with known A & B Positions
Now form a square with this AB as one of the sides of the square which is formed as a square ABCD as shown in Fig. 9. Now calculate the area of the square AB2.
Fig. 9: Irregular Shaped geographical area with ABCD Square.
The area of this geographical area is been calculated
By counting the number of squares that can be filled horizontally from this square to the left (or right) until we reach the geographical region’s boundary as shown in Fig. 10.
Before counting the no. of squares in that
horizontal direction store the squares lie on the top and bottom of the starting square(In our example ABCD) for the next iteration.
Fig. 10: Counting of the horizontally Left side
We need to consider the following aspects in
storing these squares,
i.
If the top or bottom squares were already counted exempt them correspondingly.ii. If the top square touches the geographical region’s boundary store top-left corner square (for Left traverse) Fig.11 or top-right corner square (for Right traverse)
iii. If the bottom square touches the geographical region’s boundary store bottom-left corner square (for Left traverse) Fig.12 or bottom-right corner square (for Right traverse)
Fig. 11: Storing of the square for Left Traverse among Top Squares
Now perform the counting of squares left (or right) for the squares that are stored in the previous iterations as done in step 1. This is carried for all the squares that were stored are emptied.
Fig. 12: Storing of the square for Left Traverse among Bottom Squares
VII.COMPARATIVE STUDY
Thus, so far we have only considered various node deployment schemes for wireless sensor networks proposed by different authors. In this section we describe the comparative study of these node deployment schemes.
A. Comparison with Performance Metrics:
Connectivity, Storage, Scalability. B.
TABLE I. COMPARISON OF THE DIFFERENT SCHEMES WITH RESPECT TO THE TYPE OF NODES -NODES OF SAME STRENGTH (HOMOGENEOUS) OR
DIFFERENT STRENGTH (HETEROGENEOUS),CONNECTIVITY, AND STORAGE AND SCALABILITY.
Deployment Nodes Connectivity Storage Scalability
Random geneous Homo- Very Poor τ (λ + 1) Yes
Grid geneous Homo- Poor O ( √N ) No
Here τ denotes the number of key spaces, λ denotes the security parameter for the Blom scheme, g is the number of groups, n is the number of nodes in each group and γ = ns ⁄
g, where ns is the total number of sensors. N is the total number of sensors. 1 is the storage for small sensor nodes and 2 is the storage for agents.
B. Threat Model
Now, we present a comparative study of these deployment schemes with respect to threat model. According to [8], when sensor nodes are deployed in adversarial regions they are prone to be captured by enemies. When sensor nodes are captured, the enemy gets access to the keys in it, so these compromised keys cannot be used for later communication.
TABLE II
COMPARATIVE STUDY OF DEPLOYMENT SCHEMES WITH THE RESILIENCY
Deploy- ment
Random Node Capture Attack
Selective Node Capture Attack
Random Exists Exists
Grid Exists Exists
Based on our survey we have analysis on various deployment schemes in wireless sensor networks, we have presented the comparative study of resilience with respect to various deployment schemes in Table II.
VIII.CONCLUSIONS AND FUTRUE WORK
In this paper we discussed the two types of deployment scenarios of sensor nodes for WSNs. We classified and simulated node configuration in WSN by NS-2 and mannasim. It is also observed that the parameters of node configuration consist of Sensor Node, Processing, SensedData, DataGenerator, Temperature DataGenerator, Battery, and AccessPoint.
We focused on a simple random key distribution scheme, EG scheme. However, this scheme has some drawbacks. Compared to the newer schemes, Eschenauer’s random key distribution is just a simple key distribution scheme. As a future work, we will study few more deployment strategies and focus on key distribution schemes to provide security aspects such as robustness and scalability.
REFERENCES
[1] WANG, DU, and LIU 2009. ShortPK: A Short- Term Public Key Scheme for Broadcast Authentication in Sensor Networks. ACM Transactions on Sensor Networks, Vol. 6, No. 1, Article 9.
[2] Messai, Aliouat, and Seba. 2010. Tree Based Protocol for Key Management in Wireless Sensor Networks. Research Article, EURASIP Journal on Wireless Communications and Networking.
[3] Eschenauer and V. D. Gligor, “A Key-Management Scheme for Distributed Sensor Networks,” Proc. 9th ACM Conf. Comp. and Commun. Sec., 2002, pp. 41–47
[4] Lopez, Alonso, Sala, Marino, and Haro. Simulation Tools for wireless sensor Neetworks. Summer Simulation Multiconference-SPECTS 2005.
[5] XiangYang, Yajun Wang, Wangsen Feng, Mo Li, and YunHao Liu. Random Deployment of wireless sensor Networks: Power of Second chance.
[6] Monica, and Ajay K Sharma. Comparative Study of Energy Consumption for Wireless Sensor Networks based on Random and Grid Deployment Strategies. International Journal of Computer Applications (0975 – 8887), Volume 6– No.1, September 2010.
[7] Wint Yi Poe, and Jens B. Schmitt. Node Deployment in Large Wireless Sensor Networks: Coverage, Energy Consumption, and Worst-Case Delay. AINTEC’09, November 18–20, 2009, Bangkok, Thailand.
[8] Ruj, S. and Roy, B. 2009. Key pre-distribution using combinatorial designs for grid-group deployment scheme in wireless sensor networks. ACM Trans. Sensor Netw. 6, 1, Article 4 (December 2009),
[9] Huang, D. and Medhi, D. 2007. Secure pairwise key establishment in large-scale sensor networks: An area partitioning and multi group key pre-distribution approach. ACM Trans. Sens. Netw. 3, 3, Article 16 (August 2007). [10] http://www.isi.edu/nsnam/nsns-documemtation