Characteristics of the Concentric Eyewall Structure of Super Typhoon Muifa during
Its Formation and Replacement Processes
Tonggui Bo, Yudi Liu, Dawei Li, Lang Huang, and Yi Yu
Institute of Meteorological and Oceanography, National University of Defense Technology, Changsha 410073
Corresponding author: Yudi Liu ([email protected])
Key Points:
• The early signal of the formation of the outer eyewall is found
• The new characteristics in the concentric eyewall replacement process are presented
• There is a significant correlation between the echo in the moat area and the intensity of the outer eyewall
Abstract
To explore the characteristics of the concentric eyewall of a typhoon during its formation and replacement processes, with Super Typhoon Muifa in 2011 as the example case, the Weather Research and Forecast (WRF) mode was used to carry out a numerical simulation to reproduce the entire formation and replacement processes of the concentric eyewall. The physical quantities such as the tangential wind speed, radar echo, radial wind speed, vertical wind speed, and
potential vortex were diagnosed and analyzed. The results of the analysis show that the outward expansion of the isovelocity in the lower troposphere was the early signal of the formation of the outer eyewall. After the outer eyewall formed, there was a center of second-highest tangential wind speed in the corresponding area. The second-highest wind speed increased as the strength of the outer eyewall increased, and the position of the second-highest wind speed center was retracted with the retraction of the outer eyewall. The tangential wind speed of the moat area was smaller than that corresponding to the concentric eyewall and this feature gradually disappeared with the increase of the height. The echo in the moat area was weak, and this characteristic was particularly evident when the moat area was relatively wide and the outer eyewall was relatively strong. With the formation and development of the outer eyewall, the intensity of the inflow in the boundary layer corresponding to the inner eyewall was reduced, the intensity of the outflow in the upper layers declined, and the intensities of the inflow and outflow corresponding to the outer eyewall were enhanced. After the second outer eyewall matured, there was a significant inflow in the upper layer of the moat area. Once the outer eyewall formed, a large amount of hydrometeors appeared in the corresponding area, and there was a strong ascending motion inside that area. The strength of the ascending motion and the content of hydrometeors increased as the outer eyewall increased. When the moat area was relatively wide, the divergent airflow generated by the developed outer eyewall in the upper layer would produce a significant descending motion in the moat area.
1 Introduction
According to a large number of observations and analyses (Willoughby, 1982; Hawkin, 2008; Kuo, 2006), during the development of some strong typhoons, a spiral rain band forms a strong precipitation ring around the eyewall, which is usually accompanied by second-highest wind speed. Such inner and outer convection circles are usually referred to as the concentric eyewall, and the weak convection zone between the inner and outer convection circles is known as the moat area. This structural feature can appear multiple times throughout the life cycle of a typhoon. Hawkin et al. (2008) and Kuo et al. (2009) pointed out that hurricanes with an intensity of 4 or 5 (according to the Saffir-Simpson level) or typhoons with a maximum surface wind speed (MWS) of more than 120 kt often have a concentric eyewall. The formation and the replacement processes of the concentric eyewall have a significant impact on the intensity and structure of typhoons. When the outer eyewall is formed, both the strong wind area and the strong precipitation area are enlarged, and when the outer eyewall develops and shrinks, the intensity of the typhoon tends to weaken. For example, as the minimum sea surface pressure at the typhoon center increases, the MWS decreases. After a period of time, the inner eyewall disappears and the outer eyewall replaces the inner eyewall as the new eyewall; once the eyewall is replaced, the typhoon intensity can be enhanced again under favorable conditions. For
typhoon intensity prediction error comes from a typhoon with a concentric eyewall. Therefore, the prediction errors of the formation and replacement processes of the concentric eyewall of a typhoon often lead to errors in forecasting the typhoon intensity.
Through an ideal experiment based on a simple numerical model, Molinari (1990) found that the formation of a concentric eyewall might be related to the angular momentum flux of the vortex. When there is a low trough in the upper layer, an upper trough can deliver positive eddy angular momentum to a typhoon, the delivered angular momentum flux can enhance the
convection in the lower troposphere, and the enhanced convection will gradually develop into an outer eyewall in the concentric eyewall of the typhoon under favorable conditions. Nong (2003) was the first one to conduct a test using a two-layer equilibrium model, pointing out that a
concentric eyewall can always be formed when there is sufficient water vapor in the middle layer of the troposphere. Without adequate water vapor conditions, an initial disturbance is needed to generate a concentric eyewall. A symmetrical model with full physical processes was used to simulate the typhoon concentric eyewall, the results of which showed that the initial disturbance with specific amplitude was the basis of the formation of the concentric eyewall. However, the study results from Terwey et al. (2006) differed from the conclusions of Nong (2003). Terwey et al. (2006) used a complex model with full physical processes to simulate a typhoon, indicating that the concentric eyewall and its replacement process could still occur without initial
disturbance.
Based on an ideal model free from water vapor, Montgomery et al. (1997) pointed out that the vortex Rossby wave in the inner core of a typhoon could increase the average tangential wind speed at a certain radius (stagnation radius) by disturbing the momentum flux convergence and then generate a center of second-highest wind speed, forming the outer eyewall of the typhoon at the stagnation radius. Nonetheless, with a numerical simulation and analysis of Hurricanes Katrina and Rita, Judt et al. (2005) indicated that the vortex Rossby wave was not the cause of the concentric eyewall, since the moat area could block the outward propagation of the vortex Rossby wave.
Kuo et al. (2004) considered the formation of a concentric eyewall resulting from the interaction of a small, strong vortex with a large, weak asymmetric convection zone. They used the simple non-dispersive barotropic vorticity model to change the vortex intensity ratio, scale ratio, and distance between the vortex center and the convection zone, which indicated that the intensity of the vortex center played an important role in the formation of the concentric eyewall. When the vortex intensity ratio of the two was greater than or equal to 6, the vortex center could rotate and stretch the outer weak vorticity, and the concentric eyewall was formed through the axis symmetry process.
According to Willoughby (1998), Lord (1984), and Craig (1996), the ice-phase
microphysical process is related to the formation of a typhoon’s outer eyewall. By studying the influence of the microphysical parameterization process of clouds on typhoon simulation results, Wang et al. (2002) also indicated the close relationship between ice-phase particles and
convection outside the typhoon. By conducting an ideal experiment, Zhou et al. (2011)
Didlake and Houze (2011) observed non-gradient winds in the boundary layer during the observation and analysis of the replacement process of a concentric eyewall. By carrying out a numerical simulation of the concentric eyewall of Typhoon Sinlaku (2008), Huang et al. (2012) found that the outward expansion of the wind field in the boundary layer was the early signal of the formation of the concentric eyewall. That is, the imbalanced gradient wind in the boundary layer led to the formation of the outer eyewall. Nevertheless, while simulating Typhoon Sinlaku (2008), Sun (2012) suggested that the non-equilibrium process in the boundary layer did not play a major role in the formation of the concentric eyewall.
Sun (2012) added a sensitivity test based on the successful simulation of the concentric eyewall of Typhoon Sinlaku (2008). In the sensitivity test, the cumulus convection
parameterization scheme outside the typhoon was turned off. Since there was no cumulus convection scheme and the peripheral resolution was low, the simulated peripheral convection activity was relatively weak, preventing the formation of a concentric eyewall. Therefore, that study proposed that the peripheral environmental conditions had a significant impact on the formation of the concentric eyewall, and it was necessary to emphasize the environmental conditions outside the typhoon when forecasting the concentric eyewall. Hill et al. (2009) designed four ideal experiments to study the impact of environmental humidity on a typhoon scale, finding that the typhoon with high relative humidity in the test showed the characteristics of a concentric eyewall, but they failed to further their study. By analyzing the numerical
simulation results of Hurricanes Katrina (without the formation of a concentric eyewall) and Rita (with the formation of a concentric eyewall), and probing into the data offered by the dropsonde, Ortt et al. (2008) found a big difference in the relative humidity fields of the two typhoons. Rita had a relative humidity near the top of the boundary layer that was about 10% higher than that of Katrina, so the authors believed that sufficient environmental water vapor conditions were conducive to the formation of the concentric eyewall. While exploring the factors affecting the size of the outer eyewall, Zhou (2013) found that the size of the outer eyewall was inversely proportional to the typhoon intensity and the vorticity in the lower layer of the environment, the large-scale outer eyewall often appeared in the relatively weak typhoon, the small-scale outer eyewall usually appeared during the process of rapid reinforcement, and the large-scale outer eyewall was often found under conditions of high latitude, high relative humidity, and low environment pressure.
Based on the above studies, the formation of a typhoon concentric eyewall is still debatable. Early studies on the concentric eyewall of typhoons have mostly applied to ideal models or ideal tests, and whether the results can be applied to actual typhoons remains to be further explored. Although recent studies have focused on observations or numerical simulations of real cases, it remains to be further studied whether the obtained conclusions are universal or not.
To better understand the formation of the concentric eyewall, the Weather Research and Forecast (WRF) mode was used in this study to numerically simulate Super Typhoon Muifa, and the numerical simulation data with high spatial and temporal resolution was used to diagnose and analyze the main physical mechanism for the formation of the outer eyewall.
2 Model and Data
replacement processes of a typhoon concentric eyewall. The numerical simulation of such processes not only can provide higher-resolution data than observation data, but can also achieve the purpose of research by controlling the parameters in the model. Hence, in this study, a numerical simulation was conducted on Super Typhoon Muifa, which formed to the east of the Philippines in 2011, to investigate the physical mechanism of the formation and replacement of the concentric eyewall. Hawkins (1983) suggested that the concentric eyewalls of some typhoons were caused by topographic forcing. The eyewall replacement of Muifa occurred on the ocean surface, avoiding the topographic influence.
2.1 Typhoon Muifa
In 2011, the No. 9 typhoon, Typhoon Muifa (1109), formed on the east ocean surface to the Philippines at 0600 UTC on July 28, and the central position was 11.7°N, 135.0°E. On July 30, the typhoon rapidly intensified from a tropical storm into a super typhoon. At 1800 UTC on July 30, the typhoon intensity reached its maximum. After that, the intensity of the typhoon decreased, and at 0000 UTC on August 1, the typhoon weakened into a strong typhoon. Muifa moved northward on August 2. After 1200 UTC on August 2, Muifa turned from the north to the west. On August 4, Muifa began to move to the northwest. On August 6, Muifa weakened into a typhoon moving northward. On August 7, Muifa weakened into a strong tropical storm. On August 8, Muifa landed on the northern part of the west coast of North Korea. On August 9, the typhoon weakened into a tropical depression in the northeastern part of China.
2.2 The WRF Model
In this study, the WRF model was used for simulation, and the simulated area adopted two-way quadruple nested mesh. In the following descriptions, D01 denotes the outermost coarse grid domain, D02 represents the second coarse grid domain, D03 stands for the third coarse grid domain, and D04 represents the innermost fine grid domain. D01 was centered at (132°E, 20°N), while the centers of D02, D03 and D04 were the same as the center of the typhoon at 0600 UTC on July 29 and moved with the typhoon. The horizontal resolutions of D01, D02, D03, and D04 were 45 km, 15 km, 5 km, and 1.667 km, respectively, with the numbers of grid points being 110×100, 103×97, 184×169, and 298×298, respectively. The simulation time of D01, D02, D03, and D04 lasted from 0600 UTC on July 29 to 1600 UTC on August 4. As pointed out by
1997) being the long wave radiation scheme, Dudhia (Dudhia, 1989) being the short wave radiation scheme and YSU (Hong, 2006) being the scheme for the boundary layer.
2.3 Data Sources
The initial field and lateral boundaries of the numerical model that were derived from the FNL data of the NCEP had a time interval of six hours and a horizontal resolution of 1°×1°. The observation data about the typhoon path and intensity that was extracted from the tropical cyclone optimal path data set of the Shanghai Typhoon Research Institute of the China
Meteorological Administration (Ying, 2014) was compared with the simulation results to verify the simulation effect of the model. The observed data of the precipitation rate were taken from the TRMM 2A12 data set
(http://trmm.gsfc.nasa.gov/publications_dir/multi_resource_tropical.html).
3 Simulation results of Typhoon Muifa
First, the typhoon motion path and intensity evolution simulated by the model were analyzed to verify the reliability of the model results. Then the high-resolution numerical
simulation data was used to diagnose and analyze the formation and replacement processes of the concentric eyewall in order to learn the features and evolution of the concentric eyewall during its formation and replacement processes.
3.1 Path and Intensity
Figure 1 shows the simulated and real tracks of the typhoon from 0600 UTC on July 29, 2011 to 1200 UTC on August 4, 2011 where the shading area denotes the sea surface
Figure 1. Simulated and real typhoon tracks from 0600 UTC on July 29, 2011 to 1200 UTC on August 4, with the time interval being 6 hours. ● denotes the simulated track, Δ represents the
real track, and the shading stands for the SST (unit: K).
August 4, indicating that the model accurately simulated the large-scale weather system that mainly determined the typhoon path (Goerss, 2006). This provided a more realistic large-scale environmental field for further discussion of the intensity and structural characteristics of the typhoon.
Figure 2a shows how the MWS provided by the Shanghai Typhoon Research Institute of China Meteorological Administration and the simulated MWS varied over time.
Figure 2. (a) Variation in the simulated and observed 10 m MWS (unit: m/s) over time and (b) Variation in the simulated MWS radius (unit: km) over time.
As shown in the figure, from 1800 UTC on July 29 to 1800 UTC on July 30, the measured and simulated MWS increased rapidly from 30 m/s to 65 m/s and above 50 m/s, respectively. The measured MWS decreased in the next 72 hours, and it was roughly reduced by 15 m/s. The MWS measured from 0600 UTC on August 1 to 0600 UTC on August 3 stayed at around 50 m/s. The simulated typhoon intensity continued to increase after 1800 UTC on July 30, and the MWS reached 57 m/s at 1200 UTC on July 31. The MWS did not change much from 1200 UTC on July 31 to 1200 UTC on August 1. The MWS decreased after 1200 UTC on August 1, and by 0000 UTC on August 3, the MWS declined to 41 m/s. Within 18 hours after 0600 UTC on August 3, the measured MWS decreased again, with a reduction of about 9 m/s. The MWS simulated from 0000 UTC on August 3 to 1800 UTC on August 3 increased slightly. The MWS increased significantly after 1800 UTC on August 3, while the measured intensity at this stage was maintained at around 45 m/s. The simulated MWS was greater than the measured MWS, which was greatly related to the constant sea surface temperature throughout the
actual typhoon. Although the specific intensity values of the simulated typhoon were different from that provided by the Shanghai Typhoon Research Institute of China Meteorological Administration, the MWS when the typhoon was strong was only 7 m/s smaller than that of the measured typhoon. After that, the intensity first weakened and then stayed constant for a period of time, The common feature was that the basic changes in the typhoon intensity were
successfully simulated, which provided reliable high-resolution simulation results for the follow-up analysis.
3.2 Formation and Replacement Processes of the Concentric Eyewall
There is currently no clear definition for the concentric eyewall of a typhoon. The definition of the concentric eyewall adopted in this study was based on the definition given by Willoughby et al. (1982). Around an eyewall, there is a strong precipitation ring accompanied by second-highest wind speed. Such inner and outer convection rings are called the concentric eyewall of typhoons. The following section describes how the dynamic evolution characteristics of the formation and replacement processes of the concentric eyewall were obtained by
analyzing how the spatial of the physical quantities of the typhoon varied over time.
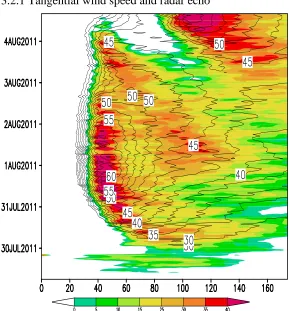
3.2.1 Tangential wind speed and radar echo
Figure 3. Variation in the averaged radial radar echo (represented by the shading, Z=3 km, unit: dBZ) as well as the averaged tangential wind speeds (represented by the contours, Z=3 km, unit: m/s) simulated along the azimuth over time.
convection began to be organized, forming an obvious eyewall and spiral rain band. The eyewall characterized by strong radar echo was gradually strengthened and contracted. At 0000 UTC on July 31, the eyewall was retracted to a radius of about 40 to 60 kilometers, the corresponding tangential wind speed slowly increased, and the isovelocity gradually expanded outward. At 0000 UTC on August 1, within a radius of about 100 kilometers to 120 kilometers, the radar echo began to form an area of second-highest value, the isovelocity expanded obviously outward, the area of second-highest wind speed gradually expanded, and the first concentric eyewall was formed. The area of second-highest wind speed was not obvious enough because the distance between the two eyewalls is too small. There was a weak echo between the two eyewalls, which was the moat area. At this time, the echo intensity of the outer eyewall was significantly smaller than that of the inner eyewall. After that, the echo of the inner eyewall gradually weakened, with the corresponding typhoon intensity decreasing as well. The outer eyewall gradually shrank inward, and the corresponding echo intensity first increased slightly and then decreased slightly, but the wind speed increases slowly. The moat area gradually became narrower. At 0000 UTC on August 3, the inner eyewall characterized by strong echoes was nearly disappearing, and the outer eyewall replaced the inner eyewall as the new eyewall, the radius of which was about 50 to 70 km. The entire process from the formation of the concentric eyewall to the replacement of the concentric eyewall lasted for 48 hours. According to the real-time ground precipitation rate (in Figure 4a1 and 4b1), the inner eyewall was nearly disappearing at 1300 UTC on August 1, while the simulated inner wall was clearly visible and strong. This indicates that the simulated
concentric eyewall was also about 16 hours behind the actual situation, which corresponds to the conclusion that the simulated typhoon intensity lagged behind the actually measured typhoon by about 16 hours.
(a1) (b1)
(a2) (b2)
(km)
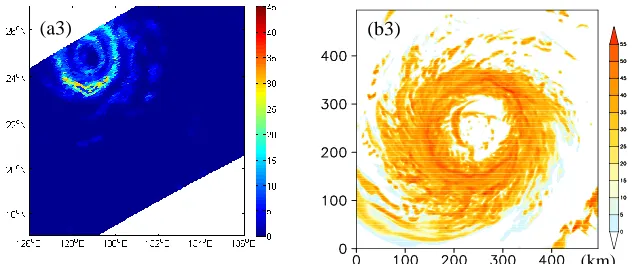
Figure 4. The TRMM 2A12 surface precipitation (unit: mm/h) (left column) and the simulated radar echo (right column) (Z=50 m, unit: dBZ), where (a1) and (b1) represent the situation at 1300 UTC on August 1, (a2) and (b2) denote the situation at 1300 UTC on August 3, and (a3) and (b3) illustrate the situation on 1200 UTC on August 4.
The concentric eyewall appeared again after the first concentric eyewall replacement was completed. Starting from 0000 UTC on August 3, the area of second-highest radar echo began to appear within the radius of 140 km to 160 km. As the isovelocity extended obviously outward, an obvious area of second-highest wind speed appeared, indicating that the outer eyewall was formed within a radius of 140 km to 160 km. At this time, the echo intensity of the outer eyewall was slightly smaller than that of the inner eyewall. The echo intensity of the moat area was significantly weaker than the intensity at the first time, and the width was significantly larger than that in the first moat area. At 1200 UTC on August 3, the echo of the inner eyewall was slightly enhanced, and the echo of the outer eyewall was also enhanced and inwardly contracted. Since the intensity of the outer eyewall was larger than that of the inner eyewall, the intensity of the typhoon was mainly determined by the outer eyewall. Afterwards, the echo intensity of the inner eyewall continued to slightly increase for 12 hours before being weakened and contracting slightly inward, while the echo of the outer eyewall continued to increase and contract inward. According to the real-time ground precipitation rate (in Figure 4a2 and 4b2), the inner eyewall was replaced by the outer eyewall at 1300 UTC on August 3, and the simulated inner wall was still clearly visible. At 1200 UTC on August 4, the simulated inner eyewall almost disappeared (in Figure 4b3), the outer eyewall replaced the inner eyewall as the new eyewall, and the real-time ground precipitation rate (in Figure 1a3) implied that the third concentric eyewall of the typhoon had been formed at this time. The lag in the second formation of the outer eyewall was related to the lag in its first formation. The radius, width, and intensity of the new eyewall formed by the second replacement were obviously larger than those of the new eyewall that formed during the first replacement were.
To analyze the tangential wind field and radar echo distribution characteristics of the concentric eyewall in a more comprehensive and detailed way, a cross section of the tangential wind speed and the radar echo was drawn (Figure 5).
(a3) (b3)
Figure 5. Cross sections of the average tangential wind speed (represented by the isolines, unit: m/s) and radar echo (represented by the shading, unit: dBZ) simulated along the azimuth from 0000 UTC on July 31 to 0600 UTC on August 4, with the time interval being 6 hours.
Since the concentric eyewall was not formed until 0000 UTC on August 1, the changes in the tangential wind field and the radar echoes were analyzed one day in advance (starting at 0000 UTC on July 31). The graphs in Figure 5 show the evolution of the tangential wind field and the radar echo over time. At 0000 UTC on July 31, a maximum tangential wind speed of about 53 m/s appeared at a height of about 0.5 km. The isovelocity with a value of 47 m/s extended to a height of 2.5 km, while the radial wind speed extended to a radius of about 70 km in the boundary layer, and the tangential wind gradient on the inner side of the maximum tangential wind speed was larger than that on the outer side. The eyewall area was filled with strong echo, while the echo in the outer rain band was relatively weak. In the next 12 hours, as the typhoon intensity increased, the tangential wind speed increased as well, with the maximum tangential wind speed increasing to 59 m/s or more. The 47 m/s isovelocity extended to a height of 11 km, and the tangential wind gradients on both sides of the maximum tangential wind speed increased significantly as well. With the increase of the typhoon intensity, the radar echo intensity in the inner core of the typhoon was also enhanced, but the echo value of the rain band outside the typhoon was not significantly enhanced, so the 47 m/s isovelocity extended to a height of only about 15 km in the radial direction in the boundary layer. At 1800 UTC on July 31, the
convective system in the outer rain band was clearly organized. At 1200 UTC on August 1, there was no significant change in the maximum tangential wind speed, nor was there an obvious change in the extension height of the 47 m/s isovelocity. However, the 47 m/s isovelocity extended significantly to the place with a radius of 140 km along the radial direction in the boundary layer, indicating that as the convective system in the outer eyewall developed, the wind speed in the lower layer of the corresponding area was also significantly enhanced. At 1200 UTC on August 1, the radar echo intensity corresponding to the inner eyewall decreased, the area of the zone surrounded by the 59 m/s isovelocity decreased, and the tangential wind gradient on the inner side of the maximum tangential wind speed began to decline. As the outer eyewall
developed and shrank inward, the tangential wind speed of the lower layer in the corresponding area was slightly enhanced. At 1800 UTC on August 2, as the intensity of the inner eyewall continued to decrease, the strong echo zone nearly disappeared. When the extension height of the 47 m/s isovelocity decreased to about 6 km, the echo intensity corresponding to the outer eyewall decreased, the corresponding tangential wind speed reduced slightly and the outer eyewall
replaced the inner eyewall as the new eyewall. The maximum tangential wind speed
corresponding to the outer eyewall gradually increasing to above 59 m/s. At 0600 UTC on August 4, the MWS corresponding to the outer eyewall continued to increase and it gradually moved inward, while the MWS and strong echo corresponding to the inner eyewall gradually disappeared. During the formation and replacement of the second outer eyewall, the wind speed in the moat area was smaller than that corresponding to the two eyewalls. This feature gradually disappeared with the increase of the height. The echo in the moat area was comparatively weak, which was especially true when the moat area was wide and the outer eyewall was strong.
According to the above analyses, the obvious outward expansion of the isovelocity in the lower troposphere was the early signal of the formation of the outer eyewall in both the first and second formation of the outer eyewall. This conclusion is consistent with the conclusion gained by Huang et al. (2012) who conducted a numerical simulation study on the concentric eyewall of Typhoon Sinlaku (2008) and indicated that the outward expansion of the wind field in the
boundary layer was the early signal of the formation of the concentric eyewall. Sun (2012) pointed out that the expansion of a vortex wind field is caused by the release of peripheral convective latent heat.
Figure 6. Cross sections of the radius and height of the average vertical velocity (represented by the isolines, unit: m/s) and the radial wind speed (represented by the shading, unit: m/s) simulated along the azimuth from 0000 UTC on July 31 to 1200 UTC on August 4, with the time interval being 6 hours.
As shown in Figure 6, at 0000 UTC on July 31, the outside of the eyewall in the
boundary layer was dominated by the inflow, and the inner side was dominated by the outflow. This indicates that the airflow on both sides of the eyewall converged to the eyewall, the
maximum inflow was located substantially below the eyewall, and the strong ascending motion in the lower part of the eyewall corresponded to a strong outflow (within the height of 1 km to 3 km). There was no obvious inflow and outflow in the middle layer of the troposphere. The upper layer of the troposphere was dominated by the outflow, with the strong outflow located above the outer side of the strong ascending motion in the upper layer. The outflow in the peripheral
convective rain band mainly occurred in the height range of 6 km to 10 km, and its intensity was much smaller than that of the outflow in the upper layer of the eyewall. In the next 18 hours, the range of the inflow velocity greater than 20 m/s in the boundary layer was expanding, the range with the outflow velocity greater than 4 m/s was expanding in the upper troposphere, and the
outflow velocity within the height range of 1 to 3 km was increasing. This indicates that the overall intensity of the inflow and outflow of the eyewall was enhanced, and the height of the outflow in the peripheral convective rain band gradually increased. From 0000 UTC to 1200 UTC on August 1, both the inflow and outflow of the upper and lower layers of the inner eyewall were reduced, and the outflow from the height of 1 km to 3 km decreased as well. However, the isovelocity with an inflow velocity of −16 m/s in the boundary layer extended obviously outward, the area enclosed by the 4 m/s outflow isovelocity corresponding to the upper layer of the outer eyewall was obviously enlarged, and the outflow corresponding to the outer eyewall within the height range of 1–3 km was enhanced. This implies that both the inflow and outflow of the upper and lower layers of the outer eyewall were increasing. At 1800 UTC, the inflowing and
outflowing of the inner eyewall decreased, and the outflowing of the outer eyewall decreased slightly, but the inflowing of the lower layer of the outer eyewall continued to increase and a strong inflow center appeared. At 0000 UTC on August 2, the inflow and outflow of the inner eyewall continued to decrease, and the strong inflow center corresponding to the boundary layer disappeared. The inflow in the boundary layer of the outer eyewall was further enhanced. From 0000 UTC on August 2 to 0000 UTC on August 3, the second outer eyewall began to form, the inflow and outflow of the inner eyewall almost disappeared, and the outer eyewall gradually shrank into a new eyewall, with its corresponding inflow and outflow intensity slightly reduced. Within the following 24 hours, the inflow intensity of the boundary layer corresponding to the inner eyewall continued to decrease, but the corresponding ascending motion was enhanced, indicating that the energy strengthening the eyewall in this stage mainly originated from the eye area and the ocean surface. This is discussed in another paper (Liu et al., manuscript in review). The inflow and outflow of the outer eyewall were increasing, with a strong inflow appearing in the boundary layer. After 0000 UTC on August 4, the inflow and outflow corresponding to the inner wall gradually disappeared. Moreover, once the second outer eyewall matured, there was a significant inflow of air at the upper level of the moat area.
Figure 7. Variation in the average radial (a) vertical velocity (z=1 km, unit: m/s), (b) total amount of hydrometeors (0<z≤5 km, unit: g/kg), and (c) potential vortex (z=1 km, unit: PVU) simulated along the azimuth over time.
It can be seen from Figures 7a and 7b that before July 30, due to the small typhoon intensity, the vertical motion characteristics of the typhoon were not obvious and the scattered weak convection led to the scattered distribution of the hydrometeors. After July 30, with the organization of the convection, there was a significantly strong ascending motion in the eyewall, with a large amount of hydrometeors. From July 30 to August 1, the hydrometeors were mainly concentrated within a radius of 40 kilometers to 60 kilometers and the strong ascending motion was primarily concentrated in the inner side of the area with a large amount of hydrometeors. Starting from around August 1, the second-highest ascending motion center began to appear within a radius of 70 km to 100 km in the outer rain band, and the corresponding content of hydrometeors increased. There was a descending motion between the two strong ascending motion centers with a relatively small amount of hydrometeors. The structural features of the vertical motion and the amount of hydrometeors illustrated the formation of the first outer eyewall. After 1200 UTC on August 1, the ascending motion of the inner eyewall and the amount of hydrometeors decreased significantly and the corresponding typhoon intensity
decreased. The strong ascending motion corresponding to the outer eyewall gradually contracted inward and its intensity had a slight decrease after it slightly increased two days prior. As the outer eyewall was retracted, the area of the weak descending motion was gradually reduced. At 0000 UTC on August 3, the strong ascending motion corresponding to the inner eyewall
disappeared, that corresponding to the outer eyewall gradually contracted, and the outer eyewall replaced the inner eyewall.
At around 0000 UTC on August 3, the center of second-highest hydrometeors began to appear within a radius of 140 km to 160 km, there was a strong ascending motion center on the
inner side, and there was almost no hydrometeor in the moat area. This further explains the fact that the concentric eyewall appeared again after the first replacement of the concentric eyewall. Within the following 24 hours, the strong ascending motion corresponding to the inner eyewall was slightly enhanced, while the outer eyewall was significantly developed and contracted. At 0000 UTC on August 4, the strong ascending motion corresponding to the inner eyewall began to weaken and the outer eyewall continued to develop. At 1200 UTC on August 4, the simulated inner eyewall almost disappeared and the outer eyewall replaced the inner eyewall as the new eyewall.
For a more detailed analysis of the vertical motion characteristics, a cross section of the vertical velocity was plotted (Figure 6). As shown in the figure, the vertical motion distributed on the cross section has multiple high-value areas (Figure 6). Black et al. (1996) also found similar structures by observing and simulating mature hurricanes. Samsury and Zipser (1995), May and Rajopadhyaya (1991), and Fierro et al. (2006, 2008) also found similar structures when studying tropical ocean squall lines. They pointed out that the high-value areas of the ascending motion in the lower layers were mainly caused by dynamic friction, while the high-value areas of the ascending motion in the upper layers were the result of water unloading and buoyancy.
From 0000 UTC to 1800 UTC on July 31, the isovelocity with a vertical velocity of 18 m/s in the eyewall extended obviously to the lower layer, the vertical motion in both the upper and low layers of the eyewall was enhanced, and the vertical velocity in the outer rain band was weak without obvious change. From 0000 UTC on August 1 (the formation of the first outer eyewall) to 0000 UTC on August 3, the vertical velocity of the inner eyewall was significantly reduced, while the vertical motion of the outer eyewall was first slightly enhanced and then slightly weakened. After 0000 UTC on August 3 (the formation of the second outer eyewall), the ascending motion in the upper and lower layers corresponding to the inner eyewall was first enhanced and then reduced, while the ascending motion corresponding to the outer eyewall was being constantly enhanced. At 1200 UTC on August 4, as the inner eyewall disappeared, the corresponding strong ascending motion center disappeared, the outer eyewall became the new eyewall, and the moat area became the new eye area.
During the entire process, both the upper and lower layers of the typhoon eye area were dominated by descending motion. Robert (2007) pointed out that a moat area has the same characteristics as an eye area. In the early stage of the first eyewall replacement, the middle and lower layers of the moat area were dominated by weak descending motions. Later, as the outer eyewall gradually moved toward the inner eyewall, the moat area narrowed and the weak
descending motion gradually disappeared. In the early stage of the formation of the second outer eyewall, the moat area was dominated by the weak ascending motion. Then, with the
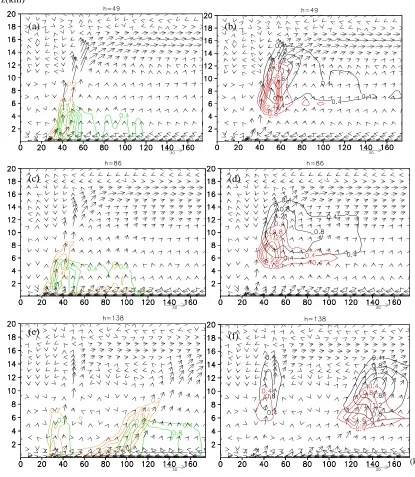
Figure 8. Cross sections of the radius and height of the vector field (unit: m/s) composed by the average vertical velocity and radial wind speeds simulated along the azimuth, where the yellow isoline denotes the cloud water (unit: g/kg), the green isoline represents the rain water (unit: g/kg), the red isoline shows the graupel (unit: g/kg), the black isoline denotes the sum of snow and ice cloud (unit: g/kg), (a) and (b) represent the situation at 0600 UTC on July 31, (c) and (d) denote the situation at 1900 UTC on August 1, (e) and (f) illustrate the situation on 2300 UTC on August 3.
Figure 8 shows the vertical distribution characteristics of the hydrometeor content. It can be seen from the figure that during the entire process, the graupel particles were mainly
concentrated in the strong ascending motion of the eyewall, with the maximum content locating at a height of about 6 km, and the content of graupel particles below 6 km rapidly decreased. This indicates that the graupel particles melted on the 0-degree layer, and the maximum content
(a) (b)
(c) (d)
(e) (f)
of rainwater was below the area where the maximum content of the graupel particles were located, indicating that the amount of rainwater was melted from the graupel particles. The snow and cloud ice were mainly concentrated in the strong ascending motion of the upper troposphere, and their distribution extended outwards due to the outflow, with the maximum value located at a height of about 11 km. The area with the maximum content of snow and cloud ice was above the area with the maximum content of graupel, indicating that the abundant graupel was caused by snow and cloud ice. As shown in the figure, with the formation and development of the outer eyewall, the corresponding amount of hydrometeors in the inner eyewall area was reduced, while the corresponding hydrometeor content in the outer eyewall area increased, which implies that with the formation and development of the outer eyewall, the strength of the inner eyewall declined.
3.2.4 Potential vortex
Liu et al. (2015) used model output data to analyze the structural and evolution
characteristics of potential vortex towers in different development stages of the typhoon. They pointed out that the evolution of the vortex anomalies over time in the typhoon core area in the middle and lower troposphere was in the same phase as the variation in the typhoon intensity over time, and the structural characteristics of the potential vortex in the lower layer were good indicators for the different development stages where the typhoon intensity was rapidly enhanced.
Therefore, by analyzing the structural characteristics of the potential vortex before the formation and during the formation as well as during the replacement of the concentric eyewall, it was found that the significant increase in the low layer potential vortex in the outer rain band had a good correspondence to the formation of the outer eyewall.
Ertel’s potential vortex served as the research object in this study. Its expression is , where is the virtual potential temperature, and is the absolute vorticity vector, which is expressed as , where represents the geostrophic angular velocity and represents the three-dimensional wind speed vector.
(km)
Figure 9. Cross sections of the radius and height of the averaged potential vortex simulated along the azimuth (unit: PVU). The time lasted from 0000 UTC on July 31 to 1200 UTC on August 4, with a time interval of 12 hours.
Figure 9 shows how the vertical cross section of the radius and height of the averaged potential vortex that was simulated along the azimuth varied over time. The variation of the vortex over time is clearly illustrated in the figure. At 0000 UTC on July 31, the distribution characteristics of the potential vortex in the upper troposphere were completely different from those in the middle and lower troposphere. The value of the potential vortex in the upper layer was much larger than that in the middle and low layers. The potential vortex in the upper layer had a small horizontal gradient but a large vertical gradient. Compared with the upper
troposphere, the distribution characteristics of the potential vortex in the middle and lower troposphere were relatively complicated. The center of the potential vortex with a large value in the middle and lower troposphere was located on the inner side of the eyewall, showing a hollow feature, with the maximum potential vortex located at a height of about 8 km. According to Nolan (2001), the hollow feature of the potential vortex structure was a necessary condition for the typhoon to be unstable, so the intensity of the typhoon was enhanced. The potential vortex in the outer rain band was weak due to the relatively weak convective activities. At 1200 UTC on July 31, with the increase of the typhoon intensity, the potential vortex in the middle and lower layers in the inner core of the typhoon was significantly enhanced, and the high-value potential vortex in the upper layer in the typhoon eye center began to pass downward, but the potential vortex in the outer rain band was still weak. At 0000 UTC on August 1, the potential vortex in the middle and lower troposphere of the core region continued to increase, and the high-value potential vortex in the upper layer of the eye core continued to pass downward. The potential vortex in the outer rain band began to change significantly; that is, the potential vortex in the middle layer was enhanced with a center of second-highest potential vortex formed, and a center of second-highest potential vortex appeared in the lower layer. The centers of second-highest potential vortex that were found in the middle and lower layers were located inside the outer eyewall, which indicates a correlation between the enhanced potential vortex in the peripheral rain band with the outer eyewall formed at this time.
At 1200 UTC on August 1, the potential vortex in the middle and lower layers on the inner side of the inner eyewall decreased, with the potential vortex in the middle layer decreasing the most significantly. The potential vortexes in the upper, middle, and lower layers of the eye center all increased, the potential vortex on the inner side of the outer eyewall was further strengthened, and the high-value centers of the potential vortexes corresponding to the middle and lower layers were retracted with the contraction of the outer eyewall. Within the next 24 hours, the potential vortex on the inner side of the inner eyewall continued to decline while the potential vortex in the typhoon eye was further enhanced. Additionally, the potential vortex on the inner side of the outer eyewall continued to increase and the center of the vortex with a large value continued to retract. At 1200 UTC on August 2, the center of the vortex with a large value at the inner side of the outer eyewall was combined with the large vortex region in the inner core area. The intensity of the inner eyewall decreased, the hollow features of the potential vortex in the inner core region gradually became insignificant. From 0000 UTC on August 3 to 0000 UTC on August 4, with the formation and development of the second outer eyewall, the potential vortexes in both the middle and lower layers of the outer rain band were strengthened and the center of second-highest potential vortex appeared. This further demonstrates the
peripheral rain band and the formation of the outer eyewall. In this process, as the strength of the inner eyewall increased slightly, the potential vortex on the inner side of the inner eyewall also showed a small increase. At 1200 UTC on August 4, the potential vortex on the inner side of the outer eyewall was significantly enhanced, while that on the inner side of the inner eyewall decreased as the intensity of the inner eyewall declined. In addition, potential vortex below the height of 4 km in the typhoon eye area was enhanced, while that within the range of 9 to 15 km was significantly weakened.
It is thus clear that the strength, structural characteristics, and changes of the potential vortex inside the typhoon had great referential meaning for the strength and structural changes of the typhoon, especially for the significant correlation between the apparent increase of the potential vortex in the peripheral rain band and the formation of the outer eyewall.
4 Conclusions
In this study, the WRF model was used to numerically simulate Super Typhoon Muifa for the diagnosis and analysis of the formation and replacement processes of its concentric eyewall. The study emphasized the exploration of the structural features of the internal physical quantity fields during the formation and replacement processes of the concentric eyewall.
By effectively simulating the intensity and path of the typhoon, the model reproduced the two concentric eyewalls that occurred during the development of Super Typhoon Muifa. The first concentric eyewall of the typhoon began to form at around 0000 UTC on August 1. After the outer eyewall was formed, the typhoon intensity first increased and then decreased. As the outer eyewall was retracted, the intensity of the inner eyewall gradually decreased. The first replacement process of the concentric eyewall was completed at 0000 UTC on August 3. The second concentric eyewall was formed at about 0000 UTC on August 3, the intensity of which was constantly being strengthened and the eyewall of which was gradually retracting. The intensity of the inner eyewall was first enhanced for 24 hours before it weakened. At 1200 UTC on August 4, the second replacement of the concentric eyewall was completed. The radius of the first outer eyewall was smaller than the radius of the second outer eyewall.
Based on the obtained accurate numerical simulation results, the dynamic structural features of the formation and replacement of the concentric eyewall of the typhoon were diagnosed from the perspectives of the tangential wind speed, radar echo, radial wind speed, vertical velocity, and potential vortex. The main conclusions are as follows:
(1) The obvious outward expansion of the isovelocity in the lower troposphere was the early signal of the formation of the outer eyewall. After the outer eyewall formed, there was a center of second-highest tangential wind speed in the corresponding area. The second-highest wind speed increased as the strength of the outer eyewall increased, and the position of the center of second-highest wind speed retracted with the retraction of the outer eyewall. The tangential wind speed of the moat area was smaller than that corresponding to the concentric eyewall and this feature gradually disappeared with the increase of the height. The echo in the moat area was weak, which was particularly evident when the moat area was relatively wide and the outer eyewall was comparatively strong.
(2) With the formation and development of the outer eyewall, the intensity of the inflow in the boundary layer corresponding to the inner eyewall was reduced, the intensity of the
to the outer eyewall were enhanced. After the second outer eyewall matured, there was a significant inflow of the airflow at the upper layer of the moat area.
(3) Once the outer eyewall formed, a large amount of hydrometeors appeared in the corresponding area, and there was a strong ascending motion inside the corresponding area. The strength of the ascending motion and the amount of hydrometeors increased as the outer eyewall increased. When the moat area was relatively wide, the divergent airflow generated by the developed outer eyewall in the upper layer would produce a significant descending motion in the moat area.
(4) The strength, structural characteristics, and changes of the potential vortex inside the typhoon had a great referential meaning for the strength and structural changes of the typhoon, especially for the significant correlation between the apparent increase of the potential vortex in the peripheral rain band and the formation of the outer eyewall.
Acknowledgments and Data
The work is supported by National Science Foundation of China program ( grant: 41875060 ). The FNL data of the NCEP are available at the National Center for Atmospheric Research, Computational and Information Systems Laboratory
(https://doi.org/10.5065/D6M043C6). The tropical cyclone optimal track data set are archived in the Shanghai Typhoon Research Institute of the China Meteorological Administration
(http://tcdata.typhoon.org.cn/en/zjljsjj_zlhq.html). The observed data of the precipitation rate were taken from the TRMM 2A12 data set
(http://trmm.gsfc.nasa.gov/publications_dir/multi_resource_tropical.html).
References
Craig G C, (1996), numerical experiments on radiation and tropical cyclones, Q J R Meteorol Soc, 122,415-422.
Didlake J R, Robert A. Houze J R. (2011), Kinematics of the Secondary Eyewall Observed in Hurricane Rita(2005)[J]. J. Atmos. Sci., 68:1620-1636.
Dougherty F c, Kimball S K.(2006), The sensitivity of hurricane simulations to the Distribution of vertical levels in MM5[J].Mon Wea Rev, 134(7),1987-2008.
Dudhia J.(1989), Numerical study of convection observed during the winter monsoon
experiment using a mesoscale two-dimensional model[J].J Atmos Sci, 46(20): 3077-3107.
Emanuel K A. (1986), An air-sea interaction theory for tropical cyclone, Part I:Steady state maintenance[J].J Atmos Sci, 43(6):585–604.
Emanuel, K. A., C. DesAutels,C . Holloway, and R. Korry.(2004), Environmental control of tropical cyclone intensity.J.Atmos.Sei.,61,843-855
Hawkin J D, Helveston M. (2008), Tropical cyclone multiple eyewall characteristics. Extended Abstracts,28th Conf. on Hurricanes and Tropial Meteorology, Orlando, FL, Amer Metero Soc, 14B.1.
Hawkins H F. (1983), Hurricane Allen and island obstacles[J]. J. Atmos. Sci., 40:1360- 1361.
Hill K A, Lackmann G M. (2009), Influence of environmental humidity on tropical cyclone size[J]. Mon Wea Rev, 137, 3294-3315.
Hong S Y, Nong Y, Dudhia J. (2006), A New Vertical Diffusion Package with an Explicit Treatment of Entrainment Processes[J].Mon Wea Rev,134(9),2318-2341.
Huang Y-H, Montgomery MT, Wu C-C. (2012), Concentric eyewall formation in Typhoon Sinlaku (2008). Part II: Axisymmetric dynamical processes. Journal of the Atmospheric Sciences 69:662–674.
Judt F.Chen S S. (2010), Convectively generated potential vorticity in rainbands and formation of the secondary eyewall in hurricane Rita of 2005..J Atmos Sci, 67. 3581-3598.
Kain J S,Fritsch J M.(1990), A one-dimensional entraining/detraining plume model and itsapplication in convective parameterization[J].J AtmoSci, 47(23):2784-2802.
Kuo H C, Lin L Y, Chang C P, et al. (2004), The formation of concentric vorticity structures in typhoons[J]. J Atmos Sci, 61:2722-2734.
Kuo H C, Chang C P, Yang Y T, et al.(2009), Western North Pacific typhoons with concentric eyewalls. Mon Wea Rev, 137:3758-3770.
Liu Y D, (2019), The concentric eyewall formation Mechanism of Super Typhoon Muifa (1109), Journal of Meterorological Search, in view.
Lord, S J, Willoughby, H. E., Piotrowicz, J W. (1984), Role of parametrized ice-phase
microphysics in an axisymmetric, non-hydrostatic tropical cyclone model. J Atmos Sci, 41,2836-2848
Mlawer E J, Taubman S J, Brown P D, et al.(1997), Radiative transfer for inhomogeneous atmosphere: RRTM, a validated correlated-k model for the longwave[J].J Geophys Res, 102(D14):16 663-16 682.
Molinari, J. and Vollaro,D.,(1990), External infuences on Hurricane intensity. Part II: Vertical structure and response of the hurricane vortex. J. Atmos. Sci., 47,1902-1918
Molinari J, Dudek M.(1992), Parameterization of convective precipitation in mesoscale numerical models: A critical review[J].Mon Wea Rev, 120(2):326–344.
Montgomery M T, Kallenbach R J.(1997), A theory for vortex Rossby-waves and its application to spiral bands and intensity changes in hurricane[J]. Quart J Roy Meteor Soc, 123, 435-465.
Nong S, Emanuel K A. (2003), A numerical study of the genesis of concentric eyewalls in hurricane. Quart. Roy Meteor Soc[J], 129, 3323-3338.
Robert A, Chen S S, Smull B F,et al. (2007), Hurricane intensity and eyewall replacement [J]. Science, 315:1235-1239.
Sun Y. (2012), Numerical simulation on the concentric Eyewall Formation of Typhoon Morakot [D]. Beijing: Peking University.
Terwey, W, D, and M T. montgomery.,Modeled secondary eyewall and Spiral band
dynamics.27th AMS Conf.on Hurricane and Tropical Meteor. http: //ams. confex.coln /ams/Pdfpapers/108439.Pdf
Terwey W D, Montgomery M T. (2008), Secondary eyewall formation in two idealized, full-physics modeled hurricanes[J]. Geophys Res, 113, D12112.
Wang Y.(2002), An explicit simulation of tropical cyclones with a triply nested movable mesh primitive equation model:TCM3.part2:Model refinement and sensitivity to cloud
microphysics parameterization. Mon Wea Rev,130.3022-3036
Willoughby H E, Clos J A, Shoreibah M G. (1982), Concentric eyewalls, secondary wind maxima, and the evolution of the hurricane vortex. J Atmos Sci, 39:395-411.
Willoughby, H. E., (1998), Tropical cyclone eye thermodynamics. Mon. Wea. Rev., 126, 3053-3067.
WU Xue; DUAN Yihong, (2013), Analysis on the Intensity Change in an Abnormal Weakening of Super Typhoon Muifa, Meteorological Monthly, 39(8): 965-974
Ying, M., W. Zhang, H. Yu, X. Lu, J. Feng, Y. Fan, Y. Zhu, and D. Chen, (2014), An Overview of the China Meteorological Administration tropical cyclone database[J]. J Atmos Oceanic Technol, 31, 287-301.
Zhou X, Wang B.(2011), Mechanism of concentric eyewall replacement cycle and associated intensity change[J]. J Atmos Sci,68:972-988.