Geospeciation of arsenic using MINTEQA2
for a post-mining lake
S.A. Sari*, Z. Ujang** and U.K. Ahmad*
*Department of Chemistry, Faculty of Science, Universiti Teknologi Malaysia, 81310 Skudai, Johor, Malaysia (E-mail:[email protected])
**Institute of Environmental and Water Resource Management, Faculty of Civil Engineering, Universiti Teknologi Malaysia, 81310 Skudai, Johor, Malaysia (E-mail:[email protected])
AbstractThe objective of this study was to investigate the cycling of arsenic in the water column of a post-mining lake. This study is part of a research project to develop health risk assessment for the surrounding population. Inductively Coupled Plasma-Mass Spectrophotometer (ICP-MS) and Capillary Electrophoresis (CE) have been used to analyze the total amount and speciation, respectively. A computer program, called MINTEQA2, which was developed by the United States Environmental Protection Agency (USEPA) was used for predicting arsenic, iron, and manganese as functions of pH and solubility. Studying the pH values and cycle of arsenic shows that the percentage of bound arsenate, As(V) species in the form of HAsO2
4 increases with range pH from 5 to 7, as well as Fe(II) and Mn(II). As expected phases of arsenic oxides are FeAsO4and Mn3(AsO4), as a function of solubility, however none of these phases are over saturated and not precipitated. It means that the phases of arsenic oxides have a high solubility.
KeywordsCycling of arsenic; MINTEQA2; pH; post-mining lake water; solubility
Introduction
Pollution in post-mining lakes is a major issue particularly relating to the water quality. Over the past two decades, numerous studies have concluded that the largest sources of pollution in post-mining lakes, which have been released during and after mining activities are heavy metals and metalloids, such as chromium, cobalt, copper, iron, manganese, zinc, and arsenic (Yusofet al., 1996; Mogensen et al., 2001). It has been reported that the exploitation of gold and base-metal deposits and the attendant oxidation of arsenic-bearing ore and minerals have been highlighted as a cause of arsenic contamination of surface drainage and groundwater in several countries (Carillo and Drever, 1998; Werneret al., 2001). It has been cited that a natural concentration of arsenic range of 1 – 10mg/L for uncontaminated waters, rising to 0.1 – 5.0 mg/L in many mining areas (Fergusson, 1990).
Scientifically, the toxicity of arsenic is species dependent. Inorganic arsenic is more toxic than organic arsenic. Association between acute and long-term exposures of humans to the inorganic arsenic compounds and various forms of cancer and other health problems have been well documented. Symptoms of chronic arsenic poisoning have been recorded in populations reliant on water supplies containing more than 50mg/L arsenic in several countries, including Chile, Mexico, Taiwan, India and Thailand (Williams, 2001). This value currently constitutes the permissible limit of the European Union (EU), the United States Environmental Protection Agency (USEPA) and many other countries with respect to arsenic in potable water (WHO, 2004). Epidemiological evidence of adverse effects at lower exposure level has, however, prompted the World Health Organization (WHO) to promote an interim guideline of 10mg/L (WHO, 2004). In contrast, the effec-tual actions of arsenic species as chemotherapeutic anticancer agents have also been
Water
Science
&
T
echnology
Vol
54
No
11
–
1
2
p
p
289–29
9
Q
IWA
P
ublishing
2006
289
reported from epidemiological or clinical studies (Who and Ho, 2004). Because the type of arsenic species reflects the level of hazard, hence the motivation of this study was to determine the amount of arsenic species in a post-mining lake.
The cycling of arsenic through the environment is accomplished by a combination of many different processes that are occurring simultaneously and continuously. In recent years, it has been shown that large quantities of arsenic in various chemical forms and oxidation states are released into water bodies via mining operations. Once released into bodies of water, most of these chemical species of arsenic enter into the methylation/ demethylation cycle, but some are bound to sediments, or taken up by biota where they may undergo further metabolic conversion to other organoarsenicals and depending on a number of interactive factors, exert biological toxicity (Fowler, 1983). To properly appreciate the role of arsenic in the post-mining lake, it is necessary to review its environmental reactions. The environmental chemistry of arsenic is essentially that of inorganic arsenic and its simpler methylated forms. Arsenic is found to a large extent in ores and in aquatic systems as the inorganic As(III) and As(V) acids. Arsenous acid and arsenic acid are reasonably water soluble and depending upon pH, can be present in a number of ionic forms (Braman, 1983).
Arsenic is recycled in the surface and near-surface environment and adsorbed onto different mineral surfaces. Iron oxyhydroxides are well known for being very good adsorbing substrates for arsenic. Adsorption is a major natural control on the distribution of arsenic, and it is especially important in mining areas where arsenic and other pollu-tants are being released to the environment (Cullen and Reimer, 1989;Yusofet al., 1996; Mogensen et al., 2001; Williams, 2001). Adsorption of arsenic onto iron oxyhydroxide surfaces depends on pH and oxidation state. It has been shown that As(V), arsenate is more strongly adsorbed than As(III), arsenite (Cullen and Reimer, 1989). Arsenic can either be immobilized through adsorption-coprecipitation with iron and manganese under oxidizing conditions, or mobilized when iron and manganese are dissolved under reducing conditions within oxygenated zones (surface water), arsenate is stable and may sorb-coprecipitate with iron and manganese oxide if present.
In this study, a computer program, called MINTEQA2 was used to predict the release of arsenic from the different depths of post-mining lake water. The role of iron and manganese in relation to arsenic was also investigated. For this purpose, therefore, it assumed that arsenic content in the lake water is alternately in the form of FeAsO4.2H2O
and Mn3(AsO4)2.8H2O. A further assumption included equilibrium condition between
iron, manganese and the depth of the lake water. The range of sampled water depths from surface to 70 m, combined in the MINTEQA2 model, could be allowed for this assumption.
Methods
Description of sampling area
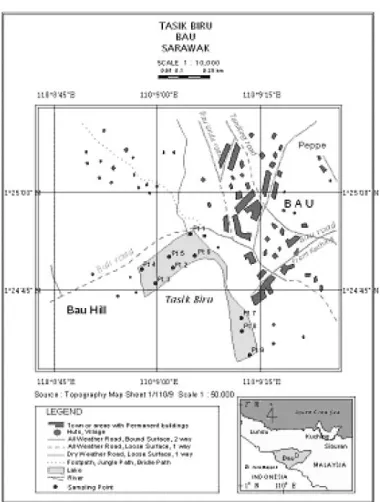
Bau is one of the 28 districts in Sarawak. It is situated in the western part of the state of Sarawak in Malaysia and is linked by approximately 35 km of winding road to the state capital, Kuching. It has an area of 884.40 km2sharing a common border with Kalimantan Barat, Indonesia. The district capital is Bau town, which is known as the gold town of Sarawak, due to its rich gold ore deposits and gold-mining activities in the past. Sampling was performed at nine points in Tasik Biru, Bau, Sarawak as shown in Figure 1. Sampling points, points 2 – 4 were situated near the edge of the lake, approximate one meter inward. In addition, points 5 – 8 were situated in the mid part of the lake, with point 9 at a point very close to the adjoining inlet of Sungai Bau and point 1 was located close to the adjoining outlet of Sungai Bau.
S.A.
Sari
et
al.
Sample preparation
Samples of the lake water were performed at nine sampling sites and taken at 5 m depth to a maximum depth of 70 m and immediately preserved with concentrated nitric acid (HNO3) to pH less than 2. Samples were taken every six months with four different
sampling periods, i.e. March 2003, August 2003, February 2004, and September 2004. The depths were measured using Bathy 500 MF echo sounder, meanwhile the position were acquired using Garmin 12XL (Handled GPS) and also HYDROpro navigation as a hydro-graphic software to manage all data. Total arsenic, iron, and manganese were measured using an Inductively Coupled Plasma-Mass Spectrophotometer (ICP-MS) ELAN 6000 (Perkin-Elmer SCIEX, USA) instrument and the species were determined using an HP3D Capillary Electrophoresis (CE) (Agilent Technologies, Waldbronn, Germany). Tempera-ture and pH were performed on site using water quality monitoring system, Horiba U-22XD.
Description of MINTEQA2 model
MINTEQA2 is a geochemical model capable of calculating equilibrium aqueous specia-tion, adsorpspecia-tion, gas phase partitioning, solid phase saturation states, and precipitation-dissolution of metals. The model uses an extensive thermodynamic database to solve the chemical equilibrium problems (Allison et al., 1989). Speciation was done in pH and
Table 1Parameters for the MINTEQA2 modeling
Parameter Value
Temperature 31.04 – 27.80
Units of concentration ppm or M
Ionic strength To be computed
Automatic terminate if charge imbalance exceeds 30% No
The maximum number of iterations 200
The method used to compute activity coefficients Davies equation
Figure 1 Sampling map
S.A.
Sari
et
al.
concentrations with MINTEQA2 version 4.02 and PRODEFA2 version 4.02 on MS-DOS working program. The relative initial settings for the modelling are listed inTable 1.
Results and discussion
Physical profiles and zone stratification
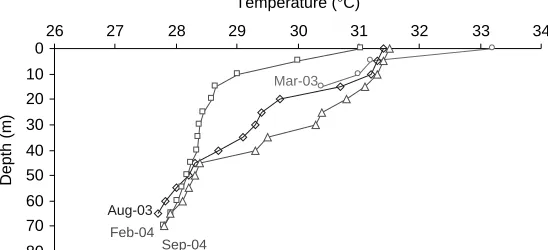
The physical characteristics of lake water strongly influence the chemical and biological processes occurring in water body. The water’s unique temperature-density relationship results in formation of distinct layers within non flowing bodies of water (Manahan, 2001). In general, in Tasik Biru Lake, the temperature at surface water was recorded higher than the lower level.Figure 2shows the temperature profiles at different depths in Tasik Biru, whereas the maximum value was found to be 33.28C for samples collected in March 2003. The decreasing trend in temperature ranged from 1 – 28C, and changed slowly every 5 m in depth, with the minimum value of 27.88C found at the lowest layer, 70 m in depth. However, average temperature in the lake was found to be 29.28C and the ambient temperature was up to 408C at 2 pm.
The behaviour of the temperature in this water could be used to stratify the zones of the lake, such the thermal stratification method. Although an appreciable temperature difference exists between the two layers, they did not mix, but behaved independently. Figure 3shows the stratification of Tasik Biru. The surface zone classified as epilimnion, which was exposed to light, might have heavy growth algae, as a result of exposure to the atmosphere. During daylight hours, because of the photosynthetic activity of algae, the epilimnion contains relatively higher levels of dissolved oxygen in range 7.9 – 9.0 mg/L. Due to the presence of CO2from algae activity, therefore oxidized species predominant in
the epilimnion. Epilimnion was a warm isothermic zone with an abundance of oxygen and closed to photosynthesis around 10 m in depth and warm water fishery zone (Sawyer et al., 2003). Below epilimnion, was a zone of rapidly decreasing temperature termed as
Mar-03
Aug-03
Feb-04 Sep-04 0
10
20
30
40 50
60 70
80
26 27 28 29 30 31 32 33 34
Temperature (°C)
Depth (m)
Figure 2 Temperature profiles
Atmospheric reaeration
Epilimnion
Metalimnion
Hypolimnion 45 m
10 m
Sediment
Figure 3 Zone stratification of lake
S.A.
Sari
et
al.
metalimnion. In this zone, the warm to cold thermal could be discontinued with variable dissolved oxygen concentration and diversity of aquatic life. Furthermore, a deep, colder, and usually dark bottom layer, called as hypolimnion. This zone was a cold isothermic with lower dissolved oxygen levels up to undetectable levels. The concentration of soluble forms of contaminants and nutrients should be increased in this zone due to the high tur-bidity in this zone. As a consequence, chemical species in a relatively reduced form tend to predominate in the hypolimnion.
The pH profile is commonly expressed as hydrogen-ion concentration, or more precisely, the hydrogen-ion activity (Peavy et al. 1985; Noor Salehin, 1988; Evangelou, 1998). In Tasik Biru, the profile of pH was found to be decreased in depth, as shown inFigure 4.
The average value was recorded at pH 6.89, and the maximum and minimum pH of 7.05 in epilimnion zone and 5 in hypolimnion zone, respectively, which were observed on February 2004. In the trophic zone, pH changed in the range of 0.07 to 0.19.
Mar-03
Aug-03
Feb-04 Sep-04
0
10
20 30
40
50
60
70
80
4.5 5 5.5 6 6.5 7 7.5
pH
Depth (m)
Epilimnion
Metalimnion
Hypolimnion
Figure 4 Profiles of pH in Tasik Biru lake
–10 0 10 20 30 40 50 60 70 80
Depth (m) 27.0
27.5 28.0 28.5 29.0 29.5 30.0 30.5 31.0 31.5 32.0
Temperature (
°
C)
5.2 5.4 5.6 5.8 6.0 6.2 6.4 6.6 6.8 7.0
pH
Temp.(L) pH(R)
Figure 5 Profiles of pH and temperature
S.A.
Sari
et
al.
However, the changes of pH profile in this study was found to be lower than reported by Noor Salehin (1988), where pH profile decreased constantly by 0.28 for every 10 m. Profiles of pH and temperature at different levels of depths are shown in Figure 5. In general, pH was changed slightly in depth, whereas it was higher on the surface than the deeper level, in which the deeper trophic zone shows the acidity. It assures the possibility of mineral dissolved, even though the salt shown by salinity was not found in this lake.
The profiles could be also expressed as Equations 1 and 2. In addition, correlation between pH and temperature according to depth in Tasik Biru could be expressed as Equation 3.
Temperature¼31:09420:0539 Depth ð1Þ
pH¼6:920220:0195 Depth ð2Þ
Temperature¼12:7234þ2:6423 pH ð3Þ
Profiles of iron, manganese and arsenic in lake water
Average concentrations of total iron at all depths were in the range of 0.877 to 4.049 mg/L. The depth profiles of dissolved total iron, iron (III) and iron (II) are shown in Figure 6a. The gradients of peak iron (III) increased in depth, however iron (II) decreased. It could be due to oxidation and reduction process at different zones in the
–10 0 10 20 30 40 50 60 70 80 Depth (m)
–10 0 10 20 30 40 50 60 70 80 Depth (m)
–10 0 10 20 30 40 50 60 70 80 Depth (m)
–2 0 2 4 6 8 10 12
(a) (b)
(c)
Average concentration (mg/L)
–2 0 2 4 6 8 10
Average concentration (mg/L)
0.0 0.2 0.4 0.6 0.8 1.0 1.2 1.4 1.6
Average concentration (mg/L)
Total iron Iron (II)
Iron (III)
Total arsenic As (V)
As (III)
Total manganese Mn (II)
Figure 6 Depth profiles of: (a) iron, (b) manganese, and (c) arsenic
S.A.
Sari
et
al.
lake. However, peaks gradient of those species increased in depth. Furthermore, iron reduction occurred in the deeper and reduced iron was prefentially reoxidized (Davison, 1993). Concentration of iron in the trophic zone could be expressed as shown in Equations 4 to 6:
Total iron¼20:892þ0:117 Depth ð4Þ
IronðIIÞ ¼21:536þ0:090 Depth ð5Þ
IronðIIIÞ ¼0:645þ0:027 Depth ð6Þ
Depth profiles of dissolved and particulate manganese are presented in Figure 6b, for total manganese and Mn (II) and could be expressed by Equations 7 and 8.
Total manganese¼21:618þ0:087 Depth ð7Þ
MnðIIÞ ¼21:104þ0:062 Depth ð8Þ
Sufficient recovery between Mn(II) which was analyzed by CE, and total manganese obtained using ICP-MS, indicates that dissolved manganese was mainly in the form of Mn(II). Concentration of manganese increased towards the hypolimnion zone of the lake and it seems to be similar to Mn(II) species. Reduction and dissolution of manganese usually occurred in the sediments (at the bottom of trophic zone), but these processes moved upwards to sediment surface due to stratified hypolimnion, as indicated by the vertical profiles of dissolved total manganese at the bottom. It was highly possible that dissolved manganese was directly supported by the reduction and dissolution of particu-late matter in the sediments (Davison, 1993). The concentration of total manganese increased in hypolimnion zone and reached the average of 1.680 mg/L on February 2004 and decreased in September 2004.
The relationship between iron and manganese in lake water can be explained as the ferrous iron can react with insoluble manganese oxide (MnO2) in the sediments at the
bottom of the lake, according to Equations 9 and 10 (Evangelou, 1998):
MnO2þ4Hþþ2Fe2þ!Mn2þþ2Fe3þþ2H2O ð9Þ
Fe3þþ3H
2O!FeðOHÞ3þ3Hþ ð10Þ
The reactions show that soluble iron into water with runoff maybe oxidized to form insoluble Fe(OH)3s. Iron (II) oxidation, however, reduces manganese Mn(III) or Mn(IV)
of manganese oxides to soluble manganese (Mn2þ).
In trophic zones of Tasik Biru, the concentration of dissolved arsenic increased against depth is shown inFigure 6cand could be explained by Equations 11, 12 and 13.
Total arsenic¼0:553þ0:010 Depth ð11Þ
AsðVÞ ¼0:403þ0:004 Depth ð12Þ
AsðIIIÞ ¼0:150þ0:006 ð13Þ
The average concentrations of arsenic were recorded at 0.704 to 0.927 mg/L, whereas the maximum was 2.730 mg/L on August 2003 in hypolimnion zone. Finally, total arsenic concentration displayed a strong peak in hypolimnion zone at 55 m in depth and maxi-mum of 2.730 mg/L. In addition, the variations of arsenic species were also found to be similar to total arsenic. It can be seen inFigure 6c, whereas concentration of As(V) and As(III) were in the range of 1.560 to 1.280 mg/L, respectively. It expected that As(V) would be the most dominant species in the oxygenated natural waters, as it is the most thermodynamically stable species under this condition (Anderson and Bruland, 1991).
S.A.
Sari
et
al.
However,Balistrieri et al. (1981)who inferred this relationship by measuring dissolved manganese and arsenic profiles in Hall Lake, rejected this hypothesis when considering particulate profiles, whereas arsenic were scavenged by high concentrations of hydrous iron oxides only. In another study in waters containing concentration of arsenic and manganese similar to Paul Lake but extremely poor in iron (Hunt and Howard, 1994), the binding of arsenic to manganese oxides was not significant. In turn, manganese oxides were proposed to be responsible for the oxidation of As(III) to As(V) in the water column during the overturn period. In the same study, As(III) and As(V) speciation measurements showed that the reduced form is enriched in the epilimnion and that the oxidized species is formed in the monimolimnion. Uptake of As(V) by algae in the epilimnion may result in its nutrient-like profile. As(III) may be formed in the epilimnion by reduction inside the cells and released in the water column. In Tasik Biru Lake it is more correlated to Fe(II) than to Mn(II), but the particulate concentration is too low to confirm the role of hydrous iron oxides.
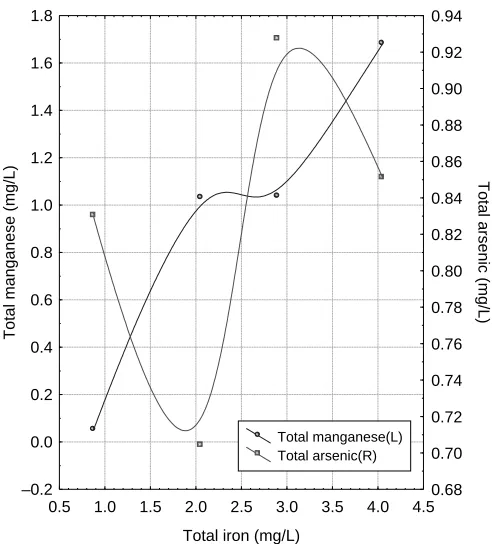
The dissolved arsenic increased might be due to its recycling by iron and manganese (Anderson and Bruland, 1991). Hence, in this study, the correlation between arsenic, iron, and manganese is shown in Figure 7and could be expressed as Equations 14, 15, and 16.
Arsenic¼0:508769545þ0:532283158 Manganese ð14Þ
Arsenic¼21:60804288þ4:92668222 Iron ð15Þ
Manganese¼20:238834625þ0:480863784 Iron ð16Þ
0.5 1.0 1.5 2.0 2.5 3.0 3.5 4.0 4.5
Total iron (mg/L) –0.2
0.0 0.2 0.4 0.6 0.8 1.0 1.2 1.4 1.6 1.8
Total manganese (mg/L)
0.68 0.70 0.72 0.74 0.76 0.78 0.80 0.82 0.84 0.86 0.88 0.90 0.92 0.94
Total arsenic (mg/L)
Total manganese(L) Total arsenic(R)
Figure 7 Correlation between arsenic, iron and manganese
S.A.
Sari
et
al.
Distribution as a function of pH
The thermodynamic model MINTEQA2 (Ugolini and Spaltenstein, 1992) was used to define the water column speciation and to model the hydrous iron oxide-trace element interactions. For each depth, the dissolved concentration of each ion measured was given to the model. The percentage of bound As(V) or HAsO22
4 increases with pH between 5
and 7.05 with maximum binding occurring at pH 7.05. As expected, As(V) was the main species found in the lake water samples.
The pH values and distribution of As(III) and As(V) are shown in Figure 8. The percentage of bound HAsO22
4 increases with pH between pH 5 to 7.05 with maximum
binding occurred at pH 7.05. As expected, As(V) would be the main species found in the water samples. The pH value was 7.05 and the dominancy of the inorganic arsenic species in natural waters was controlled by the pH values and the oxidizing and reducing conditions of such waters. Therefore, As(V) was found to be the predominant species in this study. The percentage was maximum in the deepest water column for As(V), how-ever, it is surprising that As(V) species in the form H3AsO3was found to be steady-state
in the pH range. This means that H3AsO3was found to be available at all depths of the
water column.
It has been found that, there are some secondary relationships between iron and manganese that should be considered. As iron and manganese precipitate as oxides and hydroxides, they act as sinks for the soluble manganese. However, these sinks are pH dependent. The two dominant species in the water column were Fe ðOHÞþ
2 and Fe 2þ when the pH ranged from 5 – 5.45. The other species as MINTEQA2 prediction were FeSO4and FeHPO4. Species of iron (II), Fe2
þ
was the only dominant species (more than
4.8 5.0 5.2 5.4 5.6 5.8 6.0 6.2 6.4 6.6 6.8 7.0 7.2
pH –20
0 20 40 60 80 100 120
Percent bound in species (%)
HAsO4 –2
H2AsO4–
H3AsO3
Figure 8 Percentage bound of arsenic species
S.A.
Sari
et
al.
90%) when the pH was 5.45 and remained constant. In addition, species of manganese in the form of Mn2þwas dominant in the hypolimnion zone with pH 5.45 and MnSO4was
found in the metalimnion zone with pH 6.1. 93.9% of manganese was in the form of Mn(II) and only 6.8% of MnSO4was aqueous. Results appear that, as the pH increases,
iron, manganese and arsenic become more soluble. This is true only because at the higher pH values, a certain fraction of the organic matter becomes soluble and tends to complex metals, which means that the metals in solution become associated with the soluble organic fraction.
Distribution as a function of solubility
Some species in solution or adsorbed as MINTEQA2 prediction were two species of As(V): HAsO22
4 and H2AsO24; and five species of As(II): AsO332; HAsO232; H2AsO23;
H4AsOþ3;and AsO 32
4 . Species of HAsO 22
4 was the predominant soluble in the epilimnion
zone. However, species of H2AsO24; in the hypolimnion and in the metalimnion zones
was the predominant soluble. These conditions could be explained by the solubility of each arsenic species, which varies depending on the presence of adsorbing surfaces, soluble cation type, and concentration (Evangelou, 1998). Commonly, arsenite exhibits low adsorption potential for oxides because the former exhibits high pKas (9.22 and
13.5). Recall, the maximum adsorption of an oxyanion takes place at pH closes to its pKa. Arsenate adsorption is nearly at maximum in the pH range of 3 – 11 because it
ercompasses the range of its three pKavalues: 2.22, 6.98, and 11.52.
There were twelve species of iron soluble in this lake and the majority of species was Fe ðOHÞþ
2 in the trophic zones. In addition, only MnSO4(aq) was highly soluble in the
trophic zone. Release of Mn and/or Fe correlates to redox chemistry of the two elements as well as the solubility of the solids formed under the various redox potentials present in the lake water. Precipitation and dissolution can be shown by saturation index (SI) with some rules as follows: (i) under equilibrium conditions, SI may either be less than zero (the solid is not present), or equal to zero (the solid is present but no net precipitation or dissolution is occurring); (ii) if SI is greater than zero, then the system is not at equili-brium since the solid is able (from a thermodynamic point of view) to precipitate; (iii) if the solid is already present and SI is less than zero, then the system is not at equilibrium since the precipitate is able to dissolve. In this study, phases of arsenic oxides, such as FeAsO4 and Mn3(AsO4) were presented as expected. However, none of these phases are
over saturated and will therefore not precipitate, shown by SI less than zero. The lack of precipitation could be explained by the high solubility constant, which means that the phases of arsenic oxides have a high solubility.
Conclusions
This study investigated the nature of the processes regulating the fate of trace elements. It focused on the speciation of iron, manganese and arsenic in both dissolved and particu-late phases. This study confirms the importance of hydrous oxides in cycling of trace elements. However, it provides new paradigms for explaining that the dynamics of the distribution of trace elements with similar chemistries (e.g. same oxidation number and same coordination chemistry), can have distinct cycling. Hence, it was found that arsenic is linked to manganese oxides, but regulated by the cycling of iron. Second, it was shown that hydrous iron oxides, influence the cycling of arsenic. In conclusion, this study contributes to understanding of the processes regulating the cycling of iron, manganese and arsenic in lake water.
S.A.
Sari
et
al.
Acknowledgements
Thanks are due to the Ministry of Science, Technology and Environment for financial support (IRPA RM 8 VOT 74028).
References
Allison, J.D., Brown, D.S. and Novo-Gradac, K.J. (1989).MINTEQA2/PRODEFA2,A Geochemical
Assessment Model for Environment System: Version 3.0, US EPA, Office of Research and Development, Washington DC, 20460.
Anderson, L.C.D. and Bruland, K.W. (1991). Biogeochemistry of arsenic in natural waters: the importance of
methylated species.Environ. Sci. and Tech.,52, 2073 – 2076.
Balistrieri, L.S., Brewer, P.G. and Muray, J.W. (1981). Scavenging residence times of trace elements and
surface chemistry of sinking particles in the deep ocean.Deep Sea Research,28A, 101 – 121.
Braman, R.S. (1983). Environmental reaction and analysis methods. InBiological Effects of Arsenic,
Elsevier, New York, pp. 141 – 145.
Carillo, A. and Drever, J.I. (1998). Adsorption of arsenic by natural aquifer material in the san Antonio-El
Trifuno mining area, Baja California, Mexico.Enviro Geology,35(4), 251 – 257.
Cullen, W.R. and Reimer, K.J. (1989). Arsenic speciation in the environment.Chem. Rev.,89, 713 – 764.
Davison, W. (1993). Iron and manganese in lakes.Earth Scie. Rev.,34, 119 – 163.
Evangelou, V.P. (1998).Environmental Soil and Water Chemistry, John Wiley & Sons, Inc, Canada,
pp. 439 – 449.
Fergusson, J.E. (1990).The Heavy Elements: Chemistry, Environmental Impact and Health Effects,
Pergamon, New York.
Fowler, B.A. (1983). Arsenical metabolism and toxicity to freshwater. InBiological and Environmental
Effects of Arsenic, Elsevier, New York, p. 155.
Hunt, L.E. and Howard, A.G. (1994). Arsenic speciation and distribution in the Carnon estuary following the
acute discharge on contaminated water from a disued mine.Marin Pollut Bull,28, 33 – 38.
Manahan, S.E. (2001).Fundamentals of Environmental Chemistry, 2nd edn, Lewis Publisher, United States
of America, pp. 341 – 342.
Mogensen, S.B., Nielsen, T.M. Zaini Ujang, and Tjell, J.C. (2001). Distribution and Health Risk of Arsenic
Related to Abandoned Tin-Mining Pools in Malaysia.Proceedings the International Water Association
Conference on Water & Wastewater Management for Developing Countries. 29 – 31 October, Volume 2,
Malaysia.
Noor Salehin, M.N. (1988).Removal of iron and manganese at Sungai Terip Reservoir by diffused air
aeration technique, Thesis Master Civil Engineering, Universiti Teknologi, Malaysia.
Peavy, H.S., Rowe, D.R. and Tchobanoglous, G. (1985).Environmental Engineering, McGraw Hill
International Editions, Singapore.
Sawyer, C.N., McCarty, P.L. and Parkin, G.F. (2003).Chemistry for Environmental Engineering and Science,
5th ed, McGraw Hill, Singapore, p. 536.
Ugolini, F.C. and Spaltenstein, H. (1992). Pedosphere. InGlobal biogeochemical cycles, Butcher, S.S.,
Carlson, R.J., Orians, G.H. and Wolfe, G.V. (eds.), Academic Press, San Diego, pp. 123 – 153.
Werner, F., Bilek, F. and Luckner, L. (2001). Impact of regional groundwater on the lake water quality of an
old post-mining lake.Eco Engineering.,17, 133 – 142.
WHO (2004).Guidelines for Drinking – Water Quality, 3rd edn, World Health Organization, Geneva,
Switzerland.
Williams, M. (2001). Arsenic in mine waters: an international study.Env. Geology,40(3), 267 – 278.
Yusof, A.M., Mahat, M.N. and Wood, A.K.H. (1996). The accumulation of some toxic elements and species
in aquatic life from disused mining pools.J. Anal. Sci.,2(2), 327 – 334.
S.A.
Sari
et
al.