ABSTRACT
RUSSELL, MARION MARK. Allocation of Time Buffer to Construction Project Task Durations. (Under the direction of Dr. Min Liu).
Allocation of Time Buffer to Construction Project Task Durations
by
Marion Mark Russell
A dissertation submitted to the Graduate Faculty of North Carolina State University
in partial fulfillment of the requirements for the degree of
Doctor of Philosophy
Civil Engineering
Raleigh, North Carolina 2013
APPROVED BY:
_______________________________ ______________________________
Dr. Min Liu Dr. Simon M. Hsiang
DEDICATION
BIOGRAPHY
ACKNOWLEDGMENTS
TABLE OF CONTENTS
LIST OF TABLES ... viii
LIST OF FIGURES ... ix
CHAPTER 1 ... 1
1.0 INTRODUCTION ... 1
1.1 Background ... 2
1.2 Research Objectives ... 5
1.3 Research Design ... 7
1.3.1 Design Overview and Scope Limitations ... 7
1.3.2 Questionnaire and Model Survey ... 9
1.3.3 Case Studies... 11
1.3.4 Analysis Techniques ... 12
1.4 Research Significance ... 14
CHAPTER 2 ... 16
2.0 LITERATURE REVIEW ... 16
2.1 Construction Research Pertaining to Buffer ... 16
2.1.1 Buffer Defined ... 16
2.1.2 Research on the Management and Effects of Buffer ... 19
2.2 Construction Research Pertaining to Factors Affecting Cost Contingency ... 23
2.3 Construction Research Pertaining to Factors Affecting Productivity ... 24
2.4 Research Pertaining to Lean Construction ... 26
2.4.1 Lean Construction Background ... 26
2.4.2 Last Planner System® ... 28
2.5 Construction Research Pertaining to the Use of Risk Assessment ... 30
2.5.1 Risk Assessment Background ... 30
2.5.2 Risk Assessment in Construction Research ... 31
2.6 Construction Research Pertaining to the Use of Factor Analysis ... 32
2.6.1 Factor Analysis Background ... 32
2.6.2 Factor Analysis Use in Construction Research ... 33
2.7 Construction Research Pertaining to the use of Structural Equation Modeling ... 34
2.7.1 Structural Equation Modeling (SEM) Background ... 34
CHAPTER 3 ... 39
3.0 METHODOLOGY ... 39
3.1 Time Buffer Survey ... 39
3.1.1 Research Objectives Addressed by the Time Buffer Survey ... 39
3.1.2 Time Buffer Survey Overview and Design ... 40
3.1.3 Time Buffer Survey Data Collection Plan ... 44
3.1.4 Time Buffer Survey Pilot Study Calibration ... 48
3.1.5 Time Buffer Survey Distribution ... 49
3.2 Case Studies ... 50
3.3 Case Study 1 (Mechanical Trade Contractor) ... 51
3.3.1 Research Objectives Addressed by Case Study 1... 51
3.3.2 Case Study 1 Overview and Design ... 51
3.3.3 Case Study 1 Data Collection Plan ... 53
3.4 Case Study 2 (General Contractor) ... 54
3.4.1 Research Objectives Addressed by Case Study 2... 54
3.4.2 Case Study 2 Overview and Design ... 54
3.4.3 Case Study 2 Data Collection Plan ... 55
3.5 Construction Task Planning Mental Model Survey ... 57
3.5.1 Research Objectives Addressed by the Mental Model Survey ... 57
3.5.2 Model Survey Overview and Design ... 57
3.5.3 Model Survey Data Collection Plan ... 58
CHAPTER 4 ... 61
4.0 RESEARCH EXECUTION AND ANALYSIS ... 61
4.1 Time Buffer Survey ... 61
4.1.1 Time Buffer Survey Results ... 61
4.1.2 Time Buffer Survey Analysis ... 63
4.1.3 Time Buffer Survey Discussion and Conclusions ... 114
4.2 Case Study 1 ... 119
4.2.1 Case Study 1 Results ... 119
4.2.2 Case Study 1 Analysis ... 120
4.3 Case Study 2 ... 126
4.3.1 Case Study 2 Results ... 126
4.5 Model Survey ... 142
4.5.1 Model Survey Results ... 142
4.5.2 Model Survey Analysis ... 143
4.5.3 Model Survey Discussion and Conclusions ... 146
5.0 SUMMARY AND CONCLUSIONS ... 148
5.1 Existing Gaps in the Body of Knowledge ... 148
5.2 Research Summary ... 150
5.3 Intellectual merit and Broader Impact ... 152
5.4 Recommended Future Research ... 154
5.5 Scholarly Contributions ... 156
5.5.1 Journal Papers ... 156
5.5.2 Conference Papers / Presentations ... 157
REFERENCES ... 158
APPENDIX ... 167
LIST OF TABLES
Table 1.1: Case Study Project Characteristics ... 12
Table 2.1: Types of Buffer Defined ... 18
Table 3.1: Individual Causes of Time Buffer ... 43
Table 4.1: Time Buffer Survey Section Two Results Summary ... 65
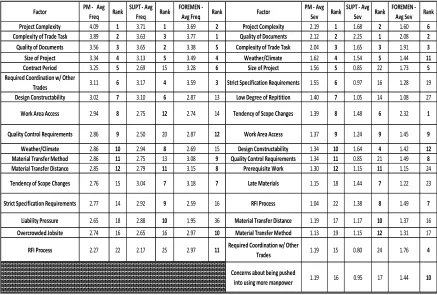
Table 4.2: Overall Top Twelve Most Frequent and Severe Causes of Time Buffer ... 67
Table 4.3: Histogram Output for Quality of Documents ... 68
Table 4.4: Top Twelve Most Frequent and Severe Causes of Time Buffer by Job Position ... 78
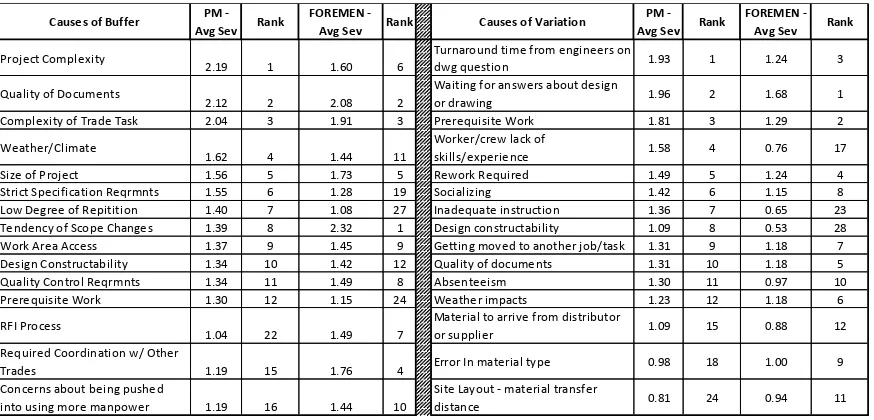
Table 4.5: Overall Top Twelve Most Severe Causes of Time Buffer and Duration Variation ... 84
Table 4.6: Categorical Ranking Comparison... 86
Table 4.7: Comparison of Causes between Project Managers and Foremen... 87
Table 4.8: Rotated Factor Loading Matrix for Time Buffer Severity ... 92
Table 4.9: Rotated Factor Loading Matrix for Time Buffer Frequency ... 95
Table 4.10: Measurement Models’ Assessment of Fit Summary ... 102
Table 4.11: Fit Assessment of Proposed Best Models ... 107
Table 4.12: Upper Management Structural Equation Models ... 110
Table 4.13: Field Management Structural Equation Models ... 112
Table 4.14: Top Three Field Manager Models ... 144
Table 4.15: Top Two Upper Management Models ... 146
Table 4.16: Final Proposed Models ... 147
LIST OF FIGURES
Figure 1.1: Research Design Flow Chart... 9
Figure 2.1: Time Buffer ... 19
Figure 2.2: The Planning System (Howell 2009) ... 29
Figure 2.3: Risk Assessment Matrix (FM 100-14, 1998) ... 31
Figure 3.1: Section Two of Time Buffer Survey – Ranking of Categories ... 46
Figure 3.2: Example from Section Three of Time Buffer Survey ... 47
Figure 4.1: Time Buffer Survey Participation by Position ... 62
Figure 4.2: Time Buffer Survey Participation by Trade ... 63
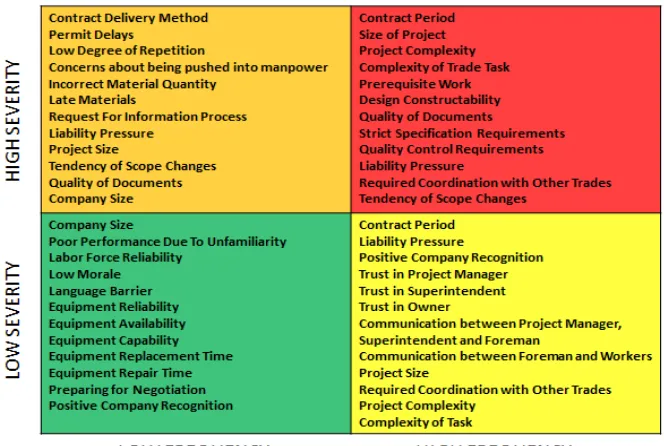
Figure 4.3: Frequency and Severity Risk Profiles ... 70
Figure 4.4: Risk Profile Summary Grid ... 71
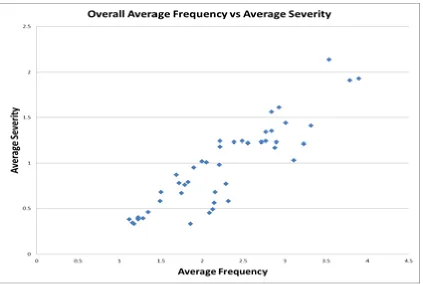
Figure 4.5: Overall Average Frequency versus Average Severity ... 72
Figure 4.6: Step Graph Based on Risk Level Clustering ... 74
Figure 4.7: Factor Analysis Procedure (Wambeke et al. 2011) ... 90
Figure 4.8: Mechanical contractor project time buffer, variation, and productivity ... 121
Figure 4.9: Time buffer and variation by mechanical trade activity type ... 125
Figure 4.10: Productivity and time buffer comparison for copper and steel activity types ... 126
Figure 4.11: General contractor case study PPC versus time buffer percentage ... 129
Figure 4.12: Trade contractor time buffer allocation ... 133
Figure 4.13: Time buffer and variation by trade contractor ... 135
Figure 4.14: General contractor case study causes of task variation ... 138
CHAPTER 1
1.0 INTRODUCTION
Time buffer, defined for this research as an amount of extra time added during planning to individual task durations is often used to compensate for uncertainty and protect against workflow variation. Time buffer is the difference between the scheduled or planned task duration and the minimum duration the task should take based on an optimum or baseline productivity. This baseline productivity is the best productivity a contractor can achieve on a given project and typically occurs when the material, equipment, information, and plan are adequate (Sakamoto et al. 2002). The use of “allocation” in the title refers to the verb form of the word and is defined as “to designate for a special purpose” and “to distribute according to a plan” (Merriam-Webster (2012). This research effort addresses the need to
examine the root causes of time buffer in construction project task durations. Furthermore, an understanding of “why” time buffer is added to task durations helps the understanding of “how” time buffer is added through model development of the causal structure used by
1.1 Background
Construction is a very complex process and nearly every single project is unique. The resulting number of parts, relative lack of standardization, multiple participants and constraining factors make construction projects a difficult endeavor (Ballard and Howell 1995). Adding to this complexity is the high degree of interdependency inherent to the construction process. Complexity can be defined as "something made up of closely connected parts which are difficult to explain or understand, or a number of different parts intricately related" (Hornby 1974). This complexity is combined with the ever-growing economic demand to deliver projects more quickly while minimizing costs, resulting in uncertainty as a characteristic component of construction and often leading to variation. Uncertainty can be generally defined as a set of possible outcomes where probabilities are assigned to each possible outcome. However, uncertainty as it pertains to the research here is a "presence of doubt, changeability, and lack of assurance or reliability" (Hornby 1974). While variability or variance in statistics is a measure of how far a set of numbers is spread out, variation as discussed in this research is defined as the difference between what was planned and what actually happened (Wambeke et al. 2011). Further, variability as discussed in this research pertains to the propensity for variation due to the inherent uncertainty in construction projects.
from lacking a mechanism for coordination. Buffers can be seen as wasteful because they do not directly add value to a construction project even though they allow downstream operations to continue. One definition of waste includes “anything that is different from the
minimum quantity of equipment, materials, parts, and labor time that is absolutely essential for production” (Vrijhoef 1998). The minimum is however not necessarily the optimum or
most efficient way to do things. In Lean Construction, waste is defined as anything that does not generate value, where value is the things the customer is willing to pay for. Essentially, buffers help make the project insensitive to perturbation; however, too much buffer is waste (workers waiting on work) and not enough can result in a project being susceptible to productivity losses and schedule degradation (work waiting on workers) when variation does occur. Perhaps most importantly, buffers mask the sources of uncertainty that make them necessary. Low variation levels in a project do not alone guarantee good productivity or reduced waste, because the presence of excessive buffers can absorb the variation and adversely impact performance. It is evident that buffers are used in construction, but the underlying causes of time buffers, both the frequency and severity thereof and how buffer allocation occurs when planning, are unclear.
in today’s construction industry environment of limited resources, the risk profiles help to
categorize and prioritize the factors for management to address. Additionally, there is great importance in comparing the perceived need for time buffer to the actual causes of task duration as it reveals disconnects in the underlying structures of time buffer and task variation. Management benefits from understanding which causes of uncertainty personnel plan for and do in fact cause variation as well as understanding which causes personnel unnecessarily plan for and those they fail to plan for and do not realize are the cause of performance problems.
Most construction personnel at every level of management will acknowledge that they are constantly planning and trying to figure out how best to deal with the uncertainty and variability of construction projects. Plausibly and arguably, construction personnel do not consider the causes of time buffer independently but rather group them together and prioritize them through the use of a mental model and/or certain questions they ask when planning construction task durations. Further, the priority and interrelationships of the underlying factors are different depending on what level of management is asked. This research incorporates the use of factor analysis and structural equation modeling to develop these models used by construction personnel when task planning and allocating time buffer.
be managed (Ballard 2000b). Construction personnel will be able to provide unpadded durations for their assigned tasks. Essentially, buffer sizes can be reduced if work flow variation can be reduced, and project durations can be reduced by reducing buffers.
Due to the inherent complexity, uncertainty, and variability of the construction process, it is important to study the root causes of time buffer used to protect against those challenging characteristics. Once the root causes are identified, methods for addressing the most problematic areas and an understanding of how construction personnel at various levels of management allocate the time buffer can be developed. Construction managers can then take effective steps towards addressing those causes, managing uncertainty, allocating time buffer where it is needed most and reducing the overall associated time buffer in construction projects.
1.2 Research Objectives
planning task durations. The development of this causal structure is used for decision support through identification of risk areas, and the prioritization, prevention, and mitigation of those risks. The model survey collected feedback and input to provide a level of model validation, while the case studies focused on comparing the buffering tendencies of various trades and activities, and investigating the effect of the use of LPS® on the amount of time buffer present and project performance. Together, the surveys and case studies support the overall objectives of this dissertation.
Objective 1: Identify the causes of time buffer and determine which are the most prevalent and severe in terms of additional time included in construction project task durations.
Objective 2: Quantitatively develop risk profiles of the causes of time buffer so they may be prioritized for mitigation efforts.
Objective 3: Determine the differences in opinion and perception between different levels of management, different trades, different levels of experience, the difference between contractors and subcontractors, and the difference between contractors using traditional management approaches and those using lean construction techniques.
Objective 4: Compare and contrast the overall most severe causes of time buffer with the most severe causes of duration variation to identify disconnects between the perception of concerns about uncertainty and the reality of what causes task duration variation.
Objective 6: Develop the mental model and associated causal structure used by project managers and field level managers (superintendents and foremen) when buffering and planning for uncertainty.
Objective 7: Examine the effect of traditional management and planning on the allocation of time buffer and the associated impacts on task variation and productivity
Objective 8: Examine the effects of lean construction techniques such as LPS® results on the allocation of time buffer to construction project task durations and the implications on project performance.
Objective 9: Determine construction trades and activities to be targeted by management for time buffer and variation reduction. Further, investigate how the reasons for time buffer allocation compare to the causes of variation in practice for a given construction project. Objective 10: Through the use of a model survey, attempt to validate the SEM developed mental models of how construction personnel plan for uncertainty and allocate time buffer to construction project task durations.
1.3 Research Design
1.3.1 Design Overview and Scope Limitations
Chapter 3 (Methodology) and Chapter 4 (Research Results and Analysis), but a brief description of each is provided as an overview. Also, a flow chart of the overall research design is included below (Figure 1.1). Research is an ever forward process and often iterative. The dashed lines in the flow chart represent the need for future research and case studies to further validate the author’s findings and further investigate the allocation of time
buffer to construction project task durations. The research boundary is defined by the scope described in this section. In construction there exist multiple types and layers of buffer. The different project participants to include owners, architects and engineers, general contractors, sub or trade contractors, suppliers and all their project managers, superintendents, and foremen use different types of buffer such as money, inventory, capacity, plan, and time to reduce the impacts of uncertainty on a construction project as it transitions from initial owner thoughts into a design and ultimately to construction. Although they are all important areas for research, the scope of this research is limited to the time buffer added to task durations by the project managers, superintendents, and foremen of general and subcontractors. Given the scope limitations discussed in the following sections, the research results will be relevant and the research method can be applied to other types of projects and trades with appropriate adjustment.
Figure 1.1: Research Design Flow Chart
1.3.2 Questionnaire and Model Survey
For the first phase of this research, a questionnaire survey was developed and distributed to construction companies across the United States for completion. The survey was used to determine the causes of uncertainty or concerns about potential for variation that result in the addition of time buffer in construction task durations. Additionally, the frequency and severity associated with each of the causes was collected. The respondents of the survey were foremen, superintendents, and project managers working for general
RESEARCH DESIGN FLOW CHART
Problem Definition
•Define Buffer
•Literature Review
•Develop List of Causes
Impact of lean? Critical trades/tasks?
Model Validation? Perception vs
Reality? Develop Survey
•Questionnaire based
•Conduct pilot study
•3 Parts (Demographics, Category Comparison, Frequency & Severity
Conduct Survey
•LCI
•FMI
•SAME
•Local Companies
Analyze Survey Results (Objectives 1-6)
•180 usable responses
•Findings:
Most Frequent and Severe causes of time buffer
Classify causes into appropriate risk Category
Comparisons amongst survey groups
Underlying factors that correlate individual causes
Model causal structure of construction personnel Case Studies
•Prepare study designs
•ID Participants
•Conduct study
•Empirical data & survey/interview
Analyze Study Results (Obj. 7-10)
Model validation
Buffer and variation trends over course of project
Trades w/ most buffer & variation
Causes of buffer vs causes of variation
Impact of time buffer on project performance
Impact of LPS®on time buffer
survey responses used for data analysis. The survey data input is limited to those personnel who volunteered to complete the survey from each of the participating companies. The subcontractors and general contractors who participated in the survey were all from the commercial sector of the construction industry. Although this is a research limitation, the commercial sector is an important sector, accounting for approximately 48% of construction employees (Dept. of Labor 2012) and 25% of the total construction value put in place each year in the United States (National Research Council 2009). A second limitation of the survey is that the likely difference between union and non-union perceptions of risk was not captured.
A model survey was distributed to obtain feedback and a level of validation for the developed task planning mental models. The participants were asked to choose the models which best fit their mental thought process and causal structure for how they consider potential for variation and causes of uncertainty when task planning and allocating time buffer. Additionally, they were asked to modify the best overall model they selected so it better fit their task planning process or to draw their own model. There were a total of 34 field management level surveys completed and 29 upper management level surveys completed. The results are limited to these 63 personnel who voluntarily participated in the model survey. The surveys were anonymous and no information aside from level of management was collected.
1.3.3 Case Studies
Two case studies are used in this research to contribute to the time buffer body of knowledge and build on the survey results and hypotheses. As Meredith (1998) discusses, researchers use either a rationalist or case study research paradigm approach. The rationalist approach involves the use of quantitative methodologies such as modeling by equations, laboratory experiments, and statistical survey analysis to explain what happens and how. Conversely, the case study approach does not involve experimental controls or manipulations and instead is more process or means oriented with the intent of helping the researcher comprehend why certain characteristics or effects occur, or do not occur. This case study approach is in line with the objectives of the time buffer research.
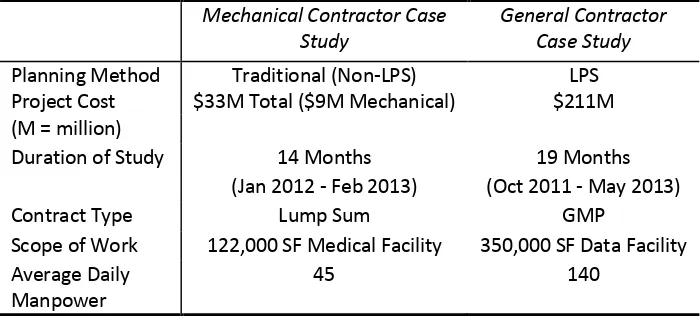
thus increasing the confidence in the robustness of the theory (Yin 1994). The case studies’ characteristics are outlined in Table 1.1. Although the research is limited to the trades and construction projects involved in the case studies, the methodology can be applied to other projects and trades as well.
Table 1.1: Case Study Project Characteristics
1.3.4 Analysis Techniques
While there are two primary means of data collection, the approaches and techniques used in data analysis are numerous and are briefly discussed here. The survey identified the causes of time buffer and the frequency and severity of each cause. Risk assessment was used to categorize the causes based on an integrated approach using histogram analysis and a risk assessment matrix. The research then hypothesized that these individual causes of time buffer are not independent and multicollinearity exists; therefore, factor analysis was used to
Mechanical Contractor Case Study
General Contractor Case Study Planning Method
Project Cost
Traditional (Non-LPS) $33M Total ($9M Mechanical)
LPS $211M (M = million)
Duration of Study 14 Months 19 Months
(Jan 2012 - Feb 2013) (Oct 2011 - May 2013)
Contract Type Lump Sum GMP
Scope of Work 122,000 SF Medical Facility 350,000 SF Data Facility Average Daily
Manpower
45 140
The survey results also indicated the existence of Simpson’s Paradox as the
correlation of overall frequency to severity changed somewhat when the causes were broken into four groups of risk level through the use of clustering in Statistical Analysis System (SAS®) software.
Another hypothesis driven by the survey results was that construction personnel have a mental model they use when allocating buffer and planning for uncertainty. That is they do not consider all the causes at the same time or with the same priority and some hierarchy exists. Structural Equation Modeling (SEM) analysis was used to develop the model. SEM is a methodology for representing, estimating, and testing a network of relationships between variables. In this model development, Simpson’s Paradox also supports interest in partitioning the survey responses by levels of management when developing the model of the causal structure used by construction personnel as the model of all survey respondents will likely differ from the model for each level of management. These differences across the levels of management are an important aspect of the model analysis. A survey was also used to obtain feedback and validation of the data based models.
1.4 Research Significance
Construction is an industry with characteristically inherent complexity and uncertainty existing in the execution of construction projects. This complexity and uncertainty lead to variation. Research has been conducted on the factors affecting productivity as well as the resulting variation. Researchers have also acknowledged the use of various types of buffers to compensate for the uncertainty and absorb the variation it causes. Some lean researchers argue that the use of buffers is waste as they do not directly add value to a project (Ohno 1988; Womack and Jones 1996). Others argue that due to the uncertainty and variability inherent in construction, buffer will always be necessary to ensure flexibility in responding to problems (Howell et al. 1993; Ballard and Howell 1995; Tommelein et al. 1999). Researchers do agree that overly large buffers are wasteful and can reduce project performance by extending duration, reducing work discipline and coordination. The questions become “what causes construction personnel to use buffer in the first place?” and one of “how lean is lean enough?” How much do personnel buffer, how can
the time buffer be reduced, and where should time buffer be allocated first?
The elimination of all uncertainty, variability, and associated time buffer in construction is unlikely. However, understanding and addressing the root causes of buffer will help us to reduce it through better planning and allocate it where it is needed most (lower the river to reveal the rocks), consequently reducing project duration costs. As Hopp and Spearman (2008) state, “understanding the underlying causes of variability and the causes of
lack of research conducted regarding the understanding of the root causes and allocation of time buffer specifically as well as the effects of lean construction techniques on time buffer in construction projects. These gaps in the construction related body of knowledge illustrate that this research is a significant contribution to the body of knowledge. The research analysis methods and results will have a broader impact in their ability to be applied in multiple other domains to include the military, air transportation, supply chain, and hospitals especially when considering different levels of management.
CHAPTER 2
2.0 LITERATURE REVIEW
This literature review was completed to study the existing research pertaining to the definition of buffer, the function of buffer, and the types of buffer, to provide a foundation for defining buffer for this research and identifying the causes of buffer and their relation to productivity, work flow, and variation. Further, the purpose of this literature review is to study factors in construction literature which affect cost contingency as well as productivity as they are hypothesized to be closely related to the causes of buffer. An introduction to Lean Construction is also included since part of the case study will document the effect of lean planning philosophies on buffer. Also, risk assessment, factor analysis, and structural equation modeling were used in this research and are therefore included in this literature review as well.
2.1 Construction Research Pertaining to Buffer 2.1.1 Buffer Defined
Horman and Kenley (1998) defined buffer as an allowance used to accommodate the impact of unexpected influences and other difficulties encountered in a construction project. Alves and Tommelein (2004) define buffers concisely as resource cushions, i.e., money, time, materials, space, etc., used to protect processes against variation and resource starvation. According to Ballard and Howell, buffers operate to provide a cushion or shield against the negative impact of disruptions and variability (Howell et al. 1993; Ballard and Howell 1995). Horman (2000) added that buffers of different types not only provide shielding, but they provide the ability to efficiently respond to variable conditions thereby enhancing overall performance. Sakamoto et al. (2002) noted that buffers function to absorb problems and perturbations, and allow varying rates of production. Production systems must be able to absorb variation in order to avoid loss of throughput, wasted capacity, inflated cycle times, larger inventory levels, long lead times, and poor customer service (Hopp and Spearman 2008). Ballard (2005) has called construction one type of such production system, albeit one of greater complexity and uncertainty, that uses various types of buffer to absorb variation that occurs due to uncertainty in construction projects.
Table 2.1: Types of Buffer Defined
The focus of this research is the “within activity” time buffer that is an amount of
extra time (hours or days) added to individual task durations to compensate for uncertainty and protect against variation. Figure 2.1 is intended to help illustrate the time buffer discussed in this research. The time buffer is the difference between the scheduled/planned task duration and the minimum duration the task should take based on an optimum or baseline productivity. Baseline productivity is defined as the productivity of the subset of work days where the highest daily output of quantities was achieved (Horman and Thomas 2005). The size of the subset in workdays is 10% of the total workdays, but not less than five workdays. By definition it represents the best performance the contractor achieved on the
Type of Buffer Definition
1. Inventory
2. Capacity
3. Plan
4. Time
5. Financial
Buffers of physical material stockpiles (Horman and Thomas 2005). Large buffers of inventory can lead to congestion which impedes performance, but material stockpiles which are too low can lead to stopped, slowed, or disrupted production.
Buffers of additional manpower and/or equipment provided to an operation beyond the anticipated need for completion (Horman and Thomas 2005). Additional capacity provides an operation the ability to rapidly respond to situations caused by uncertainty and variability. Too much capacity buffer can also result in inefficient labor and equipment use.
Buffers that are inventories or backlogs of workable assignments (Ballard and Howell 1995). Plan buffer provides alternative tasks for crews to perform that keep them working in the right sequence when the main tasks planned cannot be performed or when assignments are completed sooner than expected.
Buffer that takes the form of additional time added into a task to protect against uncertainty and to absorb variation. The concept of float is one such use of time buffer and is seen in the Critical Path Method. Float provides some flexibility in determining start dates for activities, without delaying the project’s completion (Alves and Tommelein 2004). A similar example is the use of a deliberate pause or time lag inserted between step in an operation (Horman and Thomas 2005). Lee et al. (2006) points out time buffers have been mainly used as a contingency such as adding a percentage of the activity duration at the end of the activity to accommodate uncertain and variable conditions.
Money in the construction project budget reserved to pay for unforeseen design or construction costs (Risner 2010).
project and occurs when material, equipment, and information flows are good and the plan is adequate (Sakamoto et al. 2002). Other approaches for determining a contractor or trade’s
minimum duration may be based on historical labor curves for their company and/or the expertise and experience of the construction personnel conducting the task planning and assigning durations.
Figure 2.1: Time Buffer
2.1.2 Research on the Management and Effects of Buffer
incorporation of uncertainty as seen in the Program Evaluation and Review Technique (PERT) method. The optimistic (O), most likely (M), and pessimistic (P) activity durations are used to calculate the expected durations (TE) of the activities (see Equation 1 below).
TE = (O + 4M + P) ÷ 6 Eq. 1
Unfortunately, the PERT method does have several drawbacks. First of all, the procedure focuses on a single critical path, when many paths might become critical due to random fluctuations and PERT tends to underestimate actual project durations (Hendrickson and Au 2008). A second problem is the incorrect assumption that task durations are independent random variables. Task durations are in fact correlated with one another as a problem encountered on one task will likely influence tasks which follow. PERT also requires labor intensive data collection as three duration estimates are required for each activity instead of one. Although PERT does attempt to quantify the amount of time buffer in task durations it does not address the question of what causes buffer to be included in those durations.
The time buffer added to tasks is usually subject to either Parkinson’s Law or student syndrome (Lechler et al. 2005). Parkinson’s Law states that people will always use this time
than the planned start or even as late as possible without impacting the next schedule task or their deadline. Sometimes the later start does impact the next task or causes a deadline to be missed and schedule variation occurs. Both of these issues result in wasted time and money as well as reduced productivity. Goldratt (1997) similarly argues that instead of being used to deal with uncertainties and variation, the time buffer is always used as a part of the time to perform a task. Goldratt developed Critical Chain Project Management to manage this time buffer and calls for removing all buffer within the activities and placing it at the end of the project and allowing activity delays to be absorbed by the pooled buffer. Unfortunately, there are few if any construction projects published where this method has been used successfully. One reason may be that allowing pooled buffer to absorb a delay will have an immediate and problematic domino effect on the downstream activities in regards to schedule, manpower, equipment, cost, etc due to the complex interdependencies existing in construction projects. As part of the Last Planner System©, Ballard (2000a) introduced Phase Scheduling which uses pull and team planning techniques to develop schedules for each milestone based phase of work. He notes that it is critical that task durations not be padded with time buffer to allow for variability in this planning process. Instead, the team works together; applying minimum duration estimates for each activity and develops the phase schedule. If there is time left over between the milestone date and phase schedule completion, then and only then is buffer added to those activities with the most uncertainty or greatest need for extra time.
causes included “change orders, late replies to requests for information, lack of materials,
physical interference between materials, and work-space congestion” but did not develop a thorough list of factors or explore further into them. Lee et al. (2006) have developed a new buffering approach, reliability and stability buffering, as a means to reduce uncertainty caused by errors and changes, in particular, when concurrent design and construction is applied to an infrastructure project. While they identify design errors and changes as causes of time buffer, their research is limited to those two factors and current construction literature does not address the perceived frequency and severity of the root causes for the addition of time buffer.
durations. The next two sections, 2.2 and 2.3, address the factors causing cost contingency and those affecting productivity respectively.
2.2 Construction Research Pertaining to Factors Affecting Cost Contingency
One of the topics reviewed dealt with factors that result in the addition of cost contingency to a project budget. Cost contingency is defined as an amount of money reserved to pay for unforeseen design or construction costs in the project (Risner 2010). The uncertainty in construction at the heart of this cost contingency is very much the same uncertainty that results in the addition of buffers in construction. Risner (2010) discusses design errors and omissions, scope changes, and unforeseen field conditions as factors driving cost contingency. Mak and Picken (2000) used risk analysis to determine site conditions, access, additional client requirements (scope changes), contract period, and project coordination as what they called risk events that contribute to uncertainty associated with a specific project. Chan and Au (2009) studied factors that contractors perceived to be important when pricing “time-related” contract risks. Their literature review and factor list
problems, poor productivity, weather, and construction methods. Günhan and Arditi (2007) also considered factors that drive cost contingency as a way to deal with uncertainties. They listed project complexity, inherent uncertainty in the performance of the parties involved, design and scope changes, permit issues, differing site conditions, schedule constraints, and constructability issues as examples of such factors. Harbuck (2004) documented cost variation associated factors such as design errors and changes, specification requirements, differing site conditions, delays, scope changes, and permits. Just as cost contingency considers the impacts of uncertainty and potential for variation related to these factors, construction personnel too may consider many of the same factors when considering the amount of time buffer to add to their task durations.
2.3 Construction Research Pertaining to Factors Affecting Productivity
location, while the organizational factors included production, social, and labor factors. Thomas and Sakarcan (1994) used a factor model to classify scope, work content, design features, specifications, component size, rework, material, tools, equipment, information, plant status, weather, sequencing, and congestion as productivity factors. Using an artificial neural network, Portas and AbouRizk (1997) predicted productivity rates for concrete work and found work complexity, superintendent skill, crew skill, design accuracy, dimensions, degree of repetition, working condition, site congestion, and site access as primary factors affecting productivity. Somnez and Rowlings (1998) also studied concrete placement and found quantity, job type, crew size, percent overtime, crew composition, weather, and the concrete pump to be the most pertinent factors impacting productivity. Rojas and Aramvareekul (2003) determined the top factors associated with productivity to be scheduling, manpower experience and motivation, adverse working conditions, and scope changes. Liberda et al. (2003) determined lack of detailed planning, inadequate supervision, and lack of information were the three primary factors impacting productivity. Recently, Dai et al. (2009) used a nationwide survey of nearly 2000 craft workers to examine 83 different productivity factors. They identified tools and consumables, materials, engineering drawing management, and construction equipment as having the greatest impact on productivity from the craft workers’ perspective. Kimpland (2009) categorized factors as internal or external.
from the customer, and lack of qualified labor. Wambeke et al. (2011) completed a thorough literature review of productivity factors including the factors previously mentioned to identify 166 total factors that affect productivity. Not surprisingly many of the factors overlapped or were repeated, and he cross-referenced and reduced those factors to 50 causes of variation which were also considered when developing the baseline of time buffer factors.
2.4 Research Pertaining to Lean Construction 2.4.1 Lean Construction Background
The following background information on the Lean Construction Institute (LCI) was obtained from the organization’s website: www.leanconstruction.org. LCI is a non-profit
Control is redefined from "monitoring results" to "making things happen." Planning system performance is measured and improved to assure reliable workflow and predictable project outcomes.
Performance is maximizing value and minimizing waste at the project level. Current practice attempts to optimize each activity and thus reduces total performance.
Project Delivery is the simultaneous design of the facility and its production process. This is concurrent engineering. Current practice, even with constructability reviews is a sequential process unable to prevent wasteful iterations.
Value to the customer is defined, created and delivered throughout the life of the project. In current practice, the owner is expected to completely define requirements at the outset for delivery at the end, despite changing markets, technology and business practices.
Coordinating action through pulling and continuous flow as opposed to traditional schedule driven push with its over-reliance on central authority and project schedules to manage resources and coordinate work.
Decentralizing decision making through transparency and empowerment. This means providing project participants with information on the state of the production systems and empowering them to take action.
2.4.2 Last Planner System®
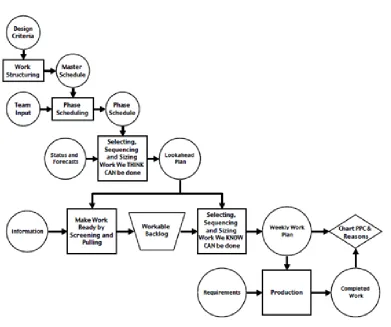
The addition of time buffers to project task durations during planning is central to this research. This section serves to introduce the planning process used in lean construction as one of the case studies was carried out with a company who practices lean construction techniques. The Last Planner System® (LPS) is the planning process associated with and advocated by the LCI. It involves collaborative planning which is scheduling intended to engage all members of the project team. The main objective of LPS® is to create and maintain reliable workflow between crews through reliable weekly work plans (Howell 2009). It is essentially identifying all of the pre-requisite tasks and constraints for a given task and then ensuring it is feasible for those pre-requisites to be completed and for those constraints to be removed prior to beginning the task. Figure 2.2 illustrates the flow process associated with the LPS.
does exist, this leftover time can be assigned to the most uncertain and potentially variable task durations, can be used to delay the start of the phase in order to invest more time in prior work, or can be used to accelerate the phase completion date.
Figure 2.2: The Planning System (Howell 2009)
positively correlated with PPC (Liu and Ballard, 2009), but its relationship or impact on time buffer has not been empirically demonstrated.
2.5 Construction Research Pertaining to the Use of Risk Assessment 2.5.1 Risk Assessment Background
The word “risk” is used in many different ways and with many different words, such as “hazard” or “uncertainty” (Jannadi and Almishari 2003). The Random House College Dictionary defines risk as “exposure to the chance of injury or loss” (Hertz and Thomas 1983) and the Health and Safety Commission defines risk as “the likelihood that harm will occur” (Health and Safety Commission 1995). Every activity, not just in construction but in
Figure 2.3: Risk Assessment Matrix (FM 100-14, 1998)
The value of the risk can also quantitatively be calculated for comparison through use of Equation 2 below. The expected value of risk or risk rating (R) of an item is the product of the likelihood or probability (P) of occurrence and the consequence of the occurrence (C) (Gencturk 2010).
R(n) = P(n) * C(n) Eq. 2
2.5.2 Risk Assessment in Construction Research
several researchers have studied the risk associated with different types of construction such as highway, high-rise, and mountainous jobsites. Choi et al. (2004) suggested a risk assessment procedure composed of four steps of identifying, analyzing, evaluating, and managing risks inherent to underground construction projects. Some risk assessment has also been done in the area of construction contracts such as Chan et al.’s (2010) study of risk assessment for guaranteed maximum price and target cost contracts. Another high emphasis area is that of occupational risk assessment to evaluate and improve construction safety (Pinto et al 2011). The author too has accomplished risk assessment to include the use of a risk matrix as part of a solution to unexploded ordnance discovered on his construction jobsite at Langley Air Force Base, Virginia.
2.6 Construction Research Pertaining to the Use of Factor Analysis 2.6.1 Factor Analysis Background
the many individual causes of buffer considered during this research are not independent and multicollinearity exists in the buffer variables (i.e., some of those individual causes of buffer are correlated to others). The basic assumption of factor analysis is that within a collection of observed variables (causes of buffer), there exists a set of underlying factors, smaller in number than the observed variables, that can explain the interrelationships among those variables (Kim and Mueller 1978).
2.6.2 Factor Analysis Use in Construction Research
Trost and Oberlender (2003) studied 45 potential drivers for predicting early cost estimate accuracy on construction projects and used factor analysis to group them into 11 orthogonal factors. Factor analysis was performed to extract 4 major factors from 25 motivational attributes affecting worker’s productivity in Australian construction industries
by Doloi (2007). Lu et al. (2008) used factor analysis to group 35 critical success factors pertaining to contractor competitiveness into 8 clusters. Craft workers’ perspective of the impact 83 productivity factors on construction productivity was studied by Dai et al. (2009) and factor analysis revealed 10 latent factors representing the underlying structure. Most recently, Wambeke et al.’s (2011) research on the causes of starting time and duration
been used to analyze the interrelationships of the individual causes of time buffer in construction project tasks.
2.7 Construction Research Pertaining to the use of Structural Equation Modeling 2.7.1 Structural Equation Modeling (SEM) Background
indicators of common factors (Suhr 2006). This research was conducting using both the confirmatory factor analysis and path analysis procedures.
There are several justifications for the use of SEM as well as advantages over traditional statistical methods such as regression analysis. A fundamental premise of multiple regression analysis is that all variables are assumed to be independent. The fundamental causes of buffer are believed to have multicollinearity. SEM is a multivariate technique incorporating both observed (measured) variables and unobserved (latent constructs) while traditional techniques analyze only measured variables (Suhr 2006). Also, multiple regression ignores measurement error and with a survey of this type there is inherent measurement error stemming from both inaccurate ratings on a Likert scale and inconsistent responses to quantitative questions. The SEM framework accounts for these errors in measurement, thus producing more accurate representations. Finally, standard regression models only allow for explicit modeling of direct effects whereas SEM allows for direct, indirect, and correlative effects to be explicitly modeled (Molenaar et al. 2009).
2.7.2 Structural Equation Modeling use in Construction Research
2.8 Summary
Based on the research to date there seems to be a definite and growing interest in the study of several aspects of buffer in construction (Howell et al. 1993, Ballard and Howell 1995, Goldratt 1997, Ballard 2000a, Ballard 2000b, Horman 2000, Horman et al. 2003, Alves and Tommelein 2004, Horman and Thomas 2005, Lee et al. 2006, Hopp and Spearman 2008). A considerable amount of research has been completed on different types of buffer, factors affecting cost contingency, and factors affecting productivity. That research is used as a foundation for studying the allocation of time buffer to construction project task durations.
As a result of the literature review, several gaps in the body of knowledge have been identified and this proposed research provides the overall framework for taking initial steps to filling those gaps with important contributions regarding the allocation of time buffer to construction project task durations. The identified gaps include:
1. There exists a need to identify the root causes of time buffer from both a frequency and severity standpoint as it is allocated to construction project task durations. 2. The time buffering behavior at different levels of management, different trades, and
different activities has not been researched nor has the comparison been made between the perception of the need for time buffer with the reality of what most often causes variation.
4. To the knowledge of the author, no models have been proposed to describe the thought process and causal structure applied by project managers and field managers when planning for uncertainty and allocating time buffer.
5. No one has documented the effects of using the LPS® on the allocation of time buffer over the course of a construction project or the impact of time buffer on project performance.
CHAPTER 3
3.0 METHODOLOGY
The literature review discussed in the previous chapter, served as the initial step of the research as it identified what research has been conducted and identifies gaps in the knowledge base pertaining to the allocation of time buffer. Those gaps in the body of knowledge drive the objectives. This chapter of the dissertation will detail the design of the work effort undertaken to deliver those objectives. Each of the two surveys and each of the two case studies will be discussed regarding their design and data collection plan.
3.1 Time Buffer Survey
3.1.1 Research Objectives Addressed by the Time Buffer Survey
Objective 1: Identify the causes of time buffer and determine which are the most prevalent and severe in terms of additional time included in construction project task durations.
Objective 2: Quantitatively develop risk profiles of the causes of time buffer so they may be prioritized for mitigation efforts.
Objective 4: Compare and constrast the overall most severe causes of time buffer with the most severe causes of duration variation to identify disconnects between the perception of concerns about uncertainty and the reality of what causes task duration variation.
Objective 5: Identify the underlying factors that correlate the individual causes of time buffer.
Objective 6: Develop the mental model and associated causal structure used by project managers and field level managers (superintendents and foremen) when buffering and planning for uncertainty.
3.1.2 Time Buffer Survey Overview and Design
A questionnaire survey was developed to study which causes of uncertainty or concerns about potential for variation result in the most frequent and severe addition of time buffer in construction task durations. The survey was carried out nationwide, involving foremen, superintendents, and project managers and consisted of three parts. The survey is discussed throughout this section and the full version can be found in Appendix A and Appendix B.
factors that affect productivity (Wambeke et al. 2011). Wambeke et al.’s 50 factors were
cross referenced with additional causes found in literature as well as additional causes recommended by construction industry personnel. In some cases a more general term was applied for a group of related variation factors. For example, eight of Wambeke et al.’s labor
force factors were reduced to labor force reliability, labor force availability, and crew inefficiencies. In this category, morale and language barrier were kept the same, and concerns about being pushed into using more manpower was added. The greatest emphasis in determining the final list of causes was placed on selecting the most relevant causes from a prospective view during the planning or pre-task time frame rather than a retrospective view of what actually caused the variation. In other words, which causes construction personnel are concerned about or perceive as potential for problems due to uncertainty as they assign task durations. This prospective view is an important difference to note between the retrospective look at causes of variation in Wambeke et al.’s research and the causes driving
the need for time buffer in this research.
1) Project Characteristics: Pertains to concerns/uncertainty about characteristics specific to the project and one’s trade.
2) Prerequisite Work: Pertains to items that must be completed before one can start their task. If there is concern or uncertainty the item (permits, prerequisite work, or rework on a prerequisite task) will not be completed on time, then consider to what extent one’s duration
estimate is affected. This can also be thought of as confidence in the schedule or work plan.
3) Detailed Design / Working Method: Pertains to concerns/uncertainty about having an accurate and available design and a feasible working method to complete the required task.
4) Labor Force: Pertains to concerns/uncertainty about availability, reliability, and capability of the labor force to complete the required task.
5) Equipment and Tools: Pertains to concerns/uncertainty about the availability, reliability, and capability of required equipment and tools to complete the required task.
6) Material and Components: Pertains to concerns/uncertainty about receiving the correct and necessary materials from the supplier when and where you need them. This can be thought of as trust or confidence in one’s supplier(s).
7) Work / Jobsite Conditions: Pertains to concerns/uncertainty about the physical space available to perform one’s job.
9) Weather: Pertains to concerns/uncertainty about the climate at the location of the project and what weather conditions are prevalent such as temperatures, rain, and wind.
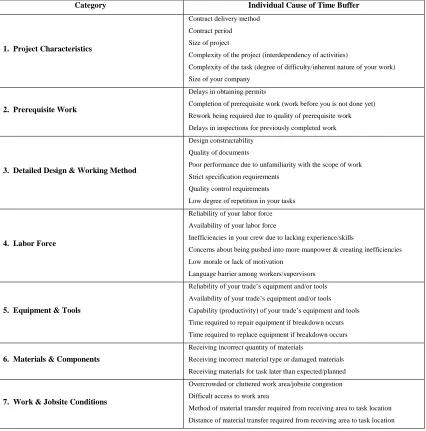
The following table displays the entire list of 47 buffer factors and to which of the nine categories they belong.
Table 3.1: Individual Causes of Time Buffer
Category Individual Cause of Time Buffer
1. Project Characteristics
Contract delivery method
Contract period
Size of project
Complexity of the project (interdependency of activities)
Complexity of the task (degree of difficulty/inherent nature of your work)
Size of your company
2. Prerequisite Work
Delays in obtaining permits
Completion of prerequisite work (work before you is not done yet)
Rework being required due to quality of prerequisite work
Delays in inspections for previously completed work
3. Detailed Design & Working Method
Design constructability
Quality of documents
Poor performance due to unfamiliarity with the scope of work
Strict specification requirements
Quality control requirements
Low degree of repetition in your tasks
4. Labor Force
Reliability of your labor force
Availability of your labor force
Inefficiencies in your crew due to lacking experience/skills
Concerns about being pushed into more manpower & creating inefficiencies
Low morale or lack of motivation
Language barrier among workers/supervisors
5. Equipment & Tools
Reliability of your trade’s equipment and/or tools Availability of your trade’s equipment and/or tools Capability (productivity) of your trade’s equipment and tools Time required to repair equipment if breakdown occurs
Time required to replace equipment if breakdown occurs
6. Materials & Components
Receiving incorrect quantity of materials
Receiving incorrect material type or damaged materials
Receiving materials for task later than expected/planned
Overcrowded or cluttered work area/jobsite congestion
Table 3.1 Continued
8. Management, Supervision, & Information Flow
Confidence in request for information (RFI) process
Liability pressure (liquidated damages, contractual deadlines, etc)
Preparing for duration negotiation
Positive company recognition
Trust in superintendent (based on their reputation, experience, & knowledge)
Trust in project manager (based on their reputation, experience, & knowledge)
Trust in owner (based on their reputation, experience, & knowledge)
Required coordination with other trades
Changes in scope of work (tendency of owner to make changes)
Communication between owner/engineer and project manager
Communication between project manager/superintendent and foreman
Communication between foreman and workers
9. Weather Climate – potential weather conditions associated with the location of the project
3.1.3 Time Buffer Survey Data Collection Plan
the Last Planner System©. The time buffer survey was used to collect responses from construction personnel at three different levels of management: project managers, superintendents, and foremen. The foremen level also included those with the similar job titles of supervisor or trade lead.
Figure 3.1: Section Two of Time Buffer Survey – Ranking of Categories
or allocate for the given cause when planning task durations and to protect against the effects of uncertainty. The respondents chose one of the following seven severity responses: 0, 0.5, 1, 2, 3, 5, or 7, where the six step sizes between the responses are set at 0.5, 0.5, 1, 1, and 2, 2 to accommodating the need for larger noticeable differences with higher severity responses. The decision to use seven choices for both frequency and severity was made to balance having too many choices with still being able to capture just noticeable differences. The time buffer survey took approximately 20 minutes to complete. Figure 3.2 below provides an example of a question from the third section of the contingency survey. The question in the example is about labor related causes.
3.1.4 Time Buffer Survey Pilot Study Calibration
The survey went through multiple drafts and revisions as the researchers attempted to balance the depth and breadth of the survey. The survey had to be simple enough for the participants to not only understand what was being asked but also for them to be willing to take the time to complete the survey and give their honest opinions. At the same time the questions were framed in a manner to allow the collection of quantitative data for analysis. A pilot study was conducted with a construction company in Colorado as well as a local construction company to help avoid potential problems associated with the length, clarity of the questions, and the instructions provided for completion of the survey. Additionally, the pilot study was used to help validate the relevance of the factors chosen and allow suggestion of additional factors. The survey was distributed to two project managers, three superintendents, and three foremen (mechanical, electrical, and roofing) for pilot study completion. Four factors were added and one factor was slightly modified based on discussions with the pilot study participants. “Over commitment” was modified to be “liability pressure” and includes concerns about over committing due to a tight schedule, liquidated damages, and contractual deadlines. The factors of “positive company recognition”, “preparing for duration negotiation”, “concerns about being pushed into using more manpower”, and “poor performance due to unfamiliarity (with the scope)” were added. Based on the research team’s previous experience with a survey, the necessity to translate the
study was the suggestion of both an online and hard copy version of the survey. The two versions allowed foremen and perhaps some superintendents who may not have computer access during the workday to complete a hard copy of the survey, while the online version provided a convenient method for those who do have computer access. Both surveys were of the same format and content, but the hard copy version was used more frequently.
3.1.5 Time Buffer Survey Distribution
3.2 Case Studies
The case studies were a multipurpose and integral part of this research. The primary goal of the case studies was to further validate the survey results while also gathering quantitative data from actual construction projects. The original intent was to conduct case studies with both general and trade contractors and also to perform a study with two companies whose main difference was that one used lean construction techniques and the other used more traditional planning methods. In the end, two companies, who recently participated in research with Dr. Brad Wambeke, continued their support to N.C State University civil engineering research by willingly participating in the time buffer research. One of these companies was a mechanical trade contractor and the other was a large general contractor. A separate study was completed with each of these companies. Attempts to secure other companies’ participation seemed promising based on preliminary discussions
time buffer in the general contractor case study. The following sections describe the overview, design, and data collection plan for each case study.
3.3 Case Study 1 (Mechanical Trade Contractor) 3.3.1 Research Objectives Addressed by Case Study 1
Objective 7: Examine the effect of traditional management and planning on the allocation of time buffer and the associated task variation and productivity.
Objective 9: Determine construction trades and activities to be targeted by management for time buffer and variation reduction. Further, investigate how the reasons for time buffer allocation compare to the causes of variation in practice for a given construction project.
3.3.2 Case Study 1 Overview and Design
construction industry. The project in this case study was the new construction of a 122,000 square foot medical facility with a lump sum total project cost of $33 million. The mechanical and plumbing work completed accounted for $9 million of the project cost. The mechanical and plumbing scope included all the sheet metal, piping, controls, insulation, equipment, and testing and balancing within the central energy plant, data center, medical office building, and outpatient building of the facility. The work was mostly self-performed by the mechanical contractor with a few subcontractors working for them as well. Although interested in the application of lean construction techniques, the contractor did not use the LPS® for task planning. The same project manager and superintendent remained on the job for the entire 14 month duration and were directly involved in the task planning. The project ran from January 2012 through February 2013 and data was collected for the entire project duration.
3.3.3 Case Study 1 Data Collection Plan
The task data collected over the twelve month study period included the activity description, phase (mechanical or plumbing), activity type, and schedule information to include the planned schedule and durations, the best possible durations, and the actual schedule and durations. Additionally, productivity rates were collected for the different activity types and project as a whole. The method used for determining time buffer for this case study was using the company’s baseline productivity rates. These rates for this
company are based on historical records of their performance and represent the productivity expected if everything goes smoothly and constraints have been removed. It is possible that some time buffer does still exist in these baseline productivity rates and that is noted by the researchers as a limitation of the research. The best possible duration for the planned task was calculated using this baseline productivity, and the difference between the scheduled duration and the best possible duration was recorded as the time buffer for the task. The researchers and participating company felt this calculation was the most accurate indicator of time buffer possible for this project. Duration variation data was also calculated in this case study. The specific variation studied was any task durations that actually took longer than what was planned. These “delays” were calculated for comparison with the time buffer.