20th International Conference on Structural Mechanics in Reactor Technology (SMiRT 20) Espoo, Finland, August 9-14, 2009 SMiRT 20-Division 6, Paper 1826
Analytical Study for Failure Probability of PCCV
under Pressure Load after Seismic Experience
Tetsuya Okutani
aand Yoshihiko Hino
ba
Project Development Department, The Japan Atomic Power Company, Tokyo, Japan, e-mail: [email protected]
b
Engineering Department, Nuclear Facilities Division, Obayashi Corporation, Tokyo, Japan, e-mail: [email protected]
Keywords: Probabilistic safety assessment (PSA), Severe accident, Failure probability,Fragility assessment,
Finite element method, PCCV
1
ABSTRACT
In order to establish a failure probability evaluation method for a prestressed concrete containment vessel (PCCV), failure mechanisms of PCCV were investigated with regard to failures due to earthquakes and severe accidents. The analysis was performed for the case when a severe accident would occur following an earthquake to investigate the process causing the failure of the PCCV. Then using an uncertainty propagation analysis technique, the failure probability of PCCV by the severe accident was estimated and the effect of the seismic ground motion experienced just before the severe accident on the fragility curve was identified. The series of analysis indicated that the failure probability of PCCV by severe accidents would be consistent regardless of the magnitude of seismic ground motions experienced just before the severe accidents, and almost same fragility curves would be obtained. An important finding in this study is that the failure probability of PCCV could be evaluated independently for failures by earthquakes and severe accidents.
2
INTRODUCTION
Recently, the probabilistic safety assessment (PSA) has become increasingly important in Japan because of enhanced safety need to nuclear power plants, and its method has been developed. Meanwhile seismic PSAs conducted by industries have been limited to the level-1 seismic PSA (evaluation of core damage frequency), and higher level seismic PSAs than the level-1 are likely to be required in the future. However, limited studies have been made and little information available on containment vessel failure probability which would be the basis for the higher level seismic PSAs. Therefore analytical study was made on actual PCCVs aiming at establishing a methodology on containment vessel failure probability evaluation for the higher level seismic PSAs. The higher level seismic PSAs require evaluating radioactivity release probability, which entails assuming local damage of the containment vessel in estimating the containment vessel failure probability. This study employed the nonlinear 3D finite element method (FEM), which allowed taking the local damage of the containment vessel into account.
3
ANALYSIS MODEL
3.1 Description of the model
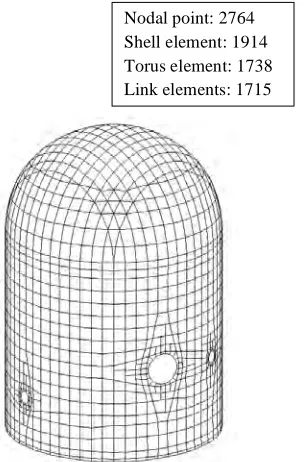
concrete shell elements. Additional reinforcements around the E/H and A/Ls and buttresses were also modelled. It should be noted that several tendons were bundled to form a single tendon in the model and relative slip between the tendon and the concrete was taken into account by connecting the tendon and the concrete with a two nodes link element (sliding element). Figure 3.1 shows the model for the analyses. Computer code used here is FINAL developed by Obayashi Corporation.
3.2 Material properties
For the probabilistic assessment of the capacity of the PCCV, variability in properties of the component materials needs to be evaluated appropriately. In this study, the two-point estimate method was used for the uncertainty propagation analysis. It is reported that it has provided almost equivalent results to that from the Mont Carlo method in the evaluation of nonlinear seismic responses of the PWR reactor buildings, and thus it is very effective as an uncertainty propagation analysis tool [1].
Variables used for the analysis include strength and damping of concrete and yield strength, tensile strength and rupture strain of steel (rebar, tendons and liners). The values at the sampling points and their weights were obtained according to the equations below based on the two-point estimate method. Table 3.1 shows the obtained values and weights for the variables. These material properties are based on the values of the actual PCCV. Probability characteristics are based on the results of the previous Japanese studies.
! "
µ+ #
=
1
x ,
! " !
2
1= +
p
! "
µ+ +
=
2
x ,
! " !
2
2= #
p
Where,
1
x , x2: Values at the sampling points
1
p , p2: Weights for the values at the sampling points
Assuming that the variable x follows the log-normal distribution,
3 4 2
2 2 3
µ ! µ !
" = + , # = "2+!2
( : Mean, : Standard deviation
Table 3.1 Values at the sampling points and their weights for the variables
based on the two-point estimate method
x1 x2 p1 p2
Strength (N/mm2) 41.2 57.7 0.130 51.5 66.8 0.596 0.404
Damping (%) ! 2 0.250 1.66 2.73 0.679 0.321
Yield strength (N/mm2) 390 449 0.030 436 463 0.522 0.478
Tensile strength (N/mm2) 560 644 0.030 626 664 0.522 0.478
Rupture strain (%) 13.0 26.0 0.120 23.4 29.7 0.589 0.411
Yield strength (N/mm2) 1325 1524 0.020 1494 1555 0.515 0.485
Tensile strength (N/mm2) 1515 1742 0.015 1717 1769 0.511 0.489
Rupture strain (%) 4.5 6.75 0.080 6.27 7.36 0.560 0.440
Yield strength (N/mm2) 225 252 0.100 230 281 0.574 0.426
Tensile strength (N/mm2) 410 443 0.040 426 462 0.530 0.470
Rupture strain (%) 19.0 28.5 0.100 26.0 31.8 0.574 0.426
Tendon
Liner Concrete
Nominal Coeff. of
variation
Rebar
Weights
Mean Values
1
Nodal point: 2764 Shell element: 1914 Torus element: 1738 Link elements: 1715
4
FAILURE MECHANISM AND FAILURE INDEX
4.1 Study of seismic case
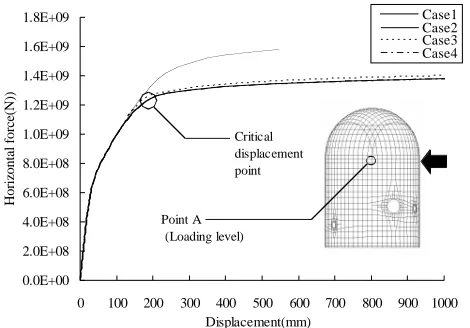
In order to understand failure mechanism of the PCCV by seismic forces, horizontal forces assuming seismic loads were statically applied to the spring line level to see overall deformation of the PCCV and behaviours of the components including reinforced concrete, tendons and liners. Figure 4.1 shows the load-displacement relation in Case 1 (as shown below) at the loading position. The figure indicates that the displacement increases sharply at a certain point (hereafter called as critical displacement point) by the horizontal force. The critical displacement point is considered to be the point where the rigidity of the PCCV decreases rapidly, resulting in loss of stable structure. Then in order to understand the behaviour of the components at the critical displacement point, analyses were performed for four cases with different material characteristics as shown below.
Case 1: Nonlinear material characteristics of rebar, tendon and liner (Reference model)
Case 2: Linear material characteristics of rebar and nonlinear material characteristics of tendon and liner
Case 3: Linear material characteristics of tendon and nonlinear material characteristics of rebar and liner
Case 4: Linear material characteristics of liner and nonlinear material characteristics of rebar and tendon
Figure 4.1 shows load-displacement relationship for the above cases. The figure indicates that the Case 2 is significantly different from the Case 1, while the Cases 3 and 4 are similar to the Case 1, implying significant change at the critical displacement point due to nonlinear characteristics of the rebar.
Figure 4.2 shows the concrete crushing zone before and after the critical displacement point for the Case 1. Figure 4.3 shows the yielded zone of the rebar before and after the critical displacement point. These figures indicate rapid expansion of the zones where concrete is crushed and rebar is yielded after the critical displacement point.
Figure 4.4 shows relations of maximum strain and displacement at the loading position for the liner, rebar and tendon. The figure indicates that the liner was broken when the displacement at the loading position reached 3.5 m in analysis, which is much larger than the critical displacement point.
The above results demonstrate that the critical displacement point is the point where the rebar is yielded rapidly at an extended zone and the zone where concrete is crushed is expanded rapidly; i.e. the point where the RC structure is collapsed. Meanwhile the analysis suggests that the liner will not be broken until the horizontal displacement reaches to 3.5 m in analysis which is much larger than the critical displacement point, however, in reality, it is unlikely that the liner is not damaged at the condition where the concrete wall is almost collapsed. Therefore the critical displacement point was employed as a failure index of the PCCV against seismic force in this study.
0.0E+00 2.0E+08 4.0E+08 6.0E+08 8.0E+08 1.0E+09 1.2E+09 1.4E+09 1.6E+09 1.8E+09
0 100 200 300 400 500 600 700 800 900 1000 Displacement(mm)
H
o
ri
zo
n
ta
l
fo
rc
e(
N
))
Case1 Case2 Case3 Case4
Point A (Loading level)
Critical displacement point
0.0E+00 2.0E-02 4.0E-02 6.0E-02 8.0E-02 1.0E-01 1.2E-01 1.4E-01 1.6E-01 1.8E-01
0 1000 2000 3000 4000 5000
Horizontal displacement (mm)
S
tr
ai
n
Liner: No.90911 Tendon: No.30427 Vertical Rebar: No.430 Breaking point
Figure 4.1 Load-displacement relation at the point A Figure 4.4 Max. strain-displacement relation
4.2 Study of severe accidents case
In order to understand failure mechanism of the PCCV by the internal pressure during severe accidents, internal pressure was statically applied to see overall deformation of the PCCV and behaviours of the components including reinforced concrete, tendons and liners. Analyses were performed for four cases with different material characteristics as described above. Figure 4.6 shows the pressure-maximum displacement relation for the Case 1. The figure indicates a point due to nonlinear characteristics of the rebar or liner (point A around the pressure of 1.1 MPa), and a point due to nonlinear characteristics of the tendon (point B around the pressure of 1.3 MPa). The point B may correspond to the critical displacement point during earthquakes because the rigidity decreases and deformation developed rapidly from the point.
Figure 4.7 shows the zone where the rebar is yielded and Figure 4.8 shows the zone where the tendon is yielded around the points. These figures indicate that yielded zone is rapidly expanded after the point A for the rebar and after the point B for the tendon.
Figure 4.9 shows the maximum strain-maximum displacement relations for the liner, rebar and tendon. The figure indicates that maximum displacements when these elements are broken were about 1.5 m, 3.4 m
Figure 4.2 Concrete crushed zones around the critical displacement point
1.2×10⁹
N 1.3×10⁹N 1.4×10⁹
N
Figure 4.3 Vertical rebar yielded zones around the critical displacement point
1.2×10⁹
N 1.3×10⁹N 1.4×10⁹N
Figure 4.5 Comparison of the analytical results with the shake-table test results 0.0
2.5 5.0 7.5 10.0 12.5 15.0
0.0E+00 2.0E-03 4.0E-03 6.0E-03 8.0E-03 1.0E-02
Deflection angle (rad)
A
v
er
ag
e
sh
ea
r
st
re
ss
(N
/m
m
2 )
Analytical result
Shake-table test result Maximum capacity point in the test Average shear stress: 13.8 N/mm2 Angle of member: 5.57x10⁻³ (rad) Critical
The above results suggest that the point A is the point where the rebar is yielded rapidly at a large zone and the point B is the point where tendons are yielded is expanded rapidly. It should be noted that, for the analysis of the internal pressure, in spite of large deformation due to the yielding of the rebar and tendon, the stresses caused in the liner would be tension only, which is different from the large deformation after critical displacement point during earthquakes where shear failure or crushing of the concrete would occur at different locations which would cause unexpected force to the liners and liner anchors. This implies that the liner would continue deformation even after the point B until the failure of the tendon. It would be reasonable to assume that the liner would be broken when the tendon is broken because major resisting elements against the inner pressure disappear and the PCCV could not keep its stable shape. Thus the rupture of the tendon was employed as a failure index of the PCCV during severe accidents in this study.
0.0E+00 2.0E-01 4.0E-01 6.0E-01 8.0E-01 1.0E+00 1.2E+00 1.4E+00 1.6E+00 1.8E+00 2.0E+00
0 100 200 300 400 500 600 700 800 900 1000
Displacement(mm)
P
re
ss
u
re
(M
P
a
)
Case1 Case2 Case3 Case4
Point A Point B
3386.9 5117.4
1517.5
0.0E+00 5.0E-02 1.0E-01 1.5E-01 2.0E-01 2.5E-01 3.0E-01 3.5E-01 4.0E-01 4.5E-01 5.0E-01
0 2000 4000 6000 8000 10000
Maximum displacement (mm)
S
tr
ai
n
Liner: No.91210 Horizontal rebarr: No.1112 Tendon: No.11209 Breaking point
5
ANALYSIS OF SEVERE ACCIDENTS SUBSEQUENT TO EARTHQUAKE
5.1 Analysis conditions
Assuming severe accidents after an earthquake, inner pressure analyses were performed subsequent to the seismic response analysis. Four seismic ground motion levels were used as inputs in the seismic response analysis; 1000, 2000, 3000 and 4000 Gals. For the inner pressure analysis, residual strain and damage of the concrete from the seismic response analysis were used as initial conditions. The thermal load was not taken into account in this study since it is reported that the thermal load at the severe accident has little impact on the ultimate capacity for pressure of the PCCV [2]. Input seismic wave form and spectrum used in the seismic response analysis are shown in Figure 5.1. Input seismic wave for each level was multiplied by factors to the input seismic wave shown in Figure 5.1. Analysis conditions for the seismic response analysis and inner pressure analyses are shown in Table 5.1.
1.2MPa 1.1MPa
1.0MPa 1.2MPa 1.3MPa 1.4MPa
Figure 4.6 Pressure-displacement relationship at maximum deformation point
Figure 4.9 Maximum strain-displacement relationship
Figure 4.7Horizontal rebar yielded zones
around the point A
Table 5.1 Analysis conditions
Analysis type
Seismic wave Artificial wave for seismic PSA
Max. acceleration 1000Gal, 2000Gal, 3000Gal, 4000Gal
Duration 15 sec (0-10 sec used for analyses)
Step 1/500 sec (5000 steps/10 sec in total)
Inner pressure Increased to 1.8 MPa
Step 0.002 MPa (900 steps in total)
Seismic response analyses
Inner pressure analyses
Analysis conditions
5.2 Analysis results
Analyses were performed with conditions described above for cases in which only inner pressure is applied and inner pressure after seismic ground motions is applied. Results are shown below.
Distribution of displacements: Differences were observed in the deformation mode between cases with and without seismic ground motions and those with different load level of seismic ground motions, which suggests that differences in the initial conditions at the start of applying the inner pressure (failure status of the concrete and residual strain in the steel) have effected on the subsequent deformation. However, the differences were become less remarkable at the increased pressures. Figure 5.2 shows the distribution of the displacements and the Figure 5.6 relationship between the inner pressure and the maximum displacement.
Strain in the liner: Residual strains in the liner at the start of applying the inner pressure were considerably different depending on the input seismic ground motion level, however, the distribution of strains in the liner were almost the same for each input cases at the increased pressures. Large strain development was observed at the boundary part of thickened part around the opening and the general part, and the adjacent part of the buttress. Figure 5.3 shows the strain distribution in the liner and Figure 5.7 relationship between the inner pressure and the maximum strain in the liner.
Strain in the rebar: Locations of the maximum strain are varied by conditions, i.e. with or without, and level of seismic ground motions, depending on the deformation mode; however, the strain distribution became similar as the pressure is increased. The location where the large strains were observed in the rebar was outside of the horizontal rebar in each case. Figure 5.4 shows strain distributions in the rebar and Figure 5.8 relationships between the inner pressure and the maximum strain in the rebar.
Strain in the tendon: No significant difference in the strain in the tendon was observed between cases with or without seismic ground motion and those with different load level of input seismic ground motion. It would be because that tendons are not suffered from any damage, keeping integrity, even during the large input seismic ground motion. The tendon were yielded at about 1.2 MPa and reached the rupture strain at about 1.5 MPa, regardless of with or without, or level of the seismic ground motion. Figure 5.5 shows strain distributions in the tendon and Figure 5.9 relationships between inner pressure and the maximum strain in the tendon.
GT2 PCCV WAVE2006
RANDOM_21958
0. 01 0. 10 1. 00 10. 00
0. 01 10. 00
0. 1000. 2000. 3000.
Peri od ( sec. )
Ac
ce
le
ra
ti
on
(
g
al
)
TAR01 TAR05 SPA01 SPA05
Figure 5.1 Input seismic wave form and spectrum
TI ME ( sec. )
0. 5. 10. 15. 20. 25. 30.
- 600. 0. 600.
AC
CE
LE
RA
TI
O
N
ga
l
ACC. MAX = 0. 620E+03 gal ( 2. 03 sec. )
TI ME ( sec. )
0. 5. 10. 15. 20. 25. 30.
-50. 0. 50.
VE
LO
CI
TY
ki
ne
VEL. MAX = 0. 388E+02 ki ne ( 4. 46 sec. )
TI ME ( sec. )
0. 5. 10. 15. 20. 25. 30.
-30. 0. 30.
D
IS
PL
A
CE
ME
NT
c
m
DI S. MAX = - 0. 175E+02 cm ( 3. 33 sec. )
Pressure only (1.5 MPa)
Pressure after earthquake (4000Gal+1.5MPa)
Pressure only (1.5 MPa)
Pressure after earthquake (4000Gal+1.5MPa)
Figure 5.2 Deformation contour Figure5.3 Liner strain contour
Pressure only (1.5 MPa)
Pressure after earthquake (4000Gal+1.5MPa)
Pressure only (1.5 MPa)
Pressure after earthquake (4000Gal+1.5MPa)
Figure 5.4 Horizontal rebar strain contour Figure5.5 Tendon strain contour
0.0 0.2 0.4 0.6 0.8 1.0 1.2 1.4 1.6 1.8 2.0
0 500 1000 1500 2000
Displacement(mm) P re ss u re (M P a ) Pressure only 1000Gal+Pressure 2000Gal+Pressure 3000Gal+Pressure 4000Gal+Pressure 0.0 0.2 0.4 0.6 0.8 1.0 1.2 1.4 1.6 1.8 2.0
0% 2% 4% 6% 8% 10%
Strain P re ss u re (M P a ) Pressure only 1000Gal+Pressure 2000Gal+Pressure 3000Gal+Pressure 4000Gal+Pressure 0.0 0.2 0.4 0.6 0.8 1.0 1.2 1.4 1.6 1.8 2.0
0% 2% 4% 6% 8% 10%
Strain P re ss u re (M P a ) Pressure only 1000Gal+Pressure 2000Gal+Pressure 3000Gal+Pressure 4000Gal+Pressure 0.0 0.2 0.4 0.6 0.8 1.0 1.2 1.4 1.6 1.8 2.0
0% 2% 4% 6% 8% 10%
Strain P re ss u re (M P a ) Pressure only 1000Gal+Pressure 2000Gal+Pressure 3000Gal+Pressure 4000Gal+Pressure
Figure5.6 Relationship between inner pressure
and maximum displacement
Figure5.7 Relationship between inner pressure and
maximum strain of the liner
Figure5.8 Relationship between inner pressure
and maximum strain of the rebar
Figure5.9 Relationship between inner pressure
6
ESTIMATION OF FAILURE PROBABILITY
6.1 Estimation of failure probability during earthquake
Failure probability during earthquakes was estimated using shear strain of the cylinder wall at the critical displacement point as defined in the section 4.1 as an index. The shear strains used in this estimation are the largest one among shear stresses at each layer of cylinder of the PCCV which are divided into five layers along the height. Table 6.1 shows the results of the estimation of failure probability during earthquakes. As indicated in the table, the failure probability was nearly zero % even against the input level of 4,000 Gal, suggesting no failure of PCCV by earthquake.
Table 6.1 Estimates of failure probability during earthquakes
Mean Median Lognormal SD
4000 None 2789 2787 0.03 0.000
Capacity
(Critical disp. Point) - 4763 4756 0.05
-Max. Shear strain (_) Failure
probability Seismic ground
Motion (Gal)
Pressure (MPa)
6.2 Estimation of failure probability during severe accidents and during severe accident subsequent to
earthquake
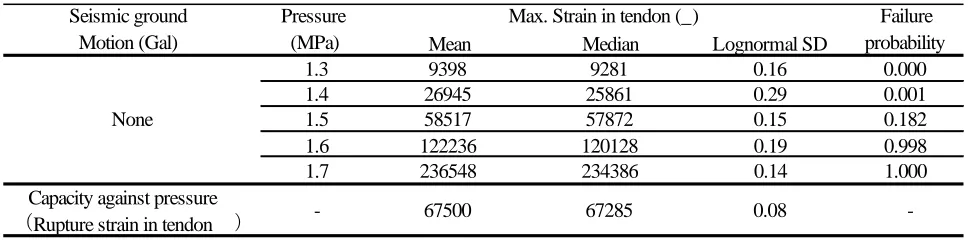
Failure probabilities during severe accidents and during severe accident subsequent to earthquake were estimated using the tendon rupture point as defined in the section 4.2 as an index. Table 6.2 shows the results of the estimation of failure probabilities during severe accident and table 6.3 shows the results of the estimation of failure probabilities during severe accident after an earthquake. Fragility curves obtained from these results are shown in Figure 6.1. According to these results, there were almost no differences of the fragility curves between the case with only pressure and the case with input 1000 Gal, 3000 Gal and 4000 Gal. Although the fragility curve of the case with input 2,000 Gal had some difference as compared with the case with only pressure, the difference was 1.4 % in the point of 50% of failure probability.
As shown above, when using the tendon failure point as an index, same type of fragility curve could be obtained regardless of the level of seismic ground motion.
Table 6.2 Estimates of the failure probabilities during severe accidents
Mean Median Lognormal SD
1.3 9398 9281 0.16 0.000
1.4 26945 25861 0.29 0.001
1.5 58517 57872 0.15 0.182
1.6 122236 120128 0.19 0.998
1.7 236548 234386 0.14 1.000
Capacity against pressure
!Rupture strain in tendon " - 67500 67285 0.08
-Max. Strain in tendon (_) Failure
probability
None Seismic ground
Motion (Gal)
Table 6.3 Estimates of failure probabilities during severe accidents subsequent to an earthquake
Mean Median Lognormal SD
1.3 11911 11393 0.30 0.001
1.4 30047 29255 0.23 0.001
1.5 57064 56539 0.14 0.131
1.6 109103 106477 0.22 0.974
1.7 216026 211425 0.21 1.000
1.3 15489 14714 0.32 0.001
1.4 37299 36120 0.25 0.010
1.5 68930 67423 0.21 0.498
1.6 130202 126906 0.23 0.996
1.7 227373 223918 0.17 1.000
1.3 11171 10560 0.34 0.001
1.4 28377 27215 0.29 0.002
1.5 56253 55327 0.18 0.159
1.6 107257 104885 0.21 0.975
1.7 204116 200481 0.19 1.000
1.3 15822 15229 0.28 0.001
1.4 32700 32165 0.18 0.001
1.5 57801 57367 0.12 0.134
1.6 106091 104347 0.18 0.986
1.7 200931 198329 0.16 1.000
Capacity against pressure
!Rupture strain in tendon " - 67500 67285 0.08
-3000 4000 2000 1000 Seismic ground Motion (Gal) Pressure (MPa) Failure probability Max. Strain in tendon (_)
0.0 0.2 0.4 0.6 0.8 1.0
0.0 0.2 0.4 0.6 0.8 1.0 1.2 1.4 1.6 1.8
Pressure(MPa) F a il u re p ro b a b il it y Pressure only 1000Gal+Pressure 0.0 0.2 0.4 0.6 0.8 1.0
0.0 0.2 0.4 0.6 0.8 1.0 1.2 1.4 1.6 1.8
Pressure(MPa) F a il u re p ro b a b il it y Pressure only 2000Gal+Pressure 0.0 0.2 0.4 0.6 0.8 1.0
0.0 0.2 0.4 0.6 0.8 1.0 1.2 1.4 1.6 1.8
Pressure(MPa) F a il u re p ro b a b il it y Pressure only 3000Gal+Pressure 0.0 0.2 0.4 0.6 0.8 1.0
0.0 0.2 0.4 0.6 0.8 1.0 1.2 1.4 1.6 1.8
Pressure(MPa) F a il u re p ro b a b il it y Pressure only 4000Gal+Pressure
Figure 6.1 Comparison of fragility curves
7
CONCLUSION
Findings obtained from this study are the followings.
Deformation of the PCCV will be developed rapidly during earthquake at a certain point defined as critical displacement point due to the failure of the reinforced concrete portion. The critical displacement point was used as a failure index of the PCCV during earthquakes.
For failures during severe accidents, the rupture of the tendon was used as a failure index of the PCCV, since the tendon failure will be precedent to the failure of the liner.
The failure probability of the PCCV during earthquake was estimated using the critical displacement as an index of failure to be almost zero % even against the input level of 4,000 Gals.
The failure probability of the PCCV during severe accident subsequent to an earthquake was estimated using the tendon failure point as an index of failure, and it was almost consistent regardless of the magnitude of seismic ground motion experienced just before the severe accident and the same trend was confirmed for the fragility curves.
The above results suggest that the failure probability of PCCV could be evaluated independently for failures by earthquakes and severe accidents.
REFERENCES
[1] A. Shimizu, T. Ugata, Y. Kobayashi, M. Hirota, M. Sato,: Analytical study on Analysis Methods of Several Random Variables for Seismic Nonlinear Responses of Reactor Buildings, SMiRT-12, Volume K2: Seismic Response Analysis and Deign, pp.13-18, Aug., 1993.
[2] Kawasato T., Ohba M., et al.: Analytical Study for Ultimate Pressure Capacity of PCCV Considering Thermal Effect, SMiRT19 (H06/3), Toronto, 2007.
[3] Overpressurization Test of a 1:4-Scale Prestressed Concrete Containment Vessel Model, NUREG/CR-6810 Report, USA, SAND2003-0840P.
[4] Pretest Round Robin Analysis of a Prestressed Concrete Containment Vessel Model, NUREG/CR-6678 Report, USA, SAND 00-1535.
[5] Yonezawa K., Imoto K., Kato A., Ozaki M., Kiyohara K., Murazumi Y., Sato K.: Pretest and Posttest Analyses for Nonlinear Behavior of 1/4PCCV Model Subjected to Internal Pressure, E-298, The First FIB Congress in Osaka, 2002.