Optimization of Sheet Thickness for CRCA
Sheet Metal Panel in a Storage Rack by
Experimental Analysis of Deflection under
Static Load
Harshad P Pore 1, Sachin S Shinde2, Harshad M Thakur 3,
P.G. Student, Department of Production Engineering, KIT’s College of Engineering, Kolhapur, India1
Assistant Professor, Department of Mechanical Engineering, KIT”s College of Engineering, Kolhapur, India2
Assistant Professor, Department of Production Engineering, KIT’s College of Engineering, Kolhapur, India3
ABSTRACT: This paper focuses on optimization of design parameters such as sheet metal thickness, number of folds used for increasing the strength of sheet metal, raw material selection which ultimately helps in reduction of material and processing cost for ‘CRCA- Cold Rolled Close Annealed’ sheet metal. Storage rack loading panel is chosen for the analysis. For the analysis work the solver used is ANSYS. Detailed discussion with manufacturer of storage racks gave inputs regarding excessive material cost of the panels as well as the failure data for poorly designed panels. Based on the data input from both manufacturer and literature review, certain cases of the panels are developed and modelled on CAD interface and all the models are analysed in solver to find a value of deflection of panel under a selected load value specified by manufacturer. Out of the cases solved optimized deflection is experimentally validated and suggested for manufacturing the panel.
KEYWORDS: Deflection Analysis, Optimization of design parameters, Sheet Metal Optimization, Material Optimization, storage rack panels, Design of storage rack.
I. INTRODUCTION
The field of storage rack manufacturing is has extensive use of structural steel and sheet metals. Storage racks are the most important components in material handling system. Components and goods in industry are repeatedly stored and retrieved from storage racks in industries. Though there is large importance for storage racks, the design area of these racks is not given enough importance because structural material is readily available in the form of channels, angles, plates, sheet metals etc. The manufacturer is only selecting the material arbitrarily based on the load value to be kept on it specified by the customer. Sometimes these values of loads may not be accurate and wrong data may also transferred by the customer end. So the manufacturer has a chance to overdesign the racks so that it can fit for all the uses. This methodology may add an excessive costing of the material as the sheet metal used of high thickness, grade. As well as structural members are also have overdesign in their size and specifications. Our area of work is more concentrated on the horizontal panels used in storage racks for which the sheet metal thickness is arbitrarily chosen by judging the load value to be kept on it. [2] The problem in sheet metal loading panel design is highlighted and given a solution for helping the manufacturer of these storage racks using the FEA and CAD interfaces. [1][8][12]
II. DATA COLLECTION AND SELECTION OF LOADING PANEL MODEL (CASE)
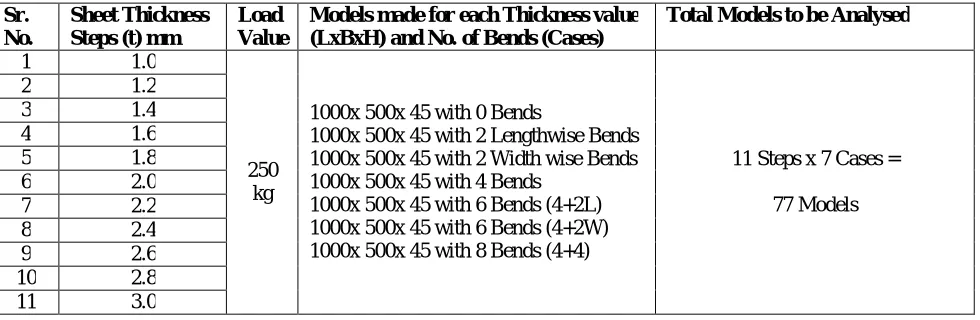
selection of the sheet thickness and fold arrangements for the loading panels and the procedure followed is an arbitrary selection of these parameters. That means for a certain load value deflection or failure mode is not predicted but considering the maximum value for thickness the sheet is selected. This value of the thickness may fall wrong and may be as an overdesigned value which is also undesired. Manufacturer suggested one case that he wanted to design a panel for 250kg of load uniformly distributed over the panel, out of optimum thickness from range 1.0 mm – 3.0 mm with CRCA material. For the load of 250 kg we designed the different cases that he used to manufacture. In each sheet thickness there can 7 panels to be developed. This range of CRCA material is varying with the step of 0.2 mm, i.e. if we consider first thickness value as 1 mm the next will be 1.2, 1.4, 1.6... and so on up to 3.0 mm The CRCA material is standard available sheets in these thickness values. Out of these values we selected the best value for the given load and the suitable arrangement for the folds to be provided on panel for which the deflection of panel is minimum. The thumb rule for deflection is it should be less than 5 mm. The summary of the thicknesses and the dimensions of the panels are shown in next table. [14]
Table 1- Summary of Models to analyse
Sr. No.
Sheet Thickness Steps (t) mm
Load Value
Models made for each Thickness value
(LxBxH) and No. of Bends (Cases)
Total Models to be Analysed
1 1.0
250 kg
1000x 500x 45 with 0 Bends
1000x 500x 45 with 2 Lengthwise Bends 1000x 500x 45 with 2 Width wise Bends 1000x 500x 45 with 4 Bends
1000x 500x 45 with 6 Bends (4+2L) 1000x 500x 45 with 6 Bends (4+2W) 1000x 500x 45 with 8 Bends (4+4)
11 Steps x 7 Cases =
77 Models
2 1.2
3 1.4
4 1.6
5 1.8
6 2.0
7 2.2
8 2.4
9 2.6
10 2.8
11 3.0
The Table 1 shown above gives the data regarding specifications of the loading panel models. There is a thickness range Thickness’ column and in each thickness the load is constant, 250 kg. The size and bend arrangement is described in fourth column shown in ‘Sheet of the Table 1. In CRCA material we selected above cases for our study, for these cases we generated the CAD models and analysis of deflection is done. The thickness range selected is suggested by the manufacturer for the given load value. This load is applied as UDL on entire panel.
III.CAD MODEL DEVELOPMENT
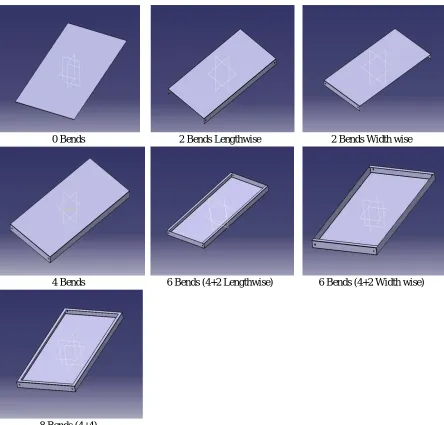
Table 2 – CAD Modelling of Loading Panels
0 Bends 2 Bends Lengthwise 2 Bends Width wise
4 Bends 6 Bends (4+2 Lengthwise) 6 Bends (4+2 Width wise)
8 Bends (4+4)
In above Table 2, total 7 number of loading panel designs are shown. There is difference of the bend arrangement in each panel. All the figures in Table 2 are CAD models. For our study we are developing these CAD models for each thickness value. Further, same models will be analysed using structural analysis in ANSYS which is explained in methodology.
IV.METHODOLOGY
a. Finite Element Analysis of the Models
Though it is not giving the 100% true value, the results are closer to the experimentation results. And FEA can be a suitable supporting tool to predict the deflection. [9][11]
The data used for FEA is as listed below in Table 3-
Table 3 – Material Properties used for FEA Sr.
No. Material Property Value
1 Yield Strength of CRCA 410 MPa
2 Young’s Modulus for CRCA 2.1e5 MPa
3 Poisson’s Ratio CRCA 0.3
4 Load value for 1000x500x45 panel 250 kg
5 Load on Panel in N 2452.5 N
Table 3 is showing the data regarding material properties of CRCA steel which is used in FEA for defining the material. In solver it is taken through ‘Material Model’. Analysis and results of deflection are calculated in solver based on this data only.
b. Element and Meshing of the Models
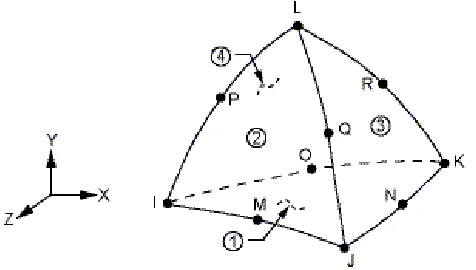
The loading panels analysed are CRCA sheets. There are holes provided on panel width which will fit the panel in storage racks horizontally. The horizontal surface of the panel is used as the loading surface. For sheet metal we used SOLID 187 which is 10 Node Tetrahedron structural elements. This is the most suitable element type for panel model. For this element the mesh size taken is 5. This size can be suitably designed by checking the error in the analysis in ANSYS APDL. The geometry of the element is shown in Fig. 1 below.
Fig. 1 – SOLID 187 Geometry (10 node tetrahedron)
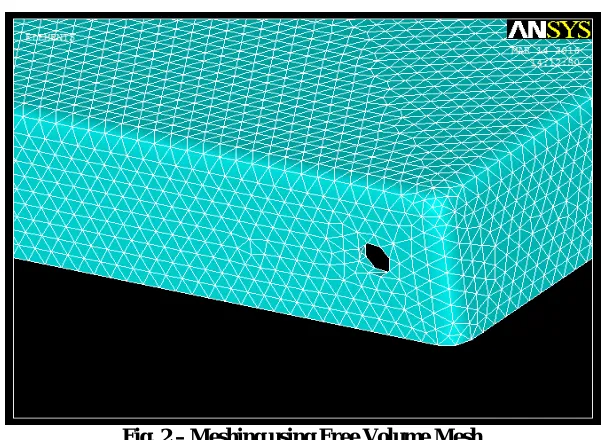
Fig. 2 – Meshing using Free Volume Mesh
in Fig. 2 free meshing is shown, this is a suitable element type for the mesh. The meshing is done as Free Volume Mesh after importing the model and assigning the element to it. Size of the mesh is selected as ‘5’ because as we mesh and solve the entire model we can get a ‘Percent error’ in the results and this error should be less than 20%. With size 5 this is limited to 12- 16% so size taken is suitable.
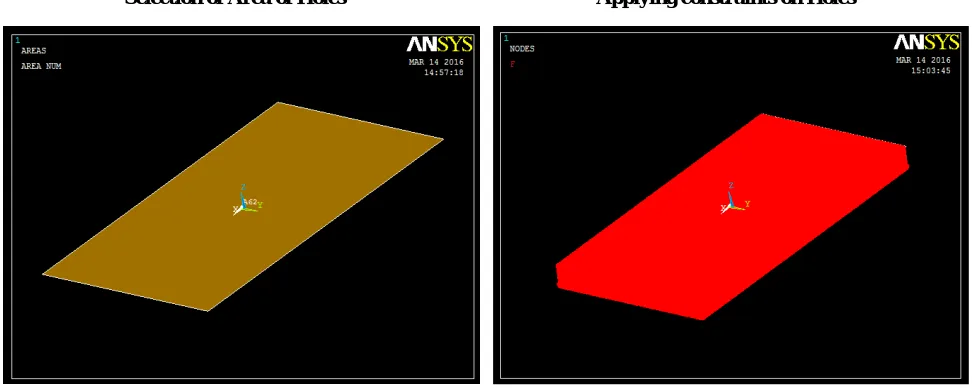
c. Setting the Boundary Conditions and Loading Conditions
The loading panels are provided with hole on width are fixed by bolting in a storage rack to the vertical structure. This gives us the boundary condition as all the degrees of freedom are fixed at the areas of these holes and the load is applied on the top surface area as UDL.
Load = 250 kg
Load in newtons = 250x9.81= 2452.5 N
UDL on Top Surface =
ℎ
2452.5
N
With above formula we can apply UDL on the top surface. For setting the boundary conditions we need to select the area of the bolting holes and plot the nodes on them. After plotting the nodes we apply the constraint by restricting all DOF to zero. So the panel is fixed. For application of the load we need to follow the same procedure to select the top surface area and plotting the nodes on it. Then by dividing the load value by the number of nodes we apply the UDL. The area of load application is 1000x500 = 500000mm2. For aluminium panels, area is 1200x600 = 720000mm2 and the load value is explained as below.
Load = 125 kg
Load in newtons = 125 x 9.81 = 1226.25 N
UDL on Top Surface =
1226.25
All the above procedure is shown in next photographs in Fig. 3.
Selection of Area of Holes Applying constraints on Holes
Selection of Top Surface Area Applying load on Top Surface Area
Fig. 3 – Application of boundary conditions and loading conditions
Fig. 3 is showing the sequence to apply the constraints and loading condition on a particular area. Constraint is the fixing condition of panel on rack. Constraints are applied on bolt holes areas. The top surface area is selected using the selection logic, it is plotted. Then using load option load is applied on each node by plotting area nodes.
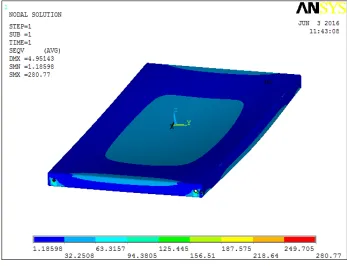
d. Solution for Deflection
Fig. 4 – Optimum Deflection in Case 1000x500x45 3.0 mm thick 8 bends
Table 4 – Deflection calculation by Solver (ANSYS14.0)
e. Results and Discussion
After solving all the cases of the loading panels with 250 kg load, the results are obtained for the deflection. All these results are important for mathematical modelling of deflection. After entire analysis we found the case of 1000x500x45 mm with 3.0 mm thick sheet metal and having 8 bends was optimum as it was having the deflection <5 mm. 5 mm is the deflection value which is considered as safe empirically. So, we limited the safe deflection to this value. Comparison of nearby steps of thickness with the optimum thickness is done according to deflection in chart 1below.
Chart 1 – Deflection comparison (Thickness wise)
Here in chart 1 we can see the decrement in deflection as we increase the thickness of the sheet. So, panel with 3.0 mm thickness are more suitable for the 250 kg load based on this results.
After this analysis we carried the experimental validation of the results for 3.0 mm thick loading panels and compared the results obtained through ANSYS. The cases of 3.0 mm thick panels (1000x500x45) chosen for experimental valdation are –
1. 3.0 mm thick with 2 Bends Lengthwise
2. 3.0 mm thick with 4 Bends all over
3. 3.0 mm thick with 6 Bends (4+2 Lengthwise)
4. 3.0 mm thick with 6 Bends (4+2 Width wise)
5. 3.0 mm thick with 8 Bends (4+4)
f. Experimental Validation of Results
The results obtained through the structural analysis of CAD models using ANSYS gives an idea about selection of optimum thickness and selection of folding arrangement of loading panels for given loading specifications by company. Therefore the selected cases from these results have to be cross verified with the actual working environment as per company specifications.
The CAD model prepared for specific loading conditions satisfies the requirement through the simulation. By validating the results, we are checking and comparing the results for actual deflection while loading the panel. For experimental investigation, we manufactured several prototypes of the panel with optimized parameters and tested it with loading conditions specified by M/s. Phoenix Technocrafts for factors such as load carrying capacity, plastic bending, etc. The results achieved with experimentation will then be compared with the results obtained from FEA to validate the optimized parameters.
0 10 20 30 40 50 60 70
1 2 3 4 5 6 7
De fl e cti o n V a lu e
Model Type with Number of Bends Deflection Variation with Number of Bends
Deflection for 2.6 mm Thick Panel
Deflection for 2.8 mm Thick Panel
g. Manufacturing of Loading Panels for Selected Cases
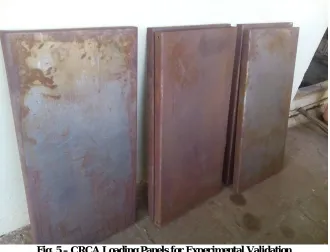
As discussed above different models of panels are selected for actual manufacturing based on the optimized thickness value and number of fold arrangement. These prototypes are made with CRCA steel sheet. We used hydraulic press brake machine to cut and bend the sheet. We prepared total 05 prototypes. Fig. 5 shows the prototypes of the panels.
Fig. 5 – CRCA Loading Panels for Experimental Validation
In Fig. 5 the prototypes shown are used for the experimental analysis of the deflection. As we got the optimum case in 3.0 mm thickness, we made panels using CRCA sheet of 3.0 mm thickness and practically listed the deflection value.
h. Experimental Set up and Methodology
As per given specific loading condition by company, we are working for 250 kg load which is uniformly distributed over an area of panel. In our experimental set up we are testing single prototype at a time.
We used four angles of mild steel as the panels are fixed using the slotted angles. These MS angles are working as vertical supporting members. Total size can be specified as 40 mm x 40 mm x 5 mm. Length of the angle taken is 1.5 m with holes ϕ 10 mm drilled on both ends it. Slotted angles are used for height adjustment of panels depending on load to be kept and size of the object to be kept.
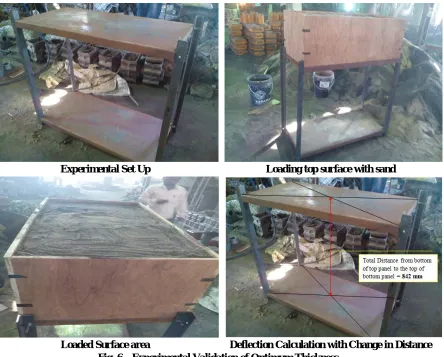
Panel to be tested for load is fixed on top side and supporting panel is fixed on bottom side. Panels are bolted to the angles bolt size used is M8 x 50. In this set up the important thing is the load of 250 kg which is to be exerted as UDL on top panel. As this is UDL we selected foundry sand as our loading media i.e. we are putting 250 kg of foundry sand on the top panel. As we are loading the panel with bulk load we need some additional construction that will held the entire sand on top area of the panel.
Experimental Set Up Loading top surface with sand
Loaded Surface area Deflection Calculation with Change in Distance Fig. 6 – Experimental Validation of Optimum Thickness
In this we can use a dial gauge for measurement of the deflection. In Fig 6 the distance between two panels is shown which can be an alternative method of counting the deflection. Comparison is done between analytical results and experimental results.
i. Comparison of results for deflection through Experimental Validation
The same procedure is repeated for all the panel prototypes and deflections are calculated. Following table shows the result found by experimental testing and comparison with the ANSYS results for deflection. Following table 5 shows the comparison of results.
Table 5 – Comparison of Experimental Results
Loading Panel Fixed Distance (mm) Measured Distance (mm) Deflection (mm) ANSYS Results for Deflection (mm) % Variation in Results 3.0 mm thick with
2 folds lengthwise
842
835 7.0 6.0578 15.5535
3.0 mm thick with
4 folds all sides 835.5 6.5 6.09605 6.6264
3.0 mm thick with 6 folds (4 all sides + 2 Lengthwise)
835.8 6.2 5.78462 7.1807
3.0 mm thick with 6 folds (4 all sides + 2 Width wise)
836 6.0 5.52939 8.5110
3.0 mm thick with
8 folds 837.5 4.5 4.95143 9.1171
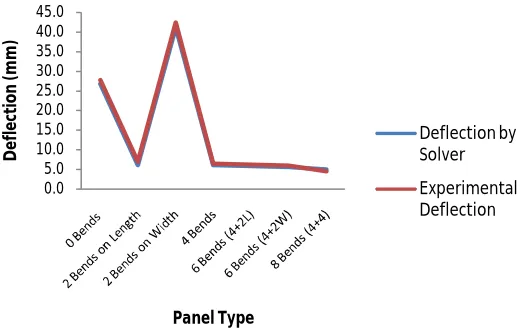
In this table we can see that the experimental results are closer to the analytical results. So the values obtained for all the panels can be used for further work of mathematical modeling and DSS development. See chart 2
Chart 2 – Comparison of Experimental Results with Solver Results for CRCA sheet Panels
Through this experimental testing we got results which are within tolerable limits of the results obtained through ANSYS. After this validation procedure, results obtained in ANSYS are used for the preparation of Decision Support System and Mathematical Model as further part of our study.
This ends up the validation procedure and thereby the method of finding the optimum case among the entire thickness values of the loading panels. Through this study we suggested the manufacturer an optimum case of 3.0 mm thick sheet with 1000x500x45 size, and with 8 bends. Now, the study doesn’s stop here, we are developing the decision support system that would help the manufacturer to predetermine the failure deflection and he could judge the thickness and load values based on prediction of the deflection. This will be based on a mathematical model which will be developed by Regression Analysis in Microsoft Excel based on the deflection data of all these cases.
V. CONCLUSION
1. Rack manufacturers are having the issue of arbitrary selection of sheet thickness which could be non optimal value
for loading panel based on load value which leads to over-design of panels.
2. Experimental validation shows that results obtained through simulation are valid and can be used for further work
of development of DSS or an expert system.
3. Through this experimental analysis of deflection of loading panel we developed a data base for development of mathematical model which will be used in development of DSS.
4. Future scope will include work regarding mathematical model and development of Decision Support System.
VI.ACKNOWLEDGMENT
It is great pleasure to express my deep sense of gratitude to M/s. Phoenix Technocrafts and M/s. Shimpukade Metals, MIDC, Gokul Shirgaon, Kolhapur for their help and guidance in the project for modeling & testing panels. I am also thankful to Dr. V. V. karjinni, Principal, KIT’s College of Engineering, Kolhapur and Dr. S. G. Bhatawadekar, Head, Production Engineering Dept., KITCOEK, for their encouragement in this work.
REFERENCES
1. K. Hariharan, C. Balaji, “Material optimization: A case study using sheet metal-forming analysis” Journal of materials processing technology, Vol. 209, pp.324–331, 2009.
2. M. Aydin Komur, Mustafa Sonmez, “Elastic buckling of rectangular plates under linearly varying in-plane normal load with a circular cutout” Mechanics Research Communications Vol.35, pp.361–371, 2008.
3. Jeom Kee Paik, “Ultimate strength of perforated steel plates under edge shear loading” Thin-Walled Structures Vol.45, pp.301–306, 2007. 4. Kyungsik Kim, Chai H. Yoo, “Ultimate strengths of steel rectangular box beams subjected to combined action of bending and torsion”
Engineering Structures Vol.30, pp.1677–1687, 2008.
5. Emanuele Maiorana, Carlo Pellegrino, Claudio Modena, “Non-linear analysis of perforated steel plates subjected to localized symmetrical load” Journal of Constructional Steel Research Vol.65, pp.959–964, 2009.
6. Carlo Pellegrino, Emanuele Maiorana, Claudio Modena, “Linear and non-linear behaviour of steel plates with circular and rectangular holes under shear loading” Thin-Walled Structures Vol.47, pp.607–616, 2009.
7. Andrew T., Sarawit, Teoman Peko, “Notional load method for industrial steel storage racks” Thin-Walled Structures Vol.44, pp.1280–1286, 2006.
8. Ch. Affolter, G. Piskoty, L. Wullschleger, B. Weisse, “Collapse of a high storage rack”, Engineering Failure Analysis, Vol.16, pp.1846–1855, 2009.
9. Benoit P. Gilbert, Kim J.R. Rasmussen, “Impact tests and parametric impact studies on drive-in steel storage racks”, Engineering Structures, Vol.33, pp.1410–1422, 2011.
10. A.L.Y. Ng, R.G. Beale, M.H.R. Godley, “Methods of restraining progressive collapse in rack structures”, Engineering Structures, Vol.31, pp.1460-1468, 2009.
11. K. M. Zhao, J. K. Lee, “Finite element analysis of three point bending of sheet metals”, Journal of Material Processing Technology, Vol.122, pp.6-11, 2002.
12. Miquel Casafont, MagdalenaPastor, JordiBonada, FrancescRoure, TeomanPek¨oz, “Linear buckling analysis of perforated steel storage rack columns with the Finite Strip Method”, Thin-Walled Structures, Vol.61, pp.71–85, 2012.
13. Benoit P. Gilbert, Kim J.R. Rasmussen, “Determination of accidental forklift truck impact forces on drive-in steel rack structures”, Engineering Structures, Vol.33, pp.1403–1409, 2011.