DOI: 10.1534/genetics.107.081463
Construction of a Sequence-Tagged High-Density Genetic Map
of Papaya for Comparative Structural and Evolutionary
Genomics in Brassicales
Cuixia Chen,* Qingyi Yu,
†Shaobin Hou,
‡Ying jun Li,* Moriah Eustice,
†Rachel L. Skelton,
†Olivia Veatch,
†,§Rachel E. Herdes,* Lauren Diebold,* Jimmy Saw,
‡Yun Feng,**
Wubin Qian,** Lee Bynum,
††Lei Wang,** Paul H. Moore,
‡‡Robert E. Paull,
§§Maqsudul Alam
‡and Ray Ming*
,1*Department of Plant Biology, University of Illinois at Urbana-Champaign, Urbana, Illinois 61801,†Hawaii Agriculture Research Center, Aiea, Hawaii 96701,‡Center for Advanced Studies in Genomics, Proteomics and Bioinformatics, University of Hawaii, Honolulu,
Hawaii 96822,§Department of Molecular Bioscience and Bioengineering, University of Hawaii, Honolulu, Hawaii 96822, **TEDA School of Biological Sciences and Biotechnology, Nankai University, Tianjin Economic-Technological Development
Area (TEDA), Tianjin 300457, China, Tianjin Research Center for Functional Genomics and Biochip, Tianjin Economic-Technological Development Area (TEDA), Tianjin 300457, China,††W. M. Keck Center
for Comparative and Functional Genomics, University of Illinois at Urbana-Champaign, Urbana, Illinois 61801,‡‡USDA-ARS, Pacific Basin Agricultural Research Center,
Hilo, Hawaii 96720 and§§Department of Tropical Plant and Soil Sciences, University of Hawaii, Honolulu, Hawaii 96822
Manuscript received September 9, 2007 Accepted for publication October 7, 2007
ABSTRACT
A high-density genetic map of papaya (Carica papayaL.) was constructed using microsatellite markers
derived from BAC end sequences and whole-genome shot gun sequences. Fifty-four F2 plants derived
from varieties AU9 and SunUp were used for linkage mapping. A total of 707 markers, including 706 microsatellite loci and the morphological marker fruit flesh color, were mapped into nine major and three minor linkage groups. The resulting map spanned 1069.9 cM with an average distance of 1.5 cM between adjacent markers. This sequence-based microsatellite map resolved the very large linkage group 2 (LG 2) of the previous high-density map using amplified fragment length polymorphism markers. The nine major LGs of our map represent papaya’s haploid nine chromosomes with LG 1 of the sex chro-mosome being the largest. This map validates the suppression of recombination at the male-specific re-gion of the Y chromosome (MSY) mapped on LG 1 and at potential centromeric rere-gions of other LGs. Segregation distortion was detected in a large region on LG 1 surrounding the MSY region due to the abortion of the YY genotype and in a region of LG6 due to an unknown cause. This high-density sequence-tagged genetic map is being used to integrate genetic and physical maps and to assign genome sequence scaffolds to papaya chromosomes. It provides a framework for comparative structural and evolutional genomic research in the order Brassicales.
P
APAYA (Carica papaya L.) is a major fruit crop in tropical and subtropical regions worldwide. It is diploid (2n¼18) with a small genome size of 372 Mbp (Arumuganathan and Earle1991), which isadvan-tageous in genomic analyses. Papaya is a member of the family Caricaceae in the order Brassicales, sharing a common ancestor with Arabidopsis 72 million years ago (Wikstro¨ m et al. 2001). The phylogenetic
posi-tioning of papaya near the major model plant Arabi-dopsis and within the agronomically significant Brassicales could make it central for comparative
struc-tural and evolutional genomic research in this group of dicots.
Papaya is a perennial plant species that flowers as early as 3 months and produces fruit in 9 months; it is trio-ecious with an intriguing sex determination system with three basic sex types: male, female, and hermaphrodite. A high-density genetic map of papaya, constructed using 1498 AFLP and three morphological markers re-vealed severe suppression of recombination at the sex determination locus with 225 cosegregating markers accounting for 66% of the markers on linkage group 1 (LG 1) and 15% of the markers genomewide (Maet al.
2004). This AFLP map provided a critical piece of evi-dence for defining the primitive Y chromosome in papaya (Liuet al. 2004). Sequence comparison of Y-specific
frag-ments from males and hermaphrodites confirmed that
1Corresponding author:Department of Plant Biology, 148 ERML,
MC-051, 1201 W. Gregory Dr., University of Illinois at Urbana-Champaign, Urbana, IL 61801. E-mail: [email protected]
there are two slightly different Y chromosomes in pa-paya (Liuet al. 2004). To distinguish these two Y
chro-mosomes, the one controlling male was designated as Y, whereas the other controlling hermaphrodites were de-signated as Yh(Minget al. 2007). The sex chromosome
genotypes of the three sexes are XY for males, XYhfor
hermaphrodites, and XX for females. The combina-tions of YY, YYh, or YhYhare embryonic lethal, indicating
the loss of essential genes for embryo development during the Y chromosome degeneration process. This notion was reinforced by the gene paucity in the male-specific region of the Y chromosome (MSY) (Yuet al.
2007a). The lethal effect of the YY, YYh, or YhYhgenotypes
resulted in a distorted 2:1 hermaphrodite and female ratio in F2 populations derived from crosses between
females and hermaphrodites. The DNA markers at the MSY and its neighboring regions exhibit the 2:1 segre-gation ratio, matching the observed phenotype (Ma
et al. 2004).
Although the AFLP map was high density, it was con-structed with anonymous AFLP markers (Maet al. 2004).
The anonymous dominant markers are not suitable for anchoring bacterial artificial chromosomes (BACs) and whole-genome shotgun sequences. Our attempts to an-chor AFLP markers on a papaya physical map using plate, row, column, and diagonal pools of BAC DNA produced an unacceptably high rate of false positives (Q. Yu, P. H. Mooreand R. Ming, unpublished results).
Thus, developing sequence-tagged DNA markers be-came a high priority for integrating genetic and physical maps and for aligning papaya genome sequence to individual chromosomes.
Simple sequence repeats (SSRs), or microsatellites, with tandem repeats of di- to tetranucleotide sequence motifs flanked by unique sequences are ubiquitous, abundant, and well distributed in eukaryotic genomes (Tautz 1989; Wang et al. 1994; Cardle et al. 2000;
Morganteet al. 2002). Although SSRs were first studied
in humans (Weber et al. 1989), they have now been
found and widely used in nearly all eukaryotes, includ-ing many plant species (Morganteet al. 1993). In
re-cent years, SSRs have become one of the more popular molecular markers with applications in many fields as massive amounts of genomic sequences became avail-able. In contrast to the earlier genetic markers of restric-tion fragment length polymorphisms (RFLPs), random amplified polymorphic DNAs (RAPDs), and amplified fragment length polymorphisms (AFLPs), SSR markers possess the combined advantages of these three types of DNA markers: they are codominant, highly poly-morphic, abundant, distributed throughout the genome, almost always single locus (even in complex genomes), un-ambiguously and specifically mapped to genomes, and based on efficient PCR-based technology. Microsatellite-based linkage maps have been constructed for a wide variety of species, including mammals and several crop plants (Dibet al. 1996; Dietrichet al. 1996; McCouch
et al. 2002; Sharopova et al. 2002; Ihara et al. 2004;
Somers et al. 2004; Songet al. 2004). Although
devel-opment of a high-density SSR map in plants has lagged behind that of mammals, this situation is being improved significantly as more genome sequences become avail-able in selected plant species.
The agricultural significance of papaya in tropical regions, its small genome size, and the unique biology of primitive sex chromosomes were justifications for launching a papaya genome-sequencing project by the Hawaii Papaya Genome Consortium. DNA from female plants of the cultivar SunUp was selected for whole-genome shotgun (WGS) sequencing. In addition, BAC ends of the entire 133 SunUp hermaphrodite BAC library were sequenced. A large collection of nonredun-dant SSR markers was developed from BAC end sequen-ces (BES) and WGS. Here we report a high-density genetic map of papaya based on sequence-tagged micro-satellites. The objectives of this project were to (1) provide anchor markers for integration of genetic and physical maps and for aligning WGS sequences to chromosomes; (2) generate a comprehensive set of low-cost codomi-nant DNA markers for gene tagging and marker-assisted selection; (3) facilitate physical mapping of the MSY region and the corresponding region of the X chro-mosome; and (4) foster comparative and evolutionary genomic research in Brassicales.
MATERIALS AND METHODS
Plant materials: An F2 mapping population was derived from a cross between a female tree of the dioecious variety AU9 and a hermaphrodite tree (pollen donor) of the gyno-dioecious variety SunUp. This population was grown at the Kunia substation on Oahu, Hawaii, along with their parents
AU9 and SunUp, and the F1. Young leaves for DNA isolation
were collected from 36 hermaphrodite plants, 18 female F2
plants, the two parents, and an F1plant.
Sequence sources of SSR markers: A total of 11,976 SSR markers were developed from the following DNA sequence data: (1) 9955 SSRs from papaya WGS of SunUp female, in-cluding 9216 from nonredundant individual sequence reads (designated with prefixes P3K, P6K, and P8K to reflect the in-sert sizes of the WGS libraries) and 739 from assembled contig sequences (designated with the prefix ctg) and (2) 2021 SSRs from 1979 BES and 42 selected subclones of papaya BACs (designated with the prefix CPM).
SSR markers were searched from the whole-genome shot-gun sequences using SSR Finder downloaded from http:// www.maizemap.org. The same program was used to remove redundant SSR and design primers. The programs used for mining SSR markers from BAC end sequences and designing
primers were described previously (Eusticeet al. 2008).
Pri-mers were synthesized by Invitrogen (Carlsbad, CA).
SSR polymorphism survey and mapping: All 11,976 SSR markers were screened for polymorphism using the two par-ents and two pools of bulk segregants. Each pool contained
10 F2plants of hermaphrodites or females, respectively. The
SSR markers were amplified in a 10-ml PCR mix containing
5 ng of template DNA, 0.15 mmof each dNTP, 13PCR buffer,
2.0 mmMgCl
2, 0.15mmeach of reverse and forward primers,
and 0.5 units of Taq polymerase. The PCR reactions were
performed using a PTC-225 thermocycler (MJ Research, Watertown, MA), in which the reaction mixture was incubated
at 94°for 5 min, then for 35 cycles of 45 sec of denaturing at
94°, 30 sec of annealing at 55°, and 45 sec of extension at 72°,
with a final extension at 72°for 7 min. PCR products were
sep-arated on 4% super fine resolution (SFR) agarose (Amresco, Solon, OH) gels and visualized by ethidium-bromide staining. Some SSR markers showed a subtle difference in agarose gels and were separated using fluorescent-tagged SSR primers in a Li-Cor (Lincoln, NE) 4300 DNA analyzer with a 6.5%
gel matrix. The PCR reactions were conducted in a 10-ml PCR
mix containing 20 ng of template DNA, 0.2mmeach of reverse
and M13-tailed forward primers, 0.4mmfluorescence-labeled
M13 primer, 0.2 mmof each dNTP, 13PCR buffer, 2.0 mm
MgCl2, and 0.5 units ofTaqpolymerase. All marker data were
scored by visual inspection and proofread to correct errors. Map construction: Chi-square analysis was performed on each segregating marker to test the goodness of fit to the expected segregation ratios of codominant (1:2:1), sex-linked
codominant (2:1), and dominant (3:1) markers in the F2
pop-ulation. A genetic linkage map was constructed using the
JoinMap (version 3.0) program (vanOoijenand Voorrips
2001). The linkage map was constructed with a minimum LOD score of 4.0 and a maximum recombination rate (u) of 0.40 using the Kosambi mapping function. During map con-struction, markers that appeared in the ‘‘suspected linkage’’ panel of the JoinMap program were manually checked and markers deemed problematic were removed to assure the ac-curacy of the genetic map.
RESULTS
SSR markers polymorphism:Among the 11,976 SSR
markers surveyed, 8763 (73.2%) amplified successfully, yielding clear and discernible bands, whereas the other 3213 (26.8%) did not amplify or produced nonspecific amplification. Among the 8763 amplified SSRs, 1167 (13.3%) showed polymorphism between the parents of the mapping population and were used for genetic mapping in the F2 population. A total of 886 SSRs
(10.1%) produced segregating genotype data for link-age mapping.
Only high-quality SSR markers were used for the genetic map construction. All 886 SSRs were proofread by a different person. Subsequently, 102 of them were eliminated because the PCR products in agarose gels appeared either too faint or too difficult to distinguish from the parental banding patterns in the F2
popula-tion. Another 58 SSRs were removed because 34 of
them had more than five missing data points and 24 caused spurious linkage in the initial mapping attempts. At the end, a total of 726 markers plus the morpholog-ical marker fruit flesh color were used for linkage mapping.
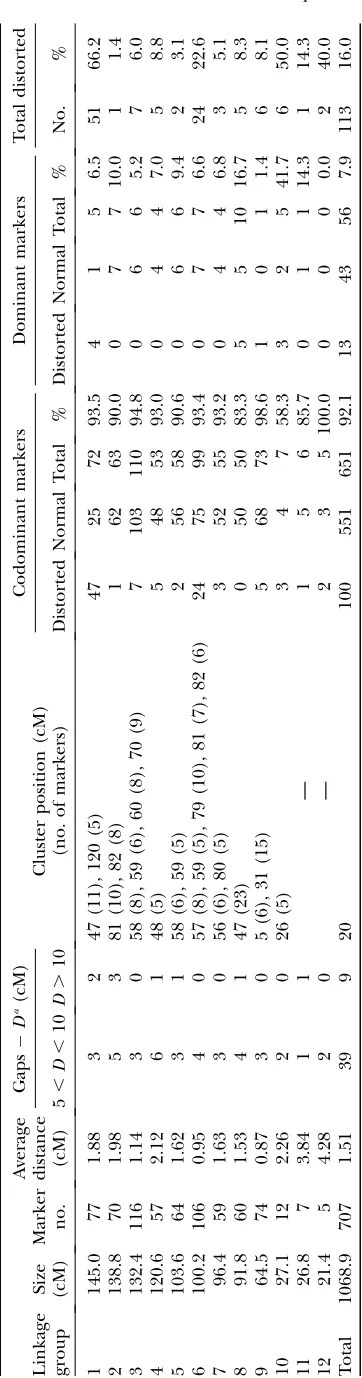
Linkage map construction: A total of 707 markers, including 706 SSR markers and the morphological marker fruit flesh color, were mapped to 12 LGs, including 9 large and 3 short that collectively span 1068.9 cM with an average distance of 1.51 cM between adjacent markers (Figure 1, Table 1). The 9 major link-age groups, which correspond to 9 chromosomes in the papaya genome, covered a total length of 993.5 cM (92.7%) with 683 mapped loci (96.6%) at an average marker density of 1.45 cM. The three short linkage groups covered a total of 75.4 cM with 24 mapped loci (3.4%) and an average distance of 3.1 cM between adjacent markers (Figure 1). The remaining 20 SSRs (2.8%) were assigned into two-marker linkage groups (4 SSRs) or remained unlinked (16 SSRs).
The linkage group of the primitive sex chromosomes, where the MSY is located, was designated LG 1 to be consistent with previous linkage maps (Sondur et al.
1996; Ma et al. 2004). The other linkage groups were
designated LG 2–LG 12, in descending order according to the length of each LG generated from our SSR data. Of 78 markers on LG 1, 11 (14%) cosegregated with sex. Cosegregation of the markers with sex was easy to spot as the first 36 lanes of the gel were hermaphrodites and the last 18 lanes were females (Figure 2). These 11 markers were designated with the letter Y at the third position from right in the marker name for denoting their map-ping to the MSY region and the LG for the sex chro-mosomes. Of the 11 Y markers, 10 formed a cluster, while the other marker, P3K2981YC0, with two missing data points appeared to be 1 cM away. LG 1 turned out to be the largest linkage group in our genetic map. Fruit flesh color (F-color) was mapped to one end of LG 5 linked with marker P3K2152 at a distance of 12.7 cM (Figure 1).
Of the 706 SSRs mapped, 651 (92.1%) were codomi-nant and 56 (7.9%) were domicodomi-nant. See supplemental Table S1 (at http://www.genetics.org/supplemental/) for a complete list of mapped SSRs, including primer sequences, source IDs, and map positions.
Segregation distortion: Two regions on the genetic map showed significant segregation distortion at the
Figure1.—SSR genetic map of papaya linkage groups 1–12. The numerical scale at the left of the map is the cumulative length
of the LG in centimorgans. The alphanumeric codes at the right of the map describe the SSR markers. The first three positions of
the code represent the source or origin of the SSRs (seematerials and methods: P markers from WGS, ctg markers from contig
sequences, and CPM markers from BES sequences). The next-to-last element is the letter indicating the parent from which the
marker was derived (A, AU9; S, SunUp; C, codominant); the last element of the code is information about thex2test (C,
codom-inant fitting a ratio of 1:2:1; 0, not fitting any expected segregation ratio; 2, sex-linked codomcodom-inant fitting a 2:1 ratio; 3, domcodom-inant fitting a 3:1; 5, dominant fitting both 2:1 and 3:1). Eleven SSRs on LG 1 with Y at the third position from the end indicate that they are sex-cosegregating markers. SSRs with L also at the third position from the end indicate that the genotype data were generated by a Li-Cor DNA analyzer. The MSY was mapped on LG 1 and the fruit flesh color was mapped on LG 5.
P,0.05 significant level (chi-square test). One severely distorted region was around the MSY on LG 1 showing 51 (66. 2%) distorted loci of the total loci of 78 (Table 1). The center of this distortion region was at the MSY at
distorted, because they were coded as codominant markers. These distorted markers either completely lack or show severe deficiency of the homozygous pollen-donor SunUp genotype. The second distorted
clear deficiency of heterozygote genotype and in favor of homozygous SunUp genotype.
Another notable phenomenon was the high percen-tages of distorted and dominant markers: 12 (50%) of the 24 markers mapped on the three short groups of LGs 10–12 (Table 1).
SSR markers distribution: The distribution of the SSR markers varied over the 9 major linkage groups. The larger linkage groups, LGs 1, 2, and 4, had lower marker densities of 1.88, 1.98, and 2.12 cM/marker; whereas the relatively shorter linkage groups, LGs 6 and 9, had higher marker densities of 0.95 and 0.87 cM/ marker, respectively. The number of markers per major linkage group ranged from 57 to 116; the length of the major linkage groups ranged from 64.5 to 145.0 cM (Table 1). Chi-square tests of the number of markers mapped to each linkage group indicated a significant deviation from what was anticipated on the basis of the linkage group length (x2¼51.14,P#0.001 in 12 LGs;
x2¼40.25, P # 0.001 in 9 major LGs). The mapped
markers were not evenly distributed (Figure 3). The clustering of SSR loci were observed in each of the 9 major linkage groups, 20 clusters ($5 loci/ cM) were identified on the 9 major linkage groups, including the sex-cosegregating markers and a cluster on LG 10 (Figure 1; Table 1; supplemental Table S1 at http:// www.genetics.org/supplemental/). The largest cluster, including 23 loci wthin a 2-cM interval, was located on LG 8. Also, 42 gaps having a distance.5 cM between adjacent markers were spread across the 9 major linkage groups. Among them, 8 gaps with a distance .10 cM between adjacent markers occurred on 5 major linkage groups: one each on LGs 4, 5, and 8; two on LG 1; and three on LG 2 (Figure 1; Table 1; supplemental Table S1).
DISCUSSION
Our high-density genetic map, based on sequence-tagged SSR markers, significantly improves the capacity for structural and functional analyses of the papaya genome. This map includes 706 (97.2%) of the 726 SSR markers used for map construction, indicating that a vast majority of the papaya genome has been repre-sented. The codominant nature of SSR markers sig-nificantly increased the resolution and accuracy of previous papaya genetic maps, particularly the map of the papaya sex chromosomes (more details below). Suppression of recombination at the male-specific re-gion of the Y chromosome was validated once again, albeit the suppression of recombination was much less pronounced with SSRs than in the map based on dominant AFLP markers (Maet al. 2004). In addition,
suppression of recombination at the centromeric re-gion was notable in all nine major linkage groups. This DNA sequence-tagged map is being used for integration of genetic and physical maps and for aligning whole-genome shotgun sequences to papaya chromosomes.
The BAC end and subclone sequence-derived SSRs immediately connect the genetic and physical maps and serve as anchor markers for assigning supercontigs and scaffolds to linkage groups. The WGS sequence-derived SSRs also anchor the scaffolds to linkage groups through the contigs containing the mapped SSRs. This linkage map provides a framework for gene tagging and map-based cloning. An evenly distributed minimum set of markers can be chosen for mapping quantitative trait loci (QTL) controlling economic and agronomic traits, and linked markers can be used for marker-assisted selection. Sex-cosegregated SSR markers are being used to identify BACs for closing the gaps on the physical maps of the MSY and its corresponding region of the X chromosome.
This sequence-tagged linkage map is being integrated with the papaya physical map and whole-genome shotgun sequence. The papaya physical map was based on a high-information-content fingerprinting method that produces high-resolution fingerprints (Luo et al.
2003) and overgo probes strategically selected from conserved Arabidopsis and Brassica sequences (Q. Yu,
P. H. Moore, A. H. Patersonand R. Ming,
unpub-lished data). These anchored Arabidopsis and Brassica sequences linked the papaya genome to other Brassi-cales genomes. The sequence-based papaya genetic map with anchored genome sequence scaffolds is an effective tool for studying macrosynteny and genome evolution in Brassicales, and papaya is an excellent out-group for comparison with North American and Euro-pean Brassicas.
Suppression of recombination in the MSY: The
largest cluster of cosegregating markers on LG 1 is still the MSY that is completely suppressed for recombina-tion (Liuet al. 2004; Maet al. 2004). However, the 14%
sex-cosegregating SSR markers on LG 1 of the map represented a dramatic reduction from the 66% sex-cosegregating AFLP markers previously reported (Ma
et al. 2004). SSR markers are known to be located near low-copy or genic sequences (Cardle et al. 2000;
Morganteet al. 2002), whereas AFLP markers are
dis-tributed randomly in both genic and nongenic regions (Vos et al. 1995). The MSY region of the papaya Y
chromosome is known to be extremely gene poor (Yu
et al. 2007a), which explains the low abundance of SSR markers. The X and Y sequence divergence is extensive with only 83–87% of the sequences sharing homology (Yu et al. 2007b). This wide divergence provides the
molecular basis for the suppression of recombination in the MSY and for the large cluster of polymorphic AFLP markers that were generated by a combination of a 6-base and a 4-base restriction enzyme digestion pro-ducing polymorphic target AFLP fragments ranging from 25 to 500 bp (Voset al. 1995).
A notable feature of the AFLP linkage map of LG 1, the sex chromosome, was the complete presence of dom-inant markers from the pollen-donor parent SunUp and the absence of markers from the female parent Kapoho (Maet al. 2004). This bias is due to the unique
situation caused by the abortion of the YhYh genotype
(homozygous-dominant markers of SunUp), resulting in 2:1 dominant:recessive pollen-donor parent SunUp markers and 3:0 dominant:recessive female parent Kapoho markers (Maet al. 2004). In this map of mostly
codominant SSR markers, five dominant markers de-rived from the female parent AU9 and one dominant marker from the pollen-donor parent SunUp were mapped. Examination of the genotypes of the five AU9 dominant markers revealed four, five, five, five, and seven recombinants, respectively, among 54 F2
plants. The four markers with either five or seven recom-binants each had one recombinant in a single female plant, which was a rare conversion of a homozygous-dominant genotype to a homozygous-recessive geno-type; the markers showing four recombinants had no recombination in the homozygous-dominant class (female plants). The rest of the recombinants of these AU9 dominant markers occurred in the heterozy-gous class (hermaphrodite plants) that changed to the Figure3.—Distribution of expected and actual numbers of
SSR loci on 12 LGs.
homozygous-recessive class. This type of recombinant, which represents the majority of the recombinants of AU9 dominant markers linked to LG 1, can be distin-guished by mapping with codominant markers, but not by mapping with dominant SunUp markers that mixed both homozygous-dominant SunUp (homozygous-recessive AU9 or Kapoho) and heterozygous markers.
SSR markers are usually codominant. Dominant SSR markers were scored mostly from bands in addition to the allelic target bands of the two parents. In a few cases, only one of the two allelic bands was robust and easy to score and in these cases were scored as dominant markers. The dominant SSR markers from multiple bands likely resulted from the residual heterozygosity within each parent. More AU9 dominant markers were mapped on LG 1 because of the greater residual het-erozygosity in the improved but not released dioecious AU9 than in the gynodioecious cultivar SunUp that has undergone at least 25 generations of self-pollination (Storey1969). Among the genomewide 56 dominant
markers mapped, 49 (87.5%) were derived from AU9. The complete suppression of recombination in the MSY region coupled with the loss of the homozygous YhYhgenotypes skewed the segregation ratio and linked
markers immediately surrounding the MSY region. In addition to the 11 sex-cosegregating SSRs showing a 2:1 segregation ratio, 39 SSRs showed segregation ratios strongly distorted from the expected 1:2:1 segregation ratio: 30 on one side and 9 on the other. Markers farther away from the MSY—57 cM at map position 104 cM of one side and 21 cM at map position 26 cM on the other side—recovered from segregation distortion to fit the expected 1:2:1 ratio. Theoretically, if a marker is 50 cM away from another marker on the same linkage group, it segregates independently, as if it were on a different chromosome. This was the case for markers on one side 57 cM away from the MSY. However, markers on the other side of the MSY recovered from segregation dis-tortion at a distance of 21 cM, much less than the theoretical distance of 50 cM. It is possible that chro-motin structure and features on the one side inhibited recombination so that the 21 cM on one side might represent a compatible physical distance of 57 cM on the other side. This possibility is supported by fluores-cencein situhybridization (FISH) mapping of MSY BACs that appear near the middle of the Y chromosome (Yu
et al. 2007a), which is in contrast to the unequal genetic distance calculated on the two sides of MSY on LG 1.
Suppression of recombination in centromeric regions:
Another notable feature in this linkage map is the clustering of SSR markers on each of nine major linkage groups in the regions postulated to be centromeric. Each cluster contains more than five cosegregating markers (Table 1). An inhibition of meiotic recombination by centromeres was suggested first by Dobzhansky(1930),
and the direct effect of centromeres on suppressing recombination has been demonstrated in yeast where a
cloned centromere from the third chromosome (CEN3) has been shown to decrease recombination when it was artificially integrated into new sites in the genome (Lambie and Roeder 1986). Assuming a
random distribution of markers, low levels of meiotic recombination would cause markers that are physically well separated to cluster on a linkage map. The clus-tering of markers in centromeric regions was recognized and physically verified in the genetic maps of tomato and potato (Tanksleyet al. 1992), rice (Harushima et al.
1998; Chenet al. 2002), and barley (Ramsayet al. 2000).
In Drosophila, up to a 40-fold suppression of recom-bination has been reported near the centromeres (Roberts1965). In rice, the physical distance per
centi-morgan varies with position along the chromosome; the distance averaged 244 kb for the entire rice genome, but in the centromeric regions it was.1 Mb/cM (Chen
et al. 2002).
The largest cluster of markers on LG 1 was at the MSY. FISH of MSY BACs mapped the MSY near the centro-mere; sequence analysis of selected MSY BACs hinted that the MSY might be on only one side of the cen-tromere and not include it (Yuet al. 2007a).
SSR linkage map: Because SSRs are abundant, co-dominant, and cost effective for large-scale genetic and QTL mapping projects, there has been considerable effort toward developing microsatellite maps in a variety of plant species. Such maps are already available in major crop plants that have been the subjects in recent years of significant investments to generate genomic resources for crop improvement, including rice (McCouch et al.
2002), maize (Sharopova et al. 2002), wheat (Somers
et al. 2004; Songet al. 2005), barley (Ramsayet al. 2000),
soybean (Song et al. 2004), and sorghum (Menzet al.
2002). The papaya SSR genetic map was constructed for the papaya genome-sequencing project, which was justi-fied by its agricultural importance in the tropics and its unique reproductive biology. Benefiting from the enor-mous amount of BAC end and whole-genome shotgun sequences, we constructed a high-density linkage map with an average distance of 1.5 cM between adjacent markers, which is 50% denser than the previous papaya AFLP high-density map that had an average interval of 2.2 cM (Maet al. 2004). Another major improvement is
that this SSR map was able to break the large LG 2 of the AFLP map that likely represented more than one chro-mosome. The high-quality codominant SSR markers enhanced the accuracy of the linkage map as shown by nine major LGs for the nine pairs of chromosomes.
The papaya SSR map of 1068.9 cM with 707 markers is much more compact than the 3294.2 cM AFLP map with 1501 markers. The threefold reduction of accumu-lated genetic distance is attributed mainly to the high resolution of codominant SSR markers that separate the three classes of genotypes in the F2population, which
calculate inflated map distances. The AFLP map was constructed from an F2 population of closely related
parents, Kapoho and SunUp, which would assure a high recombination rate and thus increase genetic distance (Kimet al. 2002; Maet al. 2004). The parents of the F2
population used for our SSR map are more distantly related (Kimet al. 2002) and expected to have a lower
recombination rate. Another major reason for the inflated genetic distance is missing data as can be seen by the 1-cM genetic distance caused by two missing data points in the genotype of otherwise perfectly sex-cosegregating marker P3K2981YC0 on LG 1. Any markers with more than five missing data points were eliminated in the SSR data set; this limited any artificial inflation of map distances. Finally, the function of ‘‘sus-pected linkage’’ in JoinMap 3.0 helped eliminate prob-lematic markers that tend to expand genetic distances; a ‘‘suspected linkage’’ function was not available in MAPMAKER 3.0 (Landeret al. 1987) that was used for
constructing the AFLP map.
Segregation distortion: A segregation distorter (SD) gene produces a bias in normal segregation to favor itself, so that the genotype frequency of this gene is increased in a segregating population. The SD system was found first in Drosophila and has been studied extensively (Lyttle 1991). It has also been found in
many plant species, including rice (Xu et al. 1997),
wheat (Farisaet al. 1998), maize (Luet al. 2002), barley
(Kleinhofset al. 1993), and coffee (Kyet al. 2000). In
our high-density SSR map, only two regions on the nine major LGs showed significant segregation distortion. The first was the MSY region on LG 1, caused by post-zygotic selection through the abortion of the Y Y embryo at 25–50 days after pollination (discussed above). The other distorted segregation region was on LG 6 con-taining 24 distorted loci (22.6%) spanning 8 cM. The center of this LG 6 distorted region was at 79.0 cM with 10 cosegregating distorted markers. Examining the genotypes of these distorted markers revealed a clear deficiency of heterozygote classes and a high frequency of homozygous SunUp genotypes. It is unknown which genes possess a selective advantage as a homozygous SunUp genotype and whether these genes are associ-ated with abortion of the Y Y genotype.
In addition to these two distorted regions, another 38 SSRs (5.4%) showed segregation distortion sporadically distributed across the other 10 LGs. These distorted markers could be random events, which is a common feature in plant and animal chromosomes (Taylorand
Ingvarsson2003).
A high percentage of distorted markers was observed on the three small LGs 10–12, even though these three LGs contained only 24 (3.4%) markers on them (Table 1). The high rate of distorted markers on these three LGs might be the consequence of genetic or physical properties in these regions of certain chromosomes that prevented the linkage between these small LGs
to the nine major LGs corresponding to individual chromosomes.
SSR distribution in the papaya genome: The distri-bution of papaya SSR markers over the nine major linkage groups varied significantly. The marker density ranged from 0.87 to 2.12 cM/interval and chi-square tests of the number of markers mapped to each linkage group indicated a significant deviation from what was expected on the basis of linkage group length. Forty-two gaps with a distance$5 cM between adjacent markers were distributed across the nine major linkage groups and, among them, eight gaps$10 cM resided on LGs 1, 2, 4, 5, and 8. On the other hand, 19 SSR loci clusters ($5 loci/cM) were observed in each of the nine major linkage groups, including the cosegregation markers. This phenomenon also occurs in mammals (Dib et al.
1996; Dietrichet al. 1996; Iharaet al. 2004) and many
crop plant species (Ramsayet al. 2000; Temnykhet al.
2001; Menzet al. 2002; Sharopovaet al. 2002; Songet al.
2004; 2005).
SSRs are not uniformly distributed cross the eukary-otic genomes due to a nonrandom physical distribution of SSRs across the chromosomes (Ramsay et al. 2000;
Songet al. 2005). It has been shown that microsatellites
are preferentially associated with nonrepetitive DNA and significantly associated with the low-copy fraction of plant genomes on the basis of the estimation of micro-satellite density in Arabidopsis thaliana, rice, soybean, maize, and wheat (Cardleet al. 2000; Morganteet al.
2002). Among these species, the overall frequency of microsatellites was negatively correlated with genome size and with the proportion of repetitive DNA. In pa-paya and other species, the normally recombining regions might represent euchromatic (i.e., gene-rich) regions, while the regions suppressed for recombina-tion represent heterochromatic regions with abundant repetitive sequences.
SSR polymorphism rate: A previous SSR
polymor-phism survey resulted in 23.4% polymorphic markers between the parental varieties AU9 and SunUp (Eustice
We thank Gail L. Uruu, Lydia Fang, Jan Murray, Jianping Wang, Jong-Kuk Na, Andrea Gschwend, and Andrew Wood for technical assistance. This project was supported by a U. S. Department of Agriculture (USDA) T-STAR grant through the University of Hawaii, a USDA-Agricultural Research Service Cooperative Agreement (CA 58-3020-8-134) with the Hawaii Agriculture Research Center, and startup funds from the University of Illinois at Urbana-Champaign.
LITERATURE CITED
Arumuganathan, K., and E. D. Earle, 1991 Nuclear DNA content of
some important plant species. Plant Mol. Biol. Rep.93:208–219. Cardle, L., L. Ramsay, D. Milbourne, M. Macaulay, D. Marshall
et al., 2000 Computational and experimental characterization of physically clustered simple sequence repeats in plants. Genetics 156:847–854.
Chen, M., G. Presting, W. B. Barbazuk, J. L. Goicoechea, B. Blackmon
et al., 2002 An integrated physical and genetic map of the rice ge-nome. Plant Cell14:537–545.
Dib, C., S. Faure´, C. Fizames, D. Samson, N. Drouotet al., 1996 A
comprehensive genetic map of the human genome based on 5264 microsatellites. Nature380:152–154.
Dietrich, W. F., J. C. Miller, R. G. Steen, M. Merchant, D. Damron
-Boleset al., 1996 A comprehensive genetic map of the mouse
genome. Nature380:149–152.
Dobzhansky, T., 1930 Translocations involving the third and fourth
chromosomes ofDrosophila melanogaster. Genetics15:347–399. Eustice, M., Q. Yu, C. W. Lai, S. Hou, J. Thimmapuramet al.,
2008 Development and application of microsatellite markers for genomic analysis of papaya. Tree Genet. Genomics (in press). Farisa, J. D., B. Laddomadaand B. S. Gilla, 1998 Molecular
map-ping of segregation distortion loci inAegilops tauschii. Genetics 149:319–327.
Harushima, Y., M. Yano, A. Shomura, M. Sato, T. Shimanoet al.,
1998 A high-density rice genetic linkage map with 2275 mark-ers using a single F2population. Genetics148:479–494.
Ihara, N., A. Takasuga, K. Mizoshita, H. Takeda, M. Sugimoto
et al., 2004 A comprehensive genetic map of the cattle genome based on 3802 microsatellites. Genome Res.14:1987–1998. Kim, M. S., P. H. Moore, F. Zee, M. M. Fitch, D. L. Steigeret al.,
2002 Genetic diversity of Carica papaya as revealed by AFLP markers. Genome45:503–512.
Kleinhofs, A., A. Kilian, M. A. Saghai, R. M. Biyashev, P. Hayes
et al., 1993 A molecular, isozyme and morphological map of the barley (Hordeum vulgare) genome. Theor. Appl. Genet.86:705–712. Ky, C.-L., P. Barre, M. Lorieux, P. Trouslot, S. Akaffouet al.,
2000 Interspecific genetic linkage map, segregation distortion and genetic conversion in coffee (Coffea sp.). Theor. Appl. Genet. 101:669–676.
Lambie, E. J., and G. S. Roeder, 1986 Repression of meiotic crossing
over by a centromere (Cen3) inSaccharomyces cerevisiae. Genetics 114:769–789.
Lander, E. S., P. Green, J. Abrahamson, A. Barlow, M. J. Dalyet al.,
1987 Mapmaker: an interactive computer package for con-structing primary genetic linkage maps of experimental and nat-ural populations. Genomics1:174–181.
Liu, Z., P. H. Moore, H. Ma, C. M. Ackerman, R. Makandaret al.,
2004 A primitive Y chromosome in papaya marks incipient sex chromosome evolution. Nature427:348–352.
Lu, H., J. Romero-Seversonand R. Bernardo, 2002 Chromosomal
regions associated with segregation distortion in maize. Theor. Appl. Genet.105:622–628.
Luo, M. C., C. Thomas, F. M. You, J. Hsiao, S. Ouyanget al., 2003
High-throughput fingerprinting of bacterial artificial chromosomes using the SNaPshot labeling kit and sizing of restriction frag-ments by capillary electrophoresis. Genomics82:378–389. Lyttle, T. W., 1991 Segregation distorters. Annu. Rev. Genet.25:
511–557.
Ma, H., P. H. Moore, Z. Liu, M. S. Kim, Q. Yuet al., 2004
High-density linkage mapping revealed suppression of recombination at the sex determination locus in papaya. Genetics166:419–436. McCouch, S. R., L. Teytelman, Y. Xu, K. B. Lobos, K. Clareet al.,
2002 Development and mapping of 2240 new SSR markers for rice (Oryza sativaL.). DNA Res.9:199–207.
Menz, M. A., R. R. Klein, J. E. Mullet, J. A. Obert, N. C. Unruh
et al., 2002 A high-density genetic map ofSorghum bicolor(L.) Moench based on 2926 AFLP, RFLP and SSR markers. Plant Mol. Biol.48:483–499.
Ming, R., Q. Yu and P. H. Moore, 2007 Sex determination in
papaya. Semin. Cell Dev. Biol.18:401–408.
Morgante, M., and A. M. Olivieri, 1993 PCR-amplified
microsatel-lites as markers in plant genetics. Plant J.1:175–182.
Morgante, M., M. Hanafeyand W. Powell, 2002 Microsatellites
are preferentially associated with nonrepetitive DNA in plant ge-nomes. Nat. Genet.30:194–200.
Ramsay, L., M. Macaulay, S. Ivanissevich, K. MacLean, L. Cardle
et al., 2000 A simple sequence repeat-based linkage map of bar-ley. Genetics156:1997–2005.
Roberts, P. A., 1965 Difference in the behavior of eu- and
hetero-chromatin: crossing over. Nature205:725–726.
Sharopova, N., M. D. McMullen, L. Schultz, S. Schroeder, H.
Sanchez-Villedaet al., 2002 Development and mapping of
SSR markers for maize. Plant Mol. Biol.48:463–481.
Somers, D. J., P. Isaacand K. Edwards, 2004 A high-density
micro-satellite consensus map for bread wheat (Triticum aestivumL.). Theor. Appl. Genet.109:1105–1114.
Sondur, S. N., R. M. Manshardtand J. I. Stiles, 1996 A genetic
linkage map of papaya based on randomly amplified polymor-phic DNA markers. Theor. Appl. Genet.93:547–553.
Song, Q. J., L. F. Marek, R. C. Shoemaker, K. G. Lark, V. C. Concibido
et al., 2004 A new integrated genetic linkage map of the soybean. Theor. Appl. Genet.109:122–128.
Song, Q. J., J. R. Shi, S. Singh, E. W. Fickus, J. M. Costaet al.,
2005 Development and mapping of microsatellite (SSR) markers in wheat. Theor. Appl. Genet.110:550–560.
Storey, W. B., 1969 Papaya, pp. 389–408 inOutlines of Perennial Crop
Breeding in the Tropics, edited by F. P. Ferwerdaand F. H. Wit.
Veenman & Zonen N. V., Wageningen, The Netherlands. Tanksley, S. D., M. W. Ganal, J. P. Prince, M. C.deVicente, M. W.
Bonierbaleet al., 1992 High density molecular linkage maps of
the tomato and potato genomes. Genetics132:1141–1160. Tautz, D., 1989 Hypervariability of simple sequences as general
source for polymorphic DNA markers. Nucleic Acids Res.17: 6463–6472.
Taylor, D. R., and P. K. Ingvarsson, 2003 Common features of
segregation distortion in plants and animals. Genetica 117: 27–35.
Temnykh, S., G. DeClerck, A. Lukashova, L. Lipovich, S. Cartinhour
et al., 2001 Computational and experimental analysis of microsatel-lites in rice (Oryza sativaL.): frequency, length variation, transposon associations, and genetic marker potential. Genome Res.11:1441– 1452.
vanOoijen, J. W., and R. E. Voorrips, 2001 JoinMap 3.0: software
for the calculation of genetic linkage maps. Plant Research Inter-national, Wageningen, The Netherlands.
Vos, P., R. Hogers, M. Bleeker, M. Reijans, T.van deLeeet al.,
1995 AFLP: a new technique for DNA fingerprinting. Nucleic Acids Res.23:4407–4414.
Wang, Z., J. L. Weber, G. Zhongand S. D. Tanksley, 1994 Survey of
plant short tandem DNA repeats. Theor. Appl. Genet.88:1–6. Weber, J. L., and P. E. May, 1989 Abundant class of human DNA
polymorphisms which can be typed using the polymerase chain reaction. Am. J. Hum. Genet.44:388–396.
Wikstro¨ m, N., V. Savolainenand M. W. Chase, 2001 Evolution of
the angiosperm: calibrating the family tree. Proc. Biol. Sci.268: 2211–2220.
Xu, Y., L. Zhu, J. Xiao, N. Huang and S. R. McCouch,
1997 Chromosomal regions associated with segregation distor-tion of molecular markers in F2, backcross, doubled haploid, and
recombinant inbred populations in rice (Oryza sativaL.). Mol. Gen. Genet.253:535–545.
Yu, Q., S. Hou, R. Hobza, F. A. Feltus, X. Wanget al., 2007a
Chro-mosomal location and gene paucity of the male specific region on papaya Y chromosome. Mol. Genet. Genomics278:177–185. Yu, Q., S. Hou, F. A. Feltus, M. R. Jones, J. Murrayet al., 2007b Low
X/Y divergence in four pairs of papaya sex-liked genes. Plant J. (in press).