SOFT X-RAYS FROM THE CYGNUS LOOP
Thesis by
John Charles Stevens
In Partial Fulfillment of the Requirements for the Degree of
Doctor of Philosophy
California Institute of Technology Pasadena, California
1973
ACKNOWLEDGMENT
Several people assisted in the construction of this experiment. Belal Baaquie, Paul Gloger and Craig Sarazin helped with the collimator assembly and with the stretch-ing of the polypropylene windows. Fred Yates was respon-sible for the electronics involved in this experiment except for the detector electronics which were designed by Bill Blodgett. Steve Speer was responsible for the
detector gas regulation and supply system. He also located the fiducial lights in the aspect camera and later devel-oped the flight film. This experiment was a modification of the payload used in a previous experiment. Dr. Guenter Riegler in collaboration with Dr. Gordon Garmire was
responsible for that prior experiment.
The calibration of the collimators used in this
experiment required many man-hours, some of which occurred when more rational folk are long asleep. Bill Moore
and Craig Sarazin deserve my thanks for support during that hectic period.
iii
The Attitude Control System which oriented the
rocket payload during the actual experiment was programmed by Ball Brothers Research Corp. in conjunction with the Sounding Rocket Division of Goddard Space Flight Center. The rocket vehicle was provided, prepared and launched by the Navy personnel of the White Sands Missle Range.
My thanks also go to my advisor, Dr. Gordon Garmire, for allowing me the sole responsibility for this
experiment. With a few valuable exceptions, he allowed me to make the decisions, the mistakes and the corrections which made this experiment a unique learning experience. He was also a wellspring of suggestions and critical
ideas during the spectral analysis of the Cygnus Loop data.
ABSTRACT
A detailed soft x-ray survey of the Cygnus Loop, obtained from a rocket-borne experiment, provides evidence that the x-ray emission from this supernova remnant is produced by the interaction of a shock wave
0 and the interstellar medium. A spatial map, having
0.5
0
by
0.5
resolution, of the structure of the Cygnus Loop in 0.2 to1.5
kev x-rays is presented. The map shows regions of x-ray emission which correlate well with features at radio and optical wavelengths. It alsoshows regions for which the antithesis holds. A detailed spectral examination of the total emission from the Loop by a proportional counter equipped with a two-element filter system, shows evidence for line emission between 530 and 690 ev. The overall spectrum is found to be well represented by a thermal bremsstrahlung spectrum with line emission. The intensity of x-ray emission between 0.2 and
1.5
kev from the Cygnus Loop is found to be 1.2 ±-8 2
0.3 x 10 ergs/cm -sec at the earth. Assuming a distance of 770 pc to the Loop and a columnar density of
inter-21 2
stellar hydrogen of
.48
+ .02 x 10 atoms/cm the total energy radiated in 0.2 to1.5
kev x-rays by the Loop is36
v
TABLE OF CONTENTS
I. INTRODUCTION A. Overview
B. Optical Observational Data
c.
Radio Observational DataD. X-ray Observations E. The Current Experiment
II. DESCRIPTION OF EXPERIMENT A. Detectors
B. Flight Parameters
c.
FiltersD. Windows E. Collimators
F. Aspect Determination
III.THE SPATIAL STRUCTURE OF THE CYGNUS LOOP A. Structure Obtained
B. · Structure Discussed
IV. X-RAY LINE AND CONTINUUM RADIATION FROM THE CYGNUS LOOP
A. Overview
vii
C. Unfiltered Spectral Measurements of the 59
Cygnus Loop
D. Temporal Variations in the X-ray Emission 66
From the Cygnus Loop
V. SUMMARY OF RESULTS AND COMPARISON WITH
PREVIOUS OBSERVATIONS
A. Summary of experimental results
70
B. Comparison with Previous Observations71
VI. INTERPRETATION OF RESULTS IN TERMS OF A
SHOCK-WAVE MODEL OF THE CYGNUS LOOP
A. Overview 76
B. Evidence Supporting Inhomogeneous and 78
Anisotropic Nature of the Cygnus Loop
C. Inhomogeneous Isotropic Model of the
82
Cygnus Loop
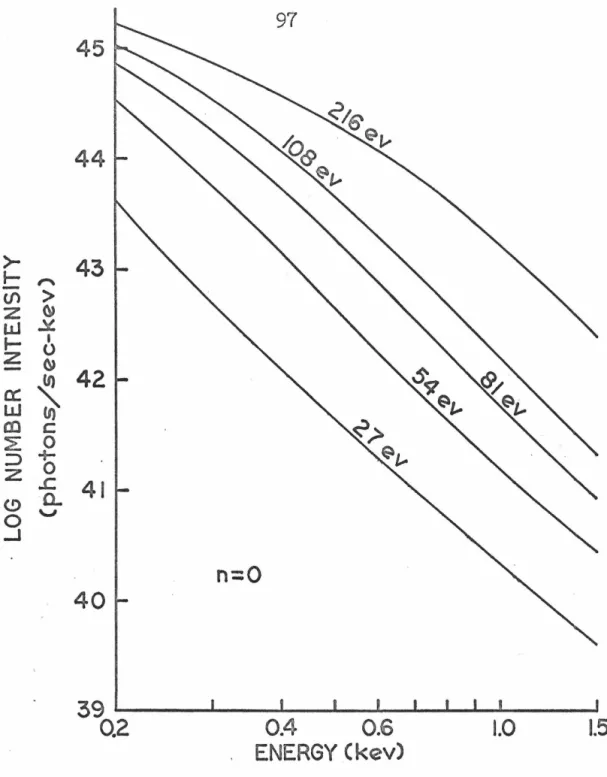
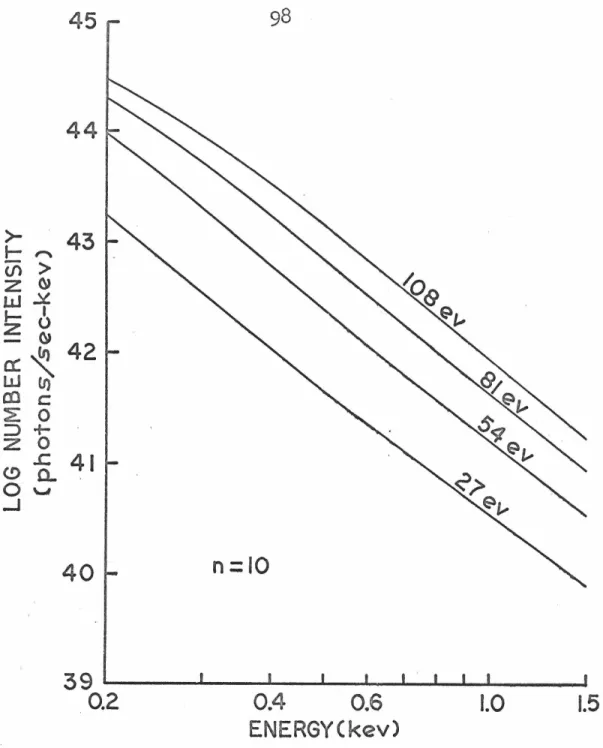
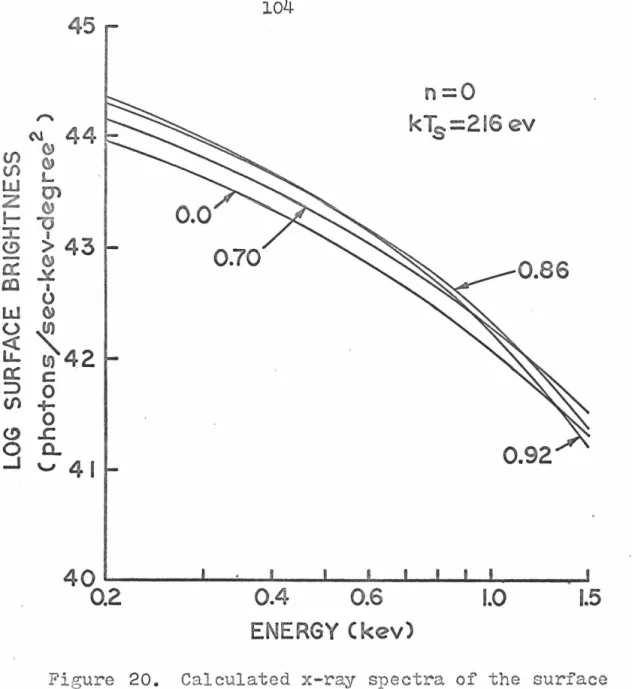
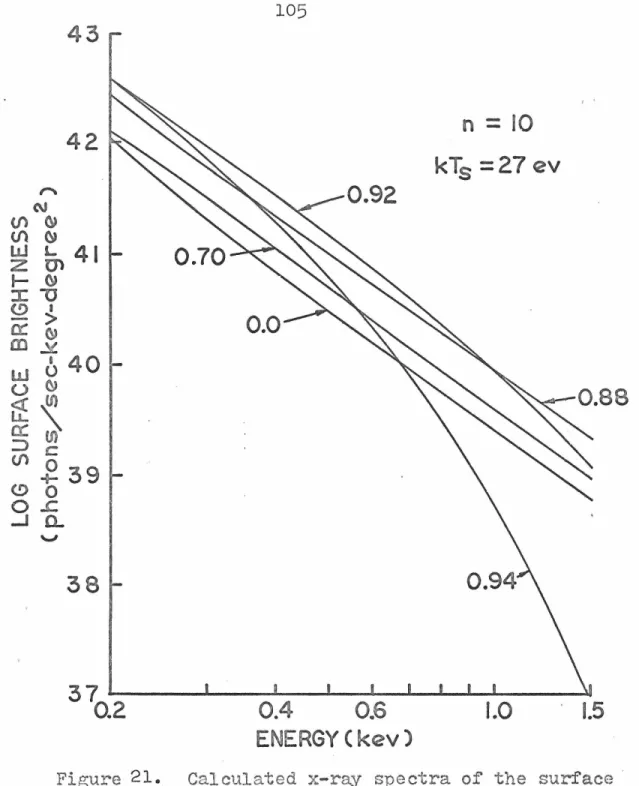
D. Spectrum Calculation 93
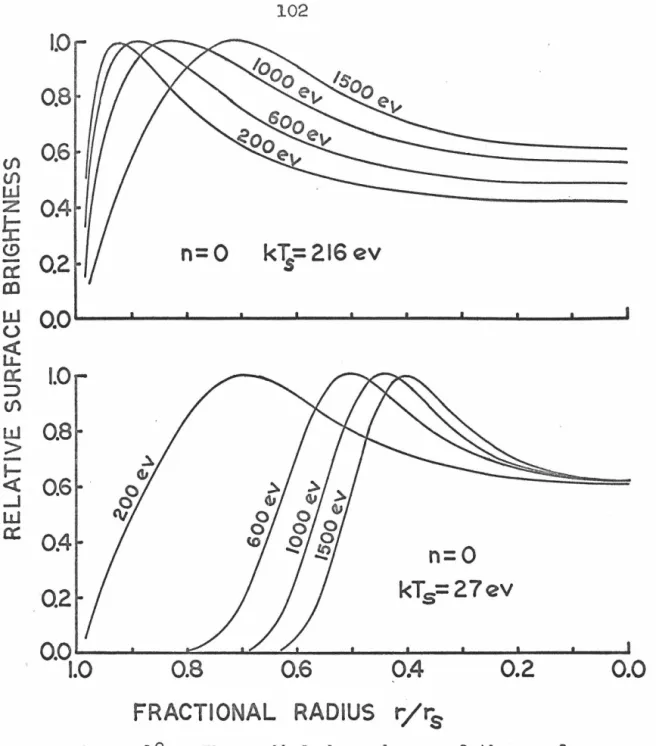
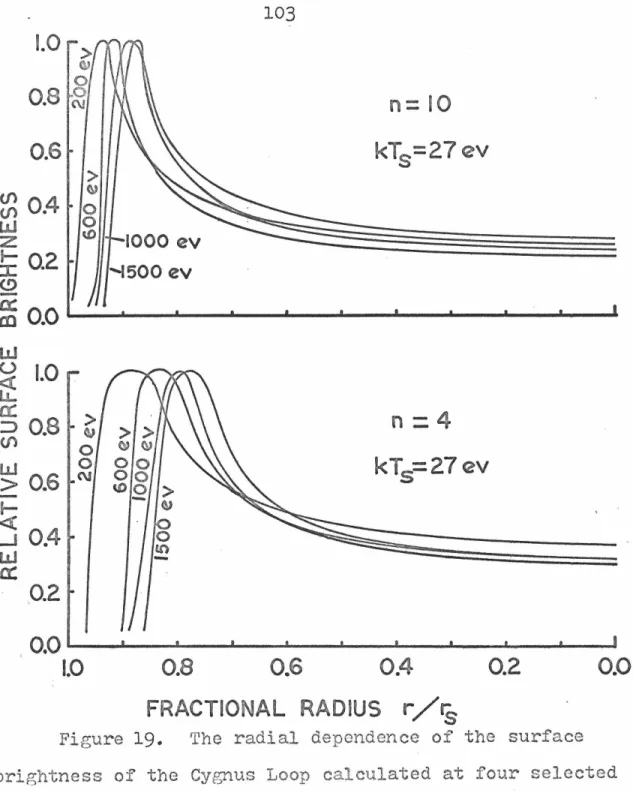
E. Surface Brightness Calculations 100
F. Density Variations Implied by Observed 109
Intensity Variations
G. Mass of X-ray Emitting Region 114
H. Line Emission Calculation 117
I. Age of the Cygnus Loop 119
K. Concluding Remarks
APPENDICES
A. Calibration of Detector Windows
B. Collimators Design, Assembly and
Calibration
1. Overview
2. Stacked-grid Collimators Design
121
127
138
138
138
3.
Collimators' Calibration148
c.
Polypropylene Plastic Windows; Stretching159
and Mounting Techniques
1. Overview
159
2. Stretching Techniques
159
3.
Mounting Techniques165
D. Procedure for Inverting Strip Scans of
169
Cygnus Loop to Obtain Two-Dimensional Map
of X-Ray Emission
E. Reductions of the Filtered Measurements
181
of the Cygnus Loop Spectrum
F. Reductions of the Unfiltered Measure-
195
ments of the Cygnus Loop Spectrum
1
I. INTRODUC'.I'ION
A. Overview
At optical frequencies the Cygnus Loop is a group
of sharp filaments and diffuse wisps having the rough
appearance of a broken shell (figure 1). The approximate
center of the Loop is cr(l950) = 20h 49~5. 6(1950) = 30° 48.5'(Minkowski, 1958). The optical emission has
been extensively studied by a number of authors. It
consists entirely of line emission (Minkowski,1968).
The radio emission has also been investigated, including
a survey of the polarization of the Loop at 11 cm by
Kundu (1969). · The radio spectra are found to be non-. thermal, Recently the Cygnus Loop was found to be an
intense emitter of soft x-rays (Grader et al, 1970).
Further studies by Gorenstein et al (1971) indicated
the possible existence of x-ray line emission from the
Loop. On October 23, 1971 a rocket~borne experiment
examined the soft x-rays from the Loop in some detail.
This paper describes that experiment and its results.
B. Optical Observational Data
The sharp filamentary structure and the apparent
lack of an exciting star (Oort, 1946) suggests that the
Cygnus Loop is not an emission nebula shining through
Figure 1. The Cygnus Loop in Ha emission, courtesy
of the Hale Observatories. The bright filaments to the
right in the picture are NGC
6960,
'
Those to the left,suggest that the Cygnus Loop was emission resulting from
collisions between the ejecta of a supernova and the
interstellar material. Studies of the visual line
emission from the Loop (Minkowski,
1958
& Parker,1964)
indicate that this emission is consistent with a collisional
excitation mechanism. In addition, radial velocity
measurements (Minkowski,
1958
& Doroshenko,1971)
have shown that the velocities of both the sharp filaments andof the diffuse wisps are consistent with those expected
of a radially expanding shell of matter.
C. Radio Observational Data
A great number of radio observations have been made
of the Cygnus Loop. In general these observations show
that the radio emission originates in the bright filaments
to the northeast (NGC
6992-5)
and in a broad maxima inthe western half of the Loop including NGC
6960.
Kundu's(1969)
measurements are typical in their contours of all the radio measurements. Kundu also has mapped thepolarization observed at 11 cm wavelength. He sees
(figure 2) a region in the southern part of the Loop
which is strongly polarized (on the order of
15
to20%).
The rest of the Cygnus Loop although fully as bright as
this southern portion displays no polarization down to
5
Figure 2. Contour map and polarization observations.
of the Cygnus Loop at 11 cm wavelength (Kundu,
1969)
superimposed on the Hcr picture. The contour unit is
0.108° K in brightness temperature. Bars in the southern
portion of the Loop denote polarizations, the length of
the bar giving the amount of polarization and the
orientation giving the electric vector. The length of
bar corresponding to 20% polarization is shown in the
.
.•
+3?~00'- .
·.
O·
i..'J .
~
+30°00'-~
+29°00'-. .
. I
20~56mJ . ·. I . °' I . . ·J
.
~t~~. . .,. r20%
· f
J.
..
.
7
der Laan (1962) proposed that the radio emission from the
Loop was synchrotron emission from relativistic charged
particles interacting with the interstellar magnetic
field compressed by the shock wave from the supernova
explosion. Kundu's measurements confirm this for that
portion of the.Loop showing polarization. In addition
calculations based on the observed Ha emission have
indicated that only a few percent of the radio emission
can be of thermal origin (Parker,
1964).
Hence the bulk of the radio emission is probably synchrotronemission. In this case the absence of detectable
polar-ization indicates the existence of
a
jumbled magnetic field,D. X-ray Observations
The presence of synchrotron emission at radio
wavelengths and the apparently collisionally excited
line emission at visual wavelengths leads to two mechanisms
which could produce x-ray emission. The synchrotron
emission responsible for the radio emission could, if
sufficiently energetic electrons were available, lead to
x-rays also. Alternately the collisional excitation
mechanism producing the visual line emission could also
produce x-rays. This latter production process requires
inter-stellar medium creates the high temperature plasma necessary to give the optical emission, also produces the much higher temperature plasmas necessary to produce x-rays. That this process is possible will be explicitly shown below in section V.
The first x-ray measurements of the Cygnus Loop were done at moderate energies (E~ 2 kev) and indicated no detectable emission. The most recent measurements by Bleach et al (1972) have confirmed that the Cygnus Loop radiates less than 10-2 kev/cm2-sec at energies above 2 kev. In 1968 Grader and collaborators (Grader et al, 1970) found that the Cygnus Loop is an intense emitter of soft x-rays (0.2 ~ E ~
1.5
kev). Their data was not of sufficient quality to determine whether the spectrum of these x-rays was of thermal or of synchrotron origin. In 1970 Gorenstein and co-workers examined the Cygnus Loop in the soft x-ray range of energies using a one-dimensional focusing telescope system (Gorenstein et al, 1971).They succeeded in obtaining a one-dimensional •strip'
map of the Cygnus Loop. This showed that, in the direction scanned, the x-ray and visual emitting regions were
coincident within the accuracy of the data. They also obtained a spectrum of the entire Loop which was best
9
the x-rays they found to be 4.2 million degrees. These
spectral results are compared with those obtained by this
experiment below in section V.
E. The Current Experiment
The line emission at approximately
650
ev could be from a plasma containing collisionally-excitedmultiply-ionized oxygen atoms. These radiate strongly at
tempera-tures between 2 and 4 million degrees (Shklovskii, 1968 & Tucker et al, 1971 ) and give rise to several lines
clustered around
575
and650
ev. ·The presence or absence of these lines furnishes a test of the thermal nature ofthe emission. Lack of these lines would not necessarily
imply that the emission is of non-thermal oriein, but
their presence would effectively rule out non-thermal
origins. The question of whether the line emission
reported by Gorenstein et al is in fact present in the
Cygnus Loop spectra therefore becomes crucial in deciding
between a thermal or a synchrotron origin of these x-rays.
These lines fall in a range of the x-ray spectra
where the standard detectors (thin-windowed proportional
counters) have poor resolution, typically > JOO ev at
600
ev photon energy. Hence it is difficult to detect the presence or absence of line emission at approximatelyovercome this difficulty a filter system employing the
absorption discontinuities at the K edges of.Oxygen
(532
ev) and Fluorine(692
ev) was employed. This system is described in more detail in section II. This filtersystem was used in the rocket-borne experiment and
provided evidence for the presence of oxygen
line emission ·at a level somewhat below that reported
by Gorenstein et al. This line emission supports the
shock-wave theory of .the Cygnus Loop. The experiment is
described in greater detail in section II• The obs.erved
spectral results are reported in section IV and are
discussed ~ith regard to the proposed model in section
VI.
To provide more information about the physics
involved in the Cygnus Loop a spatial mapping of the soft
x-rays from the Cygnus Loop with 0~5 x 0?5 resolution
was performed in·the same rocket-borne experiment that
examined the spectra of the Loop's x-rays. The mapping
showed that the x-rays come from a region which is
largely coincident wi,th the radio and optical regions
(figure
3).
There are detailed correlations between the x-ray map and similar visual and radio maps and broadregions of dissimilitude. These results are discussed
in sections III and VI. Section III gives the spatial structure obtained in this experiment and section VI
11
Figure
3.
Intensity map of x-rays from the Cygnus Loop. Map is of observed x-rays between 0.2 and 1.5 kev.0 0
The number of lines in a
0.5
x0.5
resolution element gives the intensity of x-rays received from that element.Vertical lines are positive intensities, horizontal lines
are negative intensities.· The observational background
has been subtracted from the map. Each line represents
-10 2
10 ergs/cm /sec/resolution element observed at the
earth. The error in the measurements is approximately
-10 2
2 x 10 ergs/cm /sec/resolution element, or ldN+2 lines,
The intensity per line~ value was obtained by normalizing
to the results of the spectral examination described in
32°-0
31-0
LO (])c.o
..
30°-r
29°-, (~
~..
..- > II I
(.}
)
'
~~·
I
~~.
\ \ . .• > . ,, \
~ ('
-. I ~
;t, ~· " Ff_,' -!,..,.,...- ,.-'. <)-'
t
1;~['11'
j
j
~
}
··-/.:
I I , ~.:K;. .. /
_: , , l y
.~
• \·~
f't
I
:-» ~· . ~·'1 .:l',· ....
-.... . ·1'
\ :."'
,,,,.~' .
.. '\
I
I
.
20h52m
20h48m
OC-(1950)
Figure 3
13
II. DESCRIPTION OF EXPERIMENT A. Detectors
The experiment consisted of four detectors each of whose field of view was defined by a mechanical collimator. Each detector was a multi-anode thin-windowed gas-filled proportional counter. The salient differences among
these detectors are given in Table 1. All four detectors
Detector
A
B
c
D
TABLE 1
DETECTOR CHARACTERISTICS Window
Thickness 270 (µ.gm/cm2) 270 140 271 Window Material Kimf ol Kimf ol Polypropylene Polypropylene
Effective Field of Area (cm2) View(FWHM)*
193 o.4x9.8 213 o,4 x 9.8 395 12,0xl2,J 425 9. 3 " 10. 0 *FWHM: Full Width at Half Maximum of collimator response .
were filled with methane gas at 150 torr. As noted in Table 1 detectors A and B had fields of view narrow in one direction. The 'fan beams' of these two detectors were used to obtain the spatial mapping of the Cygnus Loop. Detectors C and D had wider fields of view and viewed the entire Loop rather than a portion of it.
15
Detector D was .equipped with two mobile filters and performed the filtered measurements of the Loop.
Each detector had 12 anode wires separated by wire grids. These grids were grounded and arranged in such a fashion as to form planes which divided the detector's volume into 12 proportional counters each
having 1/12 of the original volume. These 12 anode wires were wired together in four groups as shown in figure
4
for data processing efficiency, Each group of anode wires was operated in anticoincidence with the other three groups of wires. This aids in rejection of events arising through the interaction of charged particlesand y-rays with the detector. X-rays predominantly deposit their energy in one anode's volume while minimum ionizing particles will deposit energy in all the anode volumes through which they pass.
Other than the anticoincidence the groups of anode wires functioned essentially as independent detectors. Hence each detector volume was composed of four separate proportional counters. Regarding each of these as
independent detectors raises the number of detectors from
4
to16.
However the back group of anode wires has the highest noise level and the smallest signal level so that the data from this level was not employed in theFigure
4.
Schematic cross sectional view of oneof the detectors used in this experiment. The figure
shows how the anode wires are wired together into four
groups for ease of data processing, The front group of
wires will be referred to as the "window" group in the
~--
COLLIMATOR
WINDOW
,;.r---.---.---~----~~---GASSEAL
•
~
• : 0~
oI
FRONTI
·
I
I
---,----i----,---1
0I
'
I
....,
I
SIDE
I
I
I
MIDDLE
1
1
1
---,----,----,----0
I
e : \ : /I
BACK
---WIRE GRID
GROUND
PLANES
Figure
4.
ANODE WIRES
t-.J
remaining groups were combined in the data reduction for detectors A and B since the separation served no purpose in obtaining the spatial structure. Only for detectors C and D was explicit use made of the remaining three groups of anode wires. For these detectors spectra were obtained for each group separately. For identification purposes each group was given ~name according to its position in the detector (figure
4).
The nomenclature adopted is to refer to, for example, the window group of anode wires of detector C as 'detector C window•.The linearity of the detectors' energy response was calibrated in the laboratory prior to flight. They were measured at six energies between 0.28 and 2.8 kev, The maximum deviation from a linear response at any of these six energies was less than 2%,
Calibration sources which were visible when the pay-load door was closed provided an in-flight check of each
210
19
B. Flight Parameters
The experiment was launched on a Nike-Aerobee rocket from White Sands New Mexico on October 23,
1971
at 3:45:00.5 UT. The rocket performed as anticipated and gave approximately 390 seconds of useful flight.The Cygnus Loop was observed for 130 sec during the middle of the flight from 140 sec to 270 sec. There were no
major difficulties with the functioning of the detectors. The only difficulties were minor ones; the detectors
showed a lower gain than expected so that a larger fraction of the low energy data fell below the discriminator
cutoff of the amplifiers, and the oxygen gas cell's
bleed rate was slower than expected. The latter difficulty is expounded below in the discussion of the filters.
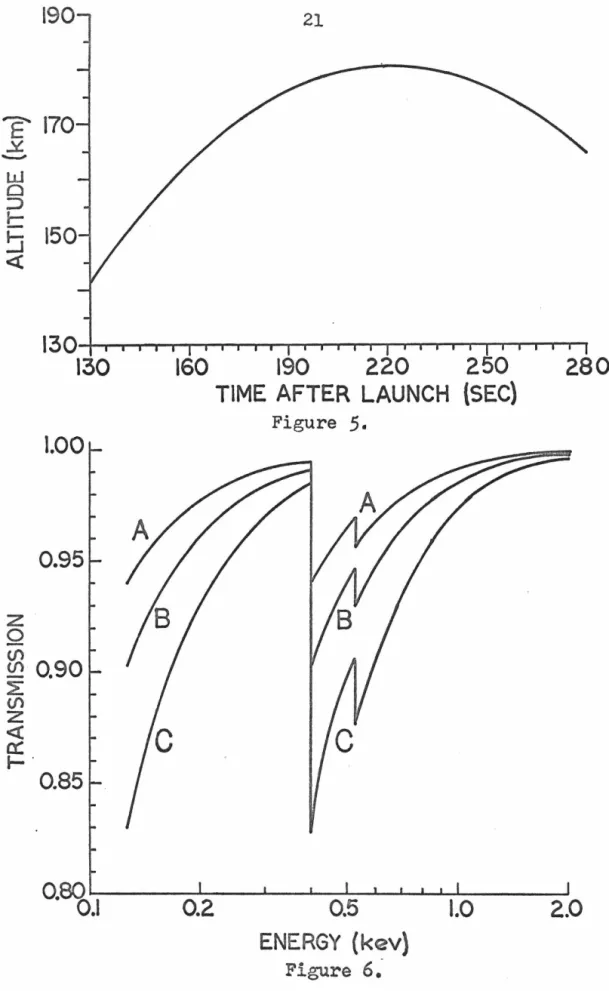
The altitude during the Cygnus Loop observation varied from
149
km at 140 sec to 181 km at 222 sec andback down to 168 km at
275
sec. The altitude as a function of time from launch for the time period of the CygnusFigure
5,
The altitude of the experiment as a function of time after launch for the time period of theCygnus Loop measurement,
Figure 6! _The atmospheric transmission as a
function of ·energy for three altitudes; curve A - 160 km,
190
E'
170
~ __,
w
0 :::>r-!J
150
<t 21 130-'--"--~--.-T---r-l__.,~~~r-r--r-r-r-r-r-r-r-"T130
l.00
0.95
z
0 (/)(/)
0.90
~ (/)
z
<(a:
I- .0.85
0·8i.1
160
190
220
250
0.2
TIME AFTER LAUNCH (SEC)
Figure
5.
0.5
ENERGY {kev)
Figure
6;
1.0
280
the source along the line of sight. Unfortunately the
atmosphere at high altitudes varies on both a diurnal and
on an annual basis in a strongly unpredictable manner.
This makes it difficult to ascertain with any certainty
how much residual atmosphere is between the detector
and the source. The integrated line-of-sight density
also depends on the zenith angle of the observation.
For the Cygnus Loop measurement the zenith angle was
approximately 22°. The transmission as a function of
energy of the residual atmosphere at this zenith angle
for various altitudes using the U.S. Standard Atmosphere
summer model 1 is given in figure
6.
Note that the attenuation is greater than5%
at the nitrogen edge at0.4 kev for altitudes less than 160 km. This effect is
observable in the spectra obtained by detector
c.
Tolimit the inaccuracies caused by this uncertain amount
of atmospheric attenuation, only the data obtained by
detector C between 197 and 271 seconds was used for
spectral analysis. Detector D performed filtered
measurements of the Loop from
145
to 215 sec. Because of the low statistical accuracy of these filteredmeasure-.ments the inclusion of atmospheric attenuation is not
23
c.
FiltersAs indicated above, detector D was equipped with
a two-element filter system. The filters used were
oxygen (0 2) gas and a t~in teflon (CF2) sheet. Both
filters were normally removed from the detector's field
of view and were independently inserted during the
observation of the Cygnus Loop.
The teflon filter consisted of commercially
available 675 µgm/cm2 teflon sheet mounted on a
frame
which was hinged so as to lay flat in front of the
detector during the measurement (figure
7),
This teflon flap was motor driven and followed a sequence of positionsduring the flight. At launch the flap was in its 'closed'
position in front of the detector, The flap was opened
at approximately 93 sec and remained open until it was
closed for the Cygnus Loop measurement at
173
sec.It
remained closed until
213
sec, at which time it was opened. It was open until362
sec when it was closed for reentry. The flap required approximately1.5
secto open or close. Because of the slow bleeding rate of
the oxygen gas cell (see below) and also because of the
programmed scanning pattern of the rocket, the maximum
signal during the teflon filter measurement was seen
Figure 7. Photographs of the lower end of the
roclret payload showing the teflon filter flap opened
(figure 7a) and closed (figure 7b), The gas cell is also
visible, being just behind the filter flap in i-ts closed
position. The wire with black and ~hite beads on it is
not part of the experiment but was included in the pictures
to indicate angles more accurately, The camera used to
take the star pictures which gave the rocket's aspect is
The surface density of the teflon sheet was
measured in two ways and was found to be 673 ± 34 µgm/cm2• One way consisted of simply weighting a carefully measured area. The other way was to measure the x-ray transmission of samples of the filter sheet after flight. The
transmission was measured at seven different energies between 0.28 and 1.49 kev. The technique was the same as that used to measure the surface density of the plastic used as window material and is described more fully in Appendix A. The two methods of measuring the s~rface·
density gave results consistent within the quoted accuracy, The oxygen filter consisted of a gas cell located in front of detector D into which oxygen gas (0 2) could be admitted by means of a solenoid valve. This gas cell was normally vented to the ambient pressure. The pressure in the cell was moni tared by a t·ransducer and was recorded during the experiment. The pressure in the gas cell observed during the experiment is shown in
figure
8.
The gas crell was filled at143
sec and began to empty at173
sec. It emptied somewhat slower than expected. Examination of the pressure data shows step·variations in the rate of escape of the oxygen. The
27
Figure 8. Pressure of oxygen in the gas cell as a
function of time. The gas cell was filled at approximately
143 sec and began to empty at approximately 173 sec. A
change in the rate of empty occurs at ~178 sec and another
~ <.9 I ~
u
-
w
er::
~ (/) (/)w
0::: CL II
I
2.0
0.5
0.2
'
'
'
'
'
\10.0
5.0
2.0
' , ID
'
'
'
'
'
'
'
'
'
'
'
'
'
'
0.1----~---..i---"---...__-200
210
220
.
230
240
250
TIME AFTER LAUNCH (SEC)
29
in the bleed rate imply that the bleed orifice was too small and varying in size during the monitored time interval. Because of the slow bleed rate there was a substantial amount of oxygen in the cell during the teflon filtered measurement from 175 to 215 sec, and
during the unfiltered measurement of the Loop from 215 to 270 sec,
The surface density of the oxygen filter during 2
the time period
143
to173
sec was387
µgm/cm , The density of< oxygen remaining in the gas cell during the period of maximum signal using the teflon filter (202 to 212 sec) ranged from74
to45
µgm/cm2, The averagesurface density (taking into account the programmed motion of the rocket during this time period) was
57.4
µ,gm/cm 2<, This amount of oxygen was included in the< analy,sis of the teflon filtered measurements of the Loop. In addition the oxygen remaining in the gas cell was non-negligible until 250 sec so the data from the nominally unfiltered detector ·D before 250 sec was not included in the spectral analysis.
The <oxygen used was research grade
o
tested for leakage over a J month period and did not leak
to within the 1 mm Hg pressure sensitivity of the test.
The pressure during the leakage test was lJO cm, the
same as the pressure used in-fliBht.
The pressure transducer used to monitor the gas
cell pressure was calibrated after the flight. The
pressure was found to be determined to within ±0.l cm
above 1.0 cm Hg pressure, and with decreasing accuracy
below this pressure. The region of relatively high
accuracy includes both the oxygen and teflon filtered
measurements.
D. Windows
The oxygen gas cell required two thin plastic
windows to contain the oxygen. The innermost of these
two windows also served as the window of the gas-filled
proportional counter D. Both windows remained in front
of the detector at all times during the experiment.
This is why the window on detector D was approximately
twice as thick as that on detector
c.
The necessity of having two windows and the
desirability of having a large transmission between
0.530
and 0.690 kev indicated that the windows should bemade of a plastic containing a minimum of oxygen and
31
supporting the required pressures. Polypropylene plastic was used because it contains no oxygen and no nitrogen and can be Sfaretched to micron thiclrn.esses.
Some difficulty was encountered in obtaining large useable areas of polypropylene in sufficiently thin
sheets. These sheets were finally obtained by cold stretching O. 00.25 cm th°lck plastic mtil it was approxi-mately 1 micron thick. It w~s possible to obtain sheets which were approximately
1.4
microns thick in circles of approximately 40 cm diameter. These sheets were uniform to about· ±10% in the thickness, The details of thestretching procedure and of the mounting arrangement used in the experiment are given in Appendix
c.
A total of
~1500
cm2 of~1.4
micron thickpoly~
propylene plastic was used as window material on detectors C and D. This was the largest area of ~1.4 micron thick polypropylene ever utilized in a rocket-borne experiment. Because windows of this type of plastic in this large area had not been previously flight-tested it was decided that the two spatial detectors (A and B) would use Kimfol
The windows used in flight were recovered intact
after the flight except for part of the window covering
the gas cell which tore during reentry because of the
slow leakage rate of the gas cell. The windows were
calibrated by measuring their x-ray transmission properties.
The details of this calibration are given in Appendix A.
E. Collimators
The field of view of the detectors was determined
by mechanical collimators. For all of the detectors
.-these collimators also provided support for the thin
'plastic windows. The collimators used have a rectangular
field of view with a triangular, angular response function
in each major direction. Detector C had only the
window-supporting collimator. Detector D had two window-supporting
collimators to support the two windows comprising the gas
cell volume. These collimators and the window-supporting
collimators on detectors A and B were of slat or egg-crate
construction. They were built of
0.025
cm thick Al(alloy -
7075)
sheet and were calibrated in the laboratorybefore the flight. The calibration procedure is discussed
in Appendix B. The sheets were sanded prior to assembly
and the assembled collimators were sandblasted with
micron size glass shot to form a surface compatible with
33
and sanding produces a rough (to x-rays) surface on the slats and prevents grazing angle reflections which
might increase the full width at half maximum (FWHM) of the collimators' angular response for the low energies of x-rays measured.
In addition to the window-supporting collimators, detectors A and B had additional mechanical collimators of a different design. The window-supporting collimators defined the long direction of the field of view and the additional collimators provided a narrow field of view
(0~4 FWHM) in the other direction. These additional
collimators were used to obtain the spatial mapping of the x-ray emission from the Cygnus Loop. The field of view of each of detectors A and B was a fan beam
o?4
x 9?8 FWHM. The·se fan beams were oriented at 90° withrespect to each other and at
45°
to the roll and yaw motions of the rocket. They formed an 'X' response pattern which was used to scan the Cygnus Loop as shown in figure9.
Figure 9, Scan path of experiment while viewing
Cygnus Loop and counting rate of detectors A and B during
the same period. The open circles give the view direction
at intervals of 1 second. Not all of the positions are
shown at the sharp corners at ~190 sec and ~230 sec. The
'X's marked with A's and B's denote the orientation of
detector A's and detector B's fan beam collimator
respectively. A sketch of the Cygnus Loop is shown for
reference purposes. The counting rate data represent
0 LO
0
120
~ 80
(/) ~ 40
I-35
~
80 .040~
140 180 230 270
TIME(SEC)
33 ° -r---._
0
0
Q)
290-r---t--0-0---+--0
0 0
25°-,---t---l-~~__Jt-t:::-A--l-~~~-+-~~~T25°
J.\2:0.5
o B
2oh 5om 2oh4om 2oh 3om 2oh 2om
a (1950)
F. Aspect Determination
This experiment determined its aspect with respect to the earth-based a, 6 coordinate system by means of star pictures taken with a
16
mm camera. Each exposure lasted .954 sec. The time between frames was.036
sec. The exposures show streaks which are stars blurred by the rocket's motion. Which stars are detectable depends on the rocket's motion, on the magnitude and color of the star, on what camera is used, and on the type of film and the development techniques. The Fl.5 lens on the 16 mm camera used in this experiment gives a field of view of ~a0 x 12°. This allowed positioning to ~:1:5 arc minutes while still permitting a large area of the sky to be photographed. The large area is essential for recording positions accurately during the fast (2?0/sec) scans used in maneuvering the rocket before and after the Cygnus Loop scans. Table 2 gives the limiting magnitudes of the stars which are visible at various scan rates using the camera described.37
TABLE 2
STELLAR DETECTION LIMITS VS ROCKET ROTATION RATE Rocket Rotation
Rate (0/sec)
2.0
o.4
O.OlMagnitude Easily Detected
2.0
4.o
5.5
of Stars
Limit of Detection
3.0
5.0
6.5
how w~ll the calibration has been made and on how many stars are visible in the camera exposure of interest,
~ecause the star tracks are streaka. rather than points, it is necessa~ to estimate the same relative position along the streak for each streak. For each exposure (representing ,954 sec) with sufficient star tracks a position and an angle can be obt·ained, The position is that of the normal to the rocket axis as determined by
the main framework of the experiment. The angle
represents the amount of tilt of the rocket axis relative to some fixed direction in space projected onto the sky in the direction of.the rocket normal. The position can be determined by a single star track. The position and the angle can be determined if there are at least two star tracks on the frame. To a limited extent it is possible to extrapolate between frames containing
system (ACS) is doing during the same period. The ACS
is a gyroscopically stabilized platform which controls
the orientation of the rocket payload by means of a
system of small gas jets. The ACS is monitored during
the flight and gives information about the firing of the
gas jets and about the relative angular displacement of
the rocket payload and the stabilized platform. If the
ACS indicates that no gas jets have been fired then it
is possible to obtain the payload motion by interpolation
between well determined positions. At all times while
the Cygnus Loop was being viewed at least
3
stars were visible in each camera exposure. This enabled theposition to be obtained to an accuracy of
±5
arc minutes, This figure includes the inaccuracies of the calibrationprocedure. ·
The ACS was supplied by the rocket personnel. For
this experiment a STRAP-III system was used and it was
programmed by Ball Brothers Research Corporation in
collaboration with the Sounding Rocket Division of
Goddard Space Flight Center. The scanning program is
determined by the experimenter according to the celestial
targets he wishes to examine. There are a number of
external constraints which restrict '.the choice of scan
program •. There are only a limited number of segments in
39
the three principle axis at a constant rate for a
specified length of time. The rotation rates are limited to the range 5?0/sec to 0~2/sec. Only
5
independent rates are allowed; for this, rotations in opposite directions count as separate rates. In addition, there is of course only a limited time available for observations during any single rocket flight and, of considerable importance, the ACS has only a ±3 degree pointing accuracy in controlling the positioning of the rocket. For the spatial mapping ·of the Cygnus Loop it was found that deconvolution ofthe data requires at least 3 scans across the source in different directions and in general the more scans in different directions the less the inaccuracy involved in inverting the observations to arrive at the original source function. This is discussed at greater length in Appendix D. The combination of all these constraints coupled with a desire to spend as much time on the source as possible lead to the scan path shown in figure
9.
III. THE SPATIAL STRUCTURE OF THE CYGNUS LOOP IN X-RAYS
A.
Structure ObtainedThe x-ray structure of the Cygnus Loop is presented in the form of an intensity map in figure
J.
Thisstructure was derived from the strip scans of the Loop performed by the fan beams of detectors A and B.
Figure
9
presents the data from which the intensity map was obtained. The data shown in figure9
is thecounting rate obtained from detectors A and B in the approximate energy range 0.2 to 1.50 kev. The upper energy cutoff was chosen so as to maximize the signal to noise ratio. The spectrum of x-rays from the Loop falls rapidly above 1.0 kev (see section IV). Hence the 1.5 kev cutoff contains at least
95%
of the x-rays from the Loop. The lower energy cutoff was dictated by the threshold level of the electronics for signalacceptance. This discriminator level was not the same for both detector A and detector B. Detector A's
discriminator level was ~250 ev and detector B's ~150 ev. This discrepancy in the acceptance threshold and a
41
The Loop was scanned
4
times by each detector (A and B). Examination of figure9
reveals counting rates in excess of the background rate from 143 to 147,179
to192, 209
to219
and256
to266
seconds fordetector A and from
160
to170, 205
to214, 240
to249,
and257
to266
seconds for detector B. These .are the times when each detector's field of view included some portion of the Cygnus Loop. The single-second wide peak in detector A's counting rate at197
seconds isdue to Cygnus X-1.
The entire time span shown in figure 9, from 140 to 270 sec, was inverted to obtain a map of that region of the sky in 0.2 to
1.5
kev x-rays. The inversion routine was an iterative process developed for this experiment. It is described in more detail in Appendix D. The routine treated an area of sky approximately 120 times the area of the Loop and was able to obtain a0?5
x0?5
mapping over ~60% of this area (including the Loop itself). The Loop was approximately centered in this area. The Loop and Cygnus X-1 were the only two sources observed in this area, This result cameobtained by this process is shown in figure J, Table 3 gives the percentage of the total x-ray emission seen from each resolution element of the Loop. The relation
·between figure
3
and TableJ
is that a line in figure3
represents ~o.8% of the total x-ray emission from the Cygnus Loop.
The intensity map given in figure 3 represents some 1800 counts total received from the Cygnus Loop by both detectors A and B, The accuracy given in figure 3 is the noise level of the non-source regions of the obtained sky map. The non-source regions are those
regions of the map obtained by excluding the Cygnus Loop and the response due to Cygnus X-1. This accuracy there-fore represents both the inaccuracies resulting from number statistics and the inaccuracies involved in the inverting process.
An attempt was made to ascertain whether spectral differences existed between various regions of the Cygnus Loop by examining th~ spectrum of each
0?5
x 0?5 resolutionelement. However the low number of observed counts precluded the possibility of more than a two energy bin
TABLE
3
fERCENTAGE OF CYGNUS LOOP X-RAY EMISSION
L
RESOLUTION ELEMENT{FRACTION OF RESOLUTION ELEMENT'S EMISSION> 0.56 kev)
( a.-a.o) 1?5
l?o
ot?s
o?o
-o?s
-1?0(6-60)
-
1?5
o.o
5.2
1.4
12.1.5.
8o.o
(.79
± .22) (. 44±. 08)(.65
± .14)
-+=:-l~O
3.7
8.6 2.9 4.63.7
1.8 w(. 30 ± • 21) (. 48 ± .10) (. 65 ± • 30) (. 76 ± • 20) (. 42 ± • 29)
0?5
. 4.J 1.5843
0 .. 3 -0 • .3 3.0( • .58 ± • 23) ( 11 ?3 ± .11) (. 86 ± • 66)
o~o 0.7 3.4
3.2
-0.1 1.1 3.3(. 42 ± • 39} ( 1. 0 ± 11 28) (. 36 ± • 25)
0
-0.5
o.o
4.35.2
2.04.4
o.o
(. 51 ± • 20) (. 53 ± .19) C..93 ± • 23)
. 0
-1.0
o.o
o.o
o.o
.5.
8o.o
o.o
(. 69 ± .• ·14)
The energy of the split
(0.56
kev) was chosen so as to provide approximately equal counting rates in both energy intervals. The results obtained from these two mappings are also given in Table 3 for those resolution elements having more than2.5%
of the total emission from the Loop. For these elements the fraction of the observedx-rays having energies greater than
0.56
is given.Except for the difference in discriminator levels the two detectors A and B are equally efficient in their detection of x-rays. Figure 10 shows the detection
efficiency of detectors·A and B to x-rays between O.l
and
4.o
kev. In section IV it is found that a significant fraction of the observed x-rays from the Cygnus Loop is in line emission between 530 and690
ev. Figure 10 shows that detectors A and B are relatively insensitive to this radiation. The intensity map given in figure3
is only for x-rays observed according to the detection efficiency shown in figure 10. Extension of this map to other x-rays, such as possible lin~ emission between 530 and690
ev,should be done warily, bearing the spectral variations indicated by Table 3 in mind.
B, Structure Discussed
45
Figure 10. Detector efficiency of detectors A and
B as a function of photon energy. Efficiency is for
5.1 cm thick detector filled with methane gas at 150 torr
with a Kimfol window of 270 µgm/cm 2 surface density.
Absorption coefficients used in calculating this efficiency
>-(.)
z
UJ -(.)-1L..
LL
w
er.
0
I-(.) UJ
...
w
c
1.0
0.1
0.01
0.001
~---_...______ ..._ _ _ _ _ _ _ _
_
0.1
0.4
1.0
ENERGY Ckev)
Figure 10
47
The bright visual emission region NGC
6992-5
(in the northeast portion of the Loop, see figure 1) is also bright in x~rays and in radio emission (figure 2).Similarly, NGC
6960
shows an ~2a enhancement in x-rays. The brightest resolution element in x-rays (in the north-ern region of the Loop} coincides fairly well with arelative maximum seen at long wavelengths in radio emission (Shklovskii,1968), as does the southernmost element of
the Loop in the x-ray map. However other relative radio maxima of comparable intensity show no enhancement in x-rays, ·so th~ correlation is not complete.
Several features of the x-ray mapping are conspicuous ·in thei~ lack of correlating features in either radio
or visual emission, and vice versa. The region below NGC
6992-5
in the southeast, which is a pronounced minimum in the radio maps (figure 2) and which shows very little Hu emission (figure 1) is a strong emitter of x-rays~ In this respect the x-rays seem to define a more complete shell ~han either the visual or the radio emission shows.The western half of the Loop shows a great deal of diffuse and filamentary visual structure. It is also a
Further, the radio and visual emission continues
to the south in the form of a large arc. This is the
region of the Loop which displays large radio polarization
(figure 2). The direction of polarization indicates that
this arc contains material which has expanded along the
local magnetic field and in so doing has formed the arc
seen. The x-ray map does not rule out the possibility of
emission from this arc but such emission must certainly
be small. The only appreciable x-ray emission in this
region of the Loop comes at a position which coincides
well with the position of the relative radio maximum
displaying no polarization.
The single most conspicuous resolution element is
just east of the Loop's center. This element emits 1/12
of the total x-ray flux seen from the Loop and is
uncorrelated with any radio or visual feature. It also
shows a high percentage of 'hard' x-rays (Table J), It
is tempting to hypothesize that the stellar remnant of
the supernova explosion is in this region and is
respon-sible for this local maxima. However this x-ray data
alone is not sufficient to warrant this hypothesis.
This element is also the only region of pronounced x-ray
emission which lies inside the shell·of emission defining
the edge of the Cygnus Loop. As such it is difficult to
49
the shell structure (see section VI).
Turning now to the question of whether spectral variations in the x-ray emission exist across the Cygnus Loop, the values presented in Table 3 turn out to be
2
inconclusive. If theX criterion is used to judge whether the values of Table 3 are consistent with a
constant fraction of x-ray emission greater than
0.56
kev, a value of this constant fraction of
.57
is obtained. 2Using this fraction value the value obtained forX is
16.5
for17
degrees of freedom. This implies that the values of Table 3 are indeed consistent with a constant fraction of x-ray emission greater than0.56
kev. Hence this experiment must be regarded as inconclusive inIV. X-RAY LINE AND CONTINUUM RADIATION
FROM THE ENTIRE CYGNUS LOOP
A. Overview
All four detectors used in this experiment were
capable of yielding spectral information. Detectors A
and B, because of their narrow collimation, did not
provide a uniform sample of the spectrum of the Cygnus
Loop in its entirety. Detectors C and D provide the best
spectral information for the entire Loop. These detectors
had large fields of view so they were able to view the
entire Loop continuously while detectors A and B were
viewing the Loop intermittently with their narrow fields
of view. Detector D was also equipped with two filters
to provide additional spectral information. Detectors C
and D viewed the Loop continuously from 140 to 275 seconds.
Detector D performed filtered measurements during 70
seconds of this time from 145 to 215 seconds. Detector
C was unfiltered throughout the measurement, as was
· detector D from 250 .to 275 seconds.
In section III it was shown that the x-ray surface
brightness of the Cygnus Loop is spatially nonuniform.
Besides the marked edge-brightening, figure 3 also shows
intensity variations around the edge of the Loop. It
51
existence of spectral variations within the Loop.
Experimental evidence of such spectral variations is
not yet available, however the large physical size of
the Cygnus Loop and the theoretical models presented in
section VI support the hypothesis of such spectral
variations. The overall spectrum of the Cygnus Loop is
therefore most probably some form of average over
dissimiliar regions having individually different x-ray
spectra. The physical significance of the overall
spectrum is therefore somewhat nebulous. Certainly
com-parison of the observed spectrum to detailed spectra
cal-culated on the basis of a single temperature plasma
would appear somewhat meaningless. Indeed, comparison
to any spectral form has meaning only in providing a
way, independent of detector parameters, of checking the
observations against the results of future detailed
models. To facilitate .such comparison the observations
should be described in ·terms of the simplest spectral
models which provide consistency. This is the policy
adopted below.
The filter system of detector D was designed to
check for possible line emission between
0.53
and0.69
kev. Shklovskii
(1968)
and Tucker(1971)
havepre-sented theoretical reasons for expecting line emission
point of view, the reported observation of such
radi-ation by Gorenstein et al
(1971)
is in itself sufficientreason to attempt confirmation of the line emission's
existence.
B. Filtered Measurements of Cygnus Loop Spectra
The filters used were oxygen gas and a thin tef lon
sheet. More details concerning these filters are given
in section II. Teflon sheet was used as a filter because
it contains fluorine (CF2 ). The presence of fluorine in the tef lon produces a band-pass filter which transmits
a narrow band of x-rays just below
0.69
kev, the fluorineK-edge. Similarly the oxygen serves as a band-pass filter
transmitting a narrow band of x-rays just below
0.53
kev, the oxygen K-edge.
The oxygen filtered observations of the Cygnus Loop
were from
144.o
to172.9
seconds in the flight. The teflonfiltered observations Df the Loop were from 202.0 to
211.9
seconds. The x-ray fluxes observed during theseperiods of time were obtained by subtracting the
instru-mental background counting rate from the observed counting
rate. The instrumental background rate is the rate which
the detector records when the x-ray flux entering the
detector is negligible. This condition was satisfied
during two portions of the flight, from
82.0
to93.9
53
rocket was deep in the atmosphere and the teflon filter
was in front of the detector. The counting rates
observed during these periods of time are given in
Table
4.
TABLE
4
OBSERVED COUNTING RATES
(0.25
to2.5
kev)FOR DETECTOR D WINDOW
Time Interval Average Counting
Detector (sec} (Counts/sec)
window
82.0
to93.9
plus39.6
±1.5
363.0
to366.9
144.o
to172.9
62.6
±1. 5
202.0
to211.9
54.9
+2.3
middle+
82.0
to93.9
plus8.5
+0.7
side
363.0
to366.9
144.o
to172.9
15.0
+0.7
202.0
to211.9
12.2
± 1.1
Rate
These rates need to be corrected for the
trans-mission of detector D's collimator. The average
colli-mator transmission 9uring the oxygen filtered measurement
was
o.40
and during the teflon filtered measurement0.59 •
Using these values and the information given in Table 4
the fluxes detected during the filtered measurements are
given in Table
5.
TABLE
5
FLUXES (0.25 to 2.5 kev) OBSERVED BY
DETECTOR D DURING FILTERED MEASUREMENTS
Detector Filter Material Flux Detected
Window Oxygen
58.1
:f:5.3
Window Teflon
25.9
±4.7
Middle+ Side Oxygen
16.4
±2.5
Middle+ Side Teflon
6.3
:C 2.2(counts/ sec)
not immediately apparent from the values given in Table
5 whether line emission has or has not been observed. · To
resolve this question it is necessary to assume trial
input spectra and by convolving these spectra with the
detector's efficiency determine the ~nput spectral
para-meters consistent with the measurements. If the teflon
filtered measurement then implies a much higher input
spectral level than does the oxygen filtered measurement
the existence of line emission between
0.53
and0.69
kevwill be demonstrated.
This detailed comparison is car.ried out in Appendix
E. There it is shown that the teflon filtered measurement
implies the existence of an excess emission over that
expected from a simple thermal bremsstrahlung continuum in
the energy range
0.53
to0.69
kev. ·If this excess55
.at 658 ev then an intensity in this line of 1.8±0.7
pho-tons/cm2-sec at the earth is needed to explain the
obser-vations. Similarly an intensity of 7.0+2.8 photons/cm2
-sec in a line at 575 ev is also consistent with the
obser-vations. These line intensities are relatively uncertain
because of their large errors, however the values are
sig-nif icantly different from zero. A value as large as that
obtained should occur less than 1% of the time by chance
alone if the true line intensity was zero. The errors
given are the statistical errors, they do not include the
systemati~ errors. An estimat~ of the systematic errors
can be obtained from the analysis of the unfiltered
detec-tor's measurements given below. The systematic errors,
ex-pressed as fractional errors, are much larger there (N25%
in the intensity measurements) because of the higher
count-ing rates seen in the unfiltered detector. It can be
esti-mated that the lower filtered counting rate results in sys~
tematic errors of less than 5%. This size of systematic
error does not significantly affect the measurements given
above because of the relatively large statistical errors
already present.
It has not been shown by this experiment that this
excess emission must originate from the Cygnus Loop. This
emission could conceiveably be a feature of the spectrum
was less than
1/6
of the Cygnus Loop flux. If this excessemission originates with the diffuse flux than the
rel-ative contribution of this excess emission to that of the
continuum radiation is
6
times as large as it is for theCygnus Loop. This excess emission represents
9%
of thetotal energy flux observed from the Cygnus Loop so it
would have to represent over
50%
of the total energy fluxfrom the diffuse background. The background radiation
from a nearby region of the sky was examined during the
sam~ flight. This examination revealed no evidence for
excess emission between
0.53
and0.69
kev in the spectrumof this background radiation. This of course does not
rule out the possibility that the diffuse background
emission from the region of sky surrounding the Cygnus
Loop is responsible for the excess emission observed,
but it does render this possibility less plausible.
It should be emphasized that the excess emission
given above represents the flux observed at the earth
and not that emitted by the source. To arrive at the
amount of excess emission which the source emits between
0.53
and0.69
kev it is necessary to make an assumptionabout the amount of intervening absorbing material
57
spectra suggest that in the nomenclature introduced in Appendix E, N = 0.47 x 10²¹ atoms/cm2 • Using
H
this value of NH the interstellar transmission at 575 ev is 68% and at 658 ev is 77%. This leads to the following line intensities at the source; I(658)
=
2.J ~ 0.9 or !(575)=
10 ± 4 photons/sec-cm2•Alternate ways of explaining the excess emission
observed were investigated with uniformly negative results. These attempts at alternate explanations are discussed
in the following paragraphs.
This excess emission could be explained if the teflon filter transmission had been underestimated. However, instead of 673 ± 34 µgm/cm2, the measured surface density of the teflon sheet, a surface density of less than 480 µgm/cm2 would be required for consist-ency of the filtered measurements without any excess emission. If the teflon filter were non-uniform, sections would have to display surface densities of much less than 400 µgm/cm2• Both of these possibilites are inconsistent with the measurements made of the
teflon sheet.
is too large to be admissible since no holes were
visible in a careful scrutiny of the teflon sheet after
the flight.
Another explanation would require that the x-ray
emission from the Cygnus Loop display large temporal
changes during the filtered measurements. If the flux
from the Loop were to have increased between the oxygen
filtered measurement and the teflon filtered measurement
by approximately a factor of 2 then this increase would
have caused the observed excess flux in the teflon
filtered measurement. Such an increase is incompatible
with the observations of detector C which viewed the
Loop without filters during this same interval of time.
It is also inconsistent with the later unfiltered
measurements by detector D itself which agree with the
continuum level measured by the oxygen filtered detector.
Another proposed explanation of the excess emi~sion
seen would have the teflon filter flap acting as a
fluorescence source and producing the excess emission
seen by the detector. In its closed position the teflon
flap was exposed to over 2 steradians of the sky with
varying sensitivity {see figure
7b).
Hence in additionto a large amount of x-ray diffuse background emission it
also received emission from the discrete sources in this
59
and the Cygnus Loop. Therefore the amount of radiation
impinging on its surface is potentially non-trivial.
A calculation showed that the teflon sheet absorbed a
total of 1.3 x 10
4
photons/sec above 0.7 kev from all ofthe above-mentioned so4rces. Assuming that the
K-fluorescent yield of fluorine is ~6.6 x 10⁻³ (Gorenstein et al,
1968)
then85
photons/sec with energyo.68
kevare generated in the teflon sheet. Of these ~1.4 photons/
sec escape from the teflon sheet in the appropriate
direction so as to enter the detector. Finally only
7.5%
of these x-rays, or 0.11 photons/sec, aretransmit-ted by the two polypropylene windows prior to the window
and absorbed by the detector gas. This falls far short
of the ~12 photons/sec needed to explain the excess
emission observed.
C. Unfiltered Spectral Measurements of the Cygnus Loop
Detector C provided the best unfiltered
measure-ments of the entire Loop because its window was only
half as thick as the windows of detector D. In addition
detector C viewed the Loop for over 130 seconds while
detector D had only some 60 seconds of unfiltered
observations of the Loop.
The statistical accuracy of the spectral data
the large flux of soft x-rays coming from the Cygnus
Loop. Energies were recorded for over 101,000 detected
events while the experiment was observing the Cygnus
Loop. However not all of the photons for which energies
were available were used to obtain the Cygnus Loop
spectra. As mentioned in the description of the
experi-ment in section I I the atmospheric absorption effects
limited the spectral measurement by detector C to the
time period 197.0 to 270.99 seconds and the presence
of some residual oxygen in the gas