20th International Conference on Structural Mechanics in Reactor Technology (SMiRT 20)
Espoo, Finland, August 9-14, 2009, Division 7., Paper 1664
THE SEISMIC FRAGILITY ASSESSMENT OF THE FEED WATER TANKS
PLANT USING ROBUST PREDICTION CONCEPT OF STRUCTURAL
RESPONSE
P. Varpasuo and J. Kähkönen
Fortum Nuclear Services Ltd, Espoo, Finland
email: [email protected]; [email protected]
Keywords: Robust Fragility Assessment, Structural Response, Uncertainty Quantification.
1
ABSTRACT
The computational task described in this paper is part of the updating effort of the Seismic Probabilistic Risk Assessment for Loviisa Nuclear Power Plant. Robustness in the prediction of structural response is an essential requirement for probabilistic fragility assessment. In order to develop the updated fragility curves for the feed water tanks in the Loviisa plant, which constitute the key element in assessing the core melt frequency of the plant, very detailed structural model incorporating the feed water tanks was developed. The fragility of a key plant component is defined as the conditional probability of its failure given a value of the response parameter, such as displacement, strain, stress or stress resultant. The first step in generating fragility is to develop a clear definition of what constitutes the failure of a component. It may be necessary to consider several modes of failure, and fragility is required for each mode. To assess the structural performance, it is important that robust predictions are made that treat all the uncertainties, from modeling applicable loads to modelling the structural behaviour. For large tanks, a failure of the support system or a plastic collapse of the pressure boundary is considered to be the dominant failure mode. Structures can be considered to fail functionally when the inelastic deformations under seismic loads are estimated to be sufficient to potentially interfere with the operability of equipment attached to the structure or fractured sufficiently for equipment attachments to fail. The event and fault trees should appropriately reflect these failure conditions. The fragility of large components is directly developed from the seismic response analysis results. The component fragility for a particular failure mode is expressed in terms of the ground-acceleration capacity A. The fragility is therefore the probability at which the random variable A is less than or equal to a specified value, a. The ground-acceleration capacity is, in turn, modelled as
Equation 1 A = A εRεU
In Eq. (1) A is the median ground-acceleration capacity,
ε
Ris variable representing the inherent
randomness about A, and
ε
Uis a random variable representing the uncertainty in the median value.
It is assumed that both
ε
Rand
ε
Uare log-normally distributed with logarithmic standard deviations
β
Rand
β
U, respectively. As a result of the fragility evaluation the curves expressed with the aid of
Equation 1 are given for the feed water tanks of Loviisa plant
.2
INTRODUCTION
loads well enough. Later it has turned out that the earthquakes may also be a significant risk factor to the nuclear power plants in the seismically low active areas if the horizontal loads caused by the earthquakes have not been taken into consideration at all in the design of the components or their supports. However, in the Loviisa nuclear power plant no especially seismically sensitive items have been identified. The seismic robustness of the Loviisa nuclear power plant has been estimated in a seismic risk analysis which has been completed in 1992. The central parts of the analysis are: 1) the evaluation of the annual occurrence frequency of the earthquakes of different sizes on the basis of seismological measurement data and on the basis of historical observations; 2) vibration analyses of buildings and determination of peak accelerations on separate floor elevations of the plant and 3) evaluation of the probability of the failure of the components and structures in earthquakes of different sizes. Generally speaking the seismic robustness of structures, systems and components in Loviisa nuclear power plant was estimated as good. The supports of feed water tanks and some direct current systems were estimated to be the most sensitive items. The core melt frequency caused by the earthquakes is relatively small on the basis of the analysis.
3
FINITE ELEMENT MODELLING FOR THE COMBINED TURBINE /CONTROL
BUILDING
3.1
General
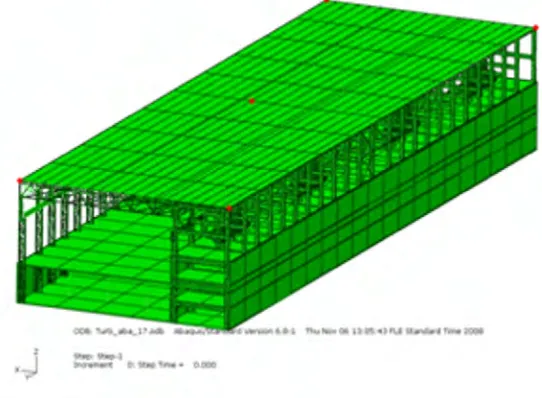
A large finite element (FE) model of the turbine hall was constructed using mainly shell elements. Beam and truss elements were used in some selected regions in order to simplify the modeling task. For example the additional support structures of the feed water tanks were modeled with beam elements. The concrete pedestals of the feed water tanks were modeled with solid brick elements. The turbine hall concrete floors and walls were modeled using special continuum shell elements which are available in Abaqus software [2].The feed water tank capacity is the most important aspect for turbine/control building seismic probabilistic safety assessment. In order to assess the feed water tank capacity against susceptibility for leak and support failure the local detailed model of the tank and the support structures were set up. The capacity analysis of the feed water tank was carried out by increasing the calculated floor response spectra and corresponding synthetic floor motion stepwise beginning from ground motion peak acceleration value of 0.056g with the step of 0.056g so that the analyzed PGA values would be 0.056g, 0.112g, 0.178g, 0.234g, 0.28g, 0.336g, 0.392g, 0.448g, 0.504g, 0.56g. The concrete post-cracking behavior used in detailed feed water tank analysis has been taken according to the presented in the ABAQUS documentation [2]. Local finite element model for feed water tank fragility analysis including the tank itself, the two de-aerator towers, the three steel box structures presenting the support accessories for fixed middle support and roller end supports as well as the reinforced concrete pedestals anchored to the steel frame of the turbine building was developed. The finite element model of turbine/control building is depicted in Figure 1.
3.2
Material Properties
General material properties are presented in Tables 1, 2 and 3 for each FE -model.
ρ
[kg/m
3]
E [MPa]
ν
Concrete
2500
30 000
0.2
Steel parts
7850
200 000
0.3
Table 1 Material properties for global linear model
ρ [kg/m3] E [MPa] ν σY [MPa]
Concrete 2500 30 000 0.2 10
Steel parts 7850 200 000 0.3 235
Table 2 Material properties for global model with perfectly plastic material model for steel and equivalent von Mises model for concrete
ρ [kg/m3] E [MPa] ν σY [MPa]
Concrete 2500 30 000 0.2 Brittle cracking
shown in fig. 10
Concrete reinfocing bars
7850 200 000 0.3 250
Roller support 7850 200 000 0.3 Linear elastic
Feed water tank body
7850 200 000 0.3 250
Table 3 Material properties for local linear model of the feed water tank
3.3
Seismic Load
The ground motion response spectra shape used in the structural response analysis of the turbine building model has been taken from the YVL 2.6 – guide [3]. This spectral shape represents the envelope ground response spectrum for Southern Finland corresponding to the median annual occurrence frequency of 10-5. The accepted spectral shape in YVL 2.6 is determined as follows. The acceleration values of the ground response spectrum are directly proportional to the peak acceleration of the ground surface (PGA), which corresponds to the spectral acceleration on high, over 50 Hz frequencies. With the frequencies which are smaller than 50 Hz the accelerations decrease in proportion to the relative damping of the oscillator supposed to be located in the bedrock surface. The suitable bedrock spectrum form corresponding to region south of the sixty third latitude in continental Finland and corresponding to the values of 0.056g (median value for 100 000 year frequency) for PGA and 5% for the relative damping of the oscillator is used as the definition of ground motion to be used as the excitation in structural models.
4
RESULTS
Stress Limits. The failure limit used in this report is the cumulated plastic strain of 8% in the
reinforcing bars or anchor bolts. This failure limit has taken from the reference [4]. In this reference
the proposed NRC strain-based acceptance criteria for energy-limited events are given. The failure
strain limits e
u(strains at maximum load) are given for high strength carbon steel and for austenitic
stainless steel 304L are given in the reference [4]. The recommendations given in reference [4] for
the criteria to limit the average trough the thickness equivalent plastic strain (EPS) for local and
non-local strain values are:
Equation 2 EPS<0.9 εut /TR (local)
Equation 3 EPS<0.7 εut /TR (non-local)
In Equation 2 and in Equation 3 the parameter TR = Triaxiality Factor =Mean Stress/ Octahedral
Shear Stress and
Equation 4 εut = ln (1+eu)
In Equation 4 the e
uis the engineering strain. Following the reference [4] the cumulative plastic
strain limit against loss tightness for the feed water tank steel material was taken to be 8 %. The
parameter to be followed and monitored in the numerical simulation of the failure modes local feed
water tank model is called work equivalent plastic strain and its meaning is explained in the
reference [4].
The seismic fragility of a component is defined as the conditional probability of its failure given a
value of peak ground acceleration. Using the lognormal-distribution assumption, the fragility (i.e.,
the probability of failure, f') at any non-exceedance probability level Q can be derived as
Equation 5 f’ = Φ[(ln(a/A) +βUΦ-1 (Q))/βR]
In Equation 5 Q = P(f < f'|a) is the probability that the conditional probability f is less than f' for a
peak ground acceleration a. A is the median ground acceleration capacity,
β
Ris the logarithmic
standard deviation representing the inherent randomness about A, and
β
Uis the logarithmic standard
deviation representing the uncertainty in the median value. The quantity
Φ
(.) is the standard
Gaussian cumulative distribution function, and
Φ
-1(.) is its inverse. The median value A for the feed
water tank is obtained from failure criteria of 8% for the work equivalent plastic strain in the anchor
bolts of the center support of the four feed water tanks modelled explicitly in global finite element
model depicted in Figure 1 and the coefficients
β
Rand
β
Uare derived as in the following Table 4:
β
Rβ
UCapacity Factor
0.00 0.23
Equipment Response Factor 0.08
0.17
Structural Response Factor 0.27
0.25
Ground Acceleration Capacity
0.28
0.38
Table 1 The derivation of logarithmic standard deviations βR =0.28 for randomness and βU = 0.38 for
uncertainty in Equation 4
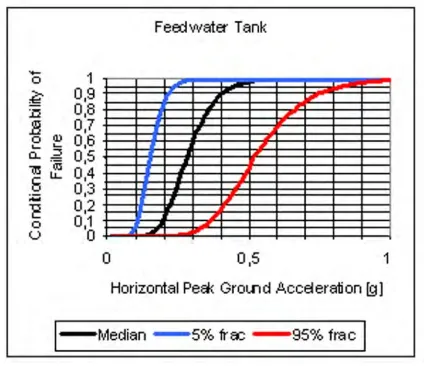
Using the median peak ground acceleration capacity of 0.28g and logarithmic standard deviations
β
R= 0.28 for randomness and
β
U=0.38 for uncertainty the graphical presentation of the fragility
Figure 2 The updated fragility of the feed water tanks showing the median failure capacity of 0.28g in peak ground acceleration and the logarithmic standard deviations βR = 0.28 for randomness
and βU =0.38 for uncertainty
5
CONCLUSIONS
As a consequence of more accurate geometric modeling and more advanced material modeling as well as the use of new strain based failure criteria in estimating the component capacity the median value of the estimation for peak ground acceleration capacity of the Loviisa NPP main feed water tanks was increased from 0.15g obtained in the seismic PSA study from 1991 [5] up to the value of 0.28g obtained in the current study..
REFERENCES
[1] Säteilyturvakeskus Asiakirja No. A213/73, Säteilyturvakeskuksen lausunto Loviisan Ydinvoimalaitoksen käyttöä koskevasta lupahakemuksesta, Liite 1, Loviisan Ydinvoimalaitoksen Turvallisuusarvio, 3.7.2008
[2] ABAQUS version 6-7.1, Users documentation, Simulia Inc., Dassault Systèmes, 2004, 2007.
[4] NRC Perspective on Structural Mechanics Simulation Software, Gordon S. Bjorkman, SMiRT20 Preconference Topical Workshop, Identifying Structural Issues in
Advanced Reactors, Hotel Haikko Manor, Porvoo, Finland Nov. 5 – 6, 2008