Copyright 0 1983 by the Genetics Society of America
APPLICATION OF THE OVARIAN TERATOMA MAPPING
METHOD IN T H E MOUSE
JANAN T. EPPIG and EVA M. EICHER
The Jackson Laboratory, Bar Harbor, Maine 04609
Manuscript received October 5, 1982 Revised copy accepted December 20, 1982
ABSTRACT
Murine ovarian teratomas were used to determine recombination percentages for gene-gene and centromere-gene intervals. Data were obtained utilizing a recombinant inbred strain, LTXBJ, and a number of newly developed LT/SvEi congenic strains. --Centromere-gene recombination was measured a t 11.3 & 1.2% for the centromere of chromosome 7 - Gpi-1 interval and 15.8 2 2.4% for
the centromere of chromosome 14 - Np-1 interval using the ovarian teratoma method. The centromere - Np-1 interval was measured at 26.5 f 3.6% using a standard backcross involving the RbGBnr Robertsonian translocation as a cen- tromere marker. --To assess the accuracy of the ovarian teratoma mapping method, we compared the recombination frequency obtained for the Mpi-l- Mod-1 interval on chromosome 9 using the ovarian teratoma method to that obtained using a standard backcross. The recombination percentage w a s 22.9 & 5.4 using the ovarian teratoma method and 18.6 & 3.3 using the backcross method, indicating that the two methods produce equivalent estimates of recombination. In addition, for centromere-gene intervals known to be more than 30 cM in length, the ovarian teratoma method was cmsistent with classical recombination methods, yielding high recombination percentages. W e conclude from these results that the ovarian teratoma mapping method is a reliable method for estimating recombination frequencies and the most accurate method available for estimating centromere-gene recombination frequency in the mouse.
LTHOUGH more than
450
genes have been positioned on the chromosome
A
map of the laboratory mouse, one region on each of the chromosomes
remains poorly defined in terms of recombination frequency: the region between
the centromere and nearby genes.
To
date, two methods have been used to
estimate centromere-gene recombination percentages. One method uses cyto-
logical centromere markers, such as Robertsonian translocations or centromeric
heterochromatin polymorphisms, as codominant genetic (centromeric) markers
in conventional linkage crosses
(CATTANACH
and
MOSELEY
1973;
LYON,
BUTLER
and
KEMP
1968;
EICHER
et al.
1977;
DAVISSON
and
RODERICK
1975).
The centro-
mere-gene recombination percentages obtained using Robertsonian transloca-
tions are suspect, however, because these chromosomal aberrations often cause
disturbances in the crossing over process. In addition, the effect of Robertsonian
translocations on recombination may depend on the chromosomes involved, the
origin of the Robertsonian chromosome or both
(CATTANACH
and
MOSELEY
1973;
LYON,
BUTLER
and
KEMP
1968).
At present there are no data assessing the effect
of centromeric heterochromatin
on centromere-gene recombination.
798
1.
T. EPPIG AND E. M. EICHERThe second method for determining centromere-gene recombination percent-
ages utilizes ovarian teratomas. In man and mouse these tumors originate from
oocytes that have completed the first meiotic division
(MI) but not the second
(MII);
see Figure
1
(LINDER
1969; LINDER and POWER
1970; EPPIG et
al.
1977;
EICHER
1978, 1981). By determining the frequency of heterozygous teratomas in
heterozygous females, w e can estimate recombination frequency in a manner
similar to that used in Neurospora tetrad and Drosophila attached-X analyses.
The ovarian teratoma mapping method has been used to estimate the recombi-
nation frequency between the centromere of human chromosome
6
and the
phosphoglucomutase-3 (PGM3) locus (OTT et
al.
1976a), and the centromere of
mouse chromosome 7 and the glucose phosphate isomerase-1 locus
(Gpi-2)
(EICHER
1978).
In this paper, w e demonstrate that the ovarian teratoma method and the
Primary Oocyte in Heterozygous
Gpi-lO/Gpi-Ib Female
W i t h Crossover NO crossover M e i o s i s
I
Polor
Secondary Oocyte
Te rotomo
Polar
G P I - I
-
OVARIAN TERATOMA MAPPING IN MICE
799
classical backcross method yield an equivalent gene-gene recombination fre-
quency for the mannose phosphate isomerase-1 (Mpi-1)-supernatant malic
enzyme
( M o d - I )
interval on chromosome
9.
Data are presented that refine the
chromosome
7centromere
-
Gpi-2 recombination percentage. In addition,
ovarian teratomas are used to estimate the recombination frequency between
the centromere of chromosome
14
and the nucleoside phosphorylase-1 (Np-1)
locus.
For
comparison, the centromere
-
Np-1 recombination frequency is
measured using the Robertsonian translocation Rb(9.14)6Bnr.
MATERIALS A N D METHODS Mice
To use the ovarian teratoma mapping method, three conditions must be met: (1) females must develop ovarian teratomas a t a reasonable frequency, (2) females must be heterozygous for the gene examined and (3) the gene of interest must be expressed and its product detectable in teratoma tissue.
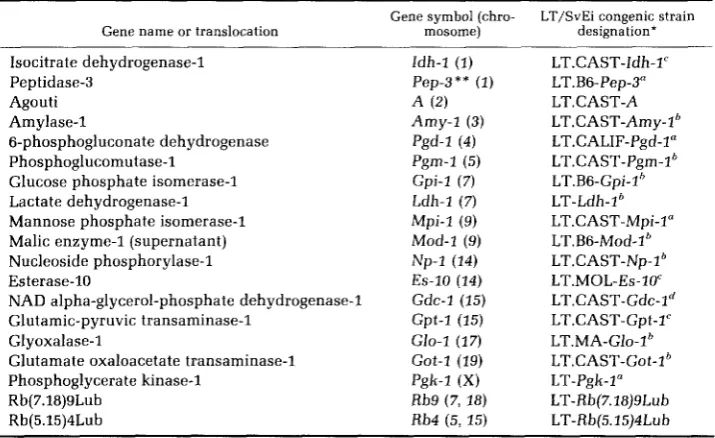
Ovarian teratomas are very rare in the laboratory mouse except in the inbred strain LT/Sv, where 50% of the females develop ovarian teratomas by 3 months of age (STEVENS and VARNUM 1974). To obtain female mice that develop ovarian teratomas and are heterozygous for specific genes, we created a number of new LT/SvEi congenic strains (see FLAHERTY 1981 for review of methods to produce congenic strains). Each congenic strain w as made by crossing LT/Sv mice to those of another strain (e.g., C57BL/6J, MA/MyJ) and mating the F1 progeny back to LT/Sv. Mice of the Na and subsequent generations were typed for the genes of interest and appropriate heterozygous mice mated to LT/Sv. At the NIO backcross generation, each line was inbred by brother-sister matings to produce congenic strains homozygous for 'the alternative allele to that carried by LT/Sv. Table 1 lists the LT/SvEi congenic strains produced. g enes placed on the LT/Sv genetic background were codominant isozyme-encoding loci whose products were detectable in ovarian teratomas. In addition, the agouti (A) allele and two Robertsonian translocations, Rb(5.15) 4Lub (Rb4Lub) and Rb(7.18)gLub (RbSLub), were placed on the LT/Sv background.
To produce the data reported in this paper, the following congenic strains were used: LT.B6-Pep- 3". LT.CALIF-Pgd-la, LT.CASTrPgm-l', LT.BG-Gpi-l', LT.CAST-Mpi-l", LT.BG-Mod-l', LT.CAST- Np-lb and LT.CAST-Got-1'. In addition, a recombinant inbred (RI) strain, LTXBJ, kindly supplied by DR. L. C. STEVENS, was used in crosses to obtain Gpi-l"/Gpi-l females. This RI strain, derived from LT/Sv and C57BL/6J, carried the Gpi-1' allele.
Matings for determining recombination percentages
When the ovarian teratoma mapping method is employed, all recombination is measured in females. Therefore, to compare the ovarian teratoma method with the backcross method, all backcross progeny were produced using FI female parents.
Gene-gene interval (Mpi-1-Mod-1) F, females were produced by crossing mice from the LT.CAST- Mpi-1" congenic strain to animals from the LT.B6-Mod-1 congenic strain. These females were used as the source of ovarian teratomas or mated to LT/Sv (Mpi-lb Mod-l"/Mpi-l* Mod-1") males to
produce backcross progeny. Macroscopic ovarian teratomas were dissected from FI females 90 days of age and analyzed for Mpi-1 and Mod-1. Backcross progeny were killed at 20-30 days of age and typed for Mpi-1 and Mod-1.
Centromere-gene interval: Ovarian teratoma data for centromere-gene intervals were obtained from two sources: (1) females not needed for breeding during the development of the congenic strains (backcross generations N2-Nlo), and (2) females produced in matings between a n LT/SvEi congenic strain and either LT/Sv or another LT/SvEi congenic strain. At 90 days of age, both types of females were killed by cervical dislocation and inspected for macroscopic ovarian teratomas. Teratomas were dissected and analyzed for the appropriate isozyme markers. Tissue from each teratoma-bearing female was analyzed to confirm that the female was heterozygous.
800 J. T. EPPIG AND E. M. EICHER TABLE 1
LT/SvEi Congenic stoins
Gene name or translocation
Gene symbol (chro- mosome)
LT/SvEi congenic strain designation*
Isocitrate dehydrogenase-1 Peptidase4
Agouti Amylase-1
6-phosphogluconate dehydrogenase Phosphoglucomutase-1
Glucose phosphate isomcrase-1 Lactate dehydrogenase-1 Mannose phosphate isomerase-1 Malic enzyme-1 (supernatant) Nucleoside phosphorylase-1 Esterase-10
NAD alpha-glycerol-phosphate dehydrogenase-1 Glutamic-pyruvic transaminase-1
Glyoxalase-1
Glutamate oxaloacetate transaminase-1 Phosphoglycerate kinase-1
Rb(7.18)SLub Rb(5.15)4Lub
Idh-1 (1) Pep-3** (1)
A (2) Amy-1 (3) Pgd-1 (4) Pgm-1 (5)
Gpi-1 (7) Ldh-1 (7) Mpi-1 (9)
Np-l (14) Es-10 (14) Gdc-1 (15)
Gpt-1 (15) Glo-1 (17) Mod-1 (9)
Got-1 (19)
Pgk-1 (X)
Rb9 (7, 18)
Rb4 (5, 15)
LT.CAST-Idh-I' LT.B6-Pep-3" LT.CAST-A LT.CAST-Amy-lh LT.CAST-Pgm-I* LT.B6-Gpi-Ih LT- Ld h- 1 LT.CAST-Mpi-1" LT.B6-Mod-3' LT.CALIF-Pgd-I" LT.CAST-NP-I~ LT.MOL-Es-10' LTCAST-Gdc-1" LT.CAST-Gpt-1' LT.MA-GIO-I~ LTCAST-Got-1 LT-Rb(7.18)gLub LT-Rb(5.15)4Lu b
LT-Pgk-1"
All LT congenic strains contain the LT Y chromosome.
* The abbreviations for the strains of origin for the alleles are as follows: CAST = Mus musculus castaneous, B6 = C57BL/6J, MOL = M . m. molossinus, MA = MA/MyJ and CALIF = Californian mice. The Pgk-1" allele originated in Danish wild mice. The Robertsonian translocations originated in wild European mice from northern Italy near Bergamo (Alpie Orobie).
* * Formerly dipeptidase1 (Dip-1).
were mated to LT.CAST-Np-lh males to produce backcross progeny. This result was compared with the recombination frequency measured using the ovarian teratoma method.
Isozyme methods
The isozymes used in this study were PEP-3, PGD-1, PGM-1, GPI-I, MPI-1, MOD-1, NP-1 and GOT-1 (see Table 1). Red blood cells (RBCs), liver or teratomas were analyzed. Packed RBCs (1.6- cm length of a hematocrit tube) were lysed with 0.1 ml of hemolysate solution (1 mg of ethylene- diamine tetraacetic acid, tetrasodium salt, per ml of distilled HLO). Liver or teratoma tissue was stored frozen for up to 3 weeks at -20". Samples were homogenized in distilled Hz0 (v/v) and centrifuged at 27,713 X g for 30 min. Electrophoresis was performed directly on liver or teratoma supernatants, or RBC lysates. Electrophoresis was conducted on Titan 111 (Helena Laboratories) cellulose acetate plates using Helena Zip Zone electrophoresis apparatus. Electrophoretic conditions and staining methods used for GPI-1 were those of EICHER and WASHBURN (1978), for MPI-1 and MOD-1 those of EICHER et al. (1980), and for NP-1 those of WOMACK et al. (1977).
OVARIAN TERATOMA MAPPING IN MICE
801
GOT-1 was run for 30 min and then observed after staining with 3 ml of prepared stain mixture (100 ml of pH 7.0 phosphate buffer, 10 mg of pyridoxal 5’-phosphate, Sigma P-9255, 460 mg of L-aspartic acid, Sigma A-9256, and 260 mg of alpha-ketoglutarate, Sigma K-1750, adjusted to pH 7.4 with 2 N NaOH) plus 0.1 ml of saturated solution of fast blue BB (Sigma F-0250) and 2 ml of agar. PEP-3 was run for 30 min and then observed after staining with a mixture of 2 ml of pH 7.0 phosphate buffer, 0.03 ml of MnClz (0.25 M), 0.06 ml of Crotalus adamanteus snake venom (Sigma V-6875, 10 mg/ml), 0.06 ml of peroxidase (Sigma P-8520, 10 mg/ml), 0.13 ml of peptide-L-leucyl-L- tyrosine (Sigma L-0501, 10 mg/ml) and 0.13 ml of 0-dianisidine hydrochloride (Sigma D-3127, 1%
solution), plus 2 ml of agar. PGD-1 was run for 15 min and then observed after staining with 2 ml of 0.2 M Tris, pH 8.0, 0.1 ml of MgClz, 0.1 ml of PMS, 0.1 ml of MTT, 0.1 ml of NADP and 0.2 ml of 6-phosphogluconic acid (Sigma P-6888,ZO mg/ml) plus 2 ml of agar. PGM-1 was run for 45 min and the gel stained with 2 ml of 0.2 M Tris, pH 8.0, 0.13 ml of MgClz, 0.13 ml of glucose-1-phosphate (Sigma G-7000, 100 mg/ml), 0.06 ml of PMS, 0.06 ml of MTT, 0.06 ml of NADP, 0.02 ml of alpha-D- glucose 1,6-diphosphate (Sigma G-5875.10 mg/ml), 0.005 ml of glucose-6-phosphate dehydrogenase (Sigma G-8878) and 2 ml of agar.
Mitotic chromosomes
Bone marrow was flushed from the femur and processed as described by EICHER and WASHBURN (1978) for mitotic chromosomes from fetal liver.
Recom binotion determinations for centromere-gene intervals
Recombination frequency between a gene and its centromere (X) can be estimated from the frequency of heterozygous teratomas (Y) using the relation given by OTT et al. (1976a): X = Y/2. The quantity Y must be divided by 2 because the chromosomes of a teratoma are equivalent to those of the potential gamete plus the contents of the second polar body. (In a classical recombi- nation experiment, progeny phenotypes are dependent on the contents of only one of the two chromatids present after MI.) The standard error for X is given by GREEN (1981) as:
S.E.x = (1/2)&(1 - Y)/N,
where N is the total number of teratomas. Because this formula assumes complete interference between the centromere and gene, the recombination fraction obtained is valid only if Y is less than 0.33. As the number of chiasmata between the gene and centromere increases, Y approaches 5% (OTT et al. 1976b).
Recombination determinations for gene-gene intervals
In the backcross method, the recombination fraction (X) measured between two genes is calculated as: X = R/N, where R equals the number of recombinant offspring and N equals the total number of offspring.
In the ovarian teratoma method, the recombination fraction (X) measured between two genes is calculated as: X = Z/2 = R‘/2N, where Z equals the proportion of chromatids in the ovarian teratomas that are recombinants between the two genes. The quantity Z must be divided by 2 a s previously discussed (see centromere-gene intervals). Z is equivalent to R’ (the number of teratomas with recombinant chromatids in the gene-gene interval) divided by N (total number of teratomas).
Table 2 shows how to derive R’. R’ is the sum of classes 111, IV, IVa and twice class V. Because class IVa is phenotypically indistinguishable from class 11, the number of teratomas in this class cannot be directly obtained. However, the number of teratomas in class IV should be equivalent to the number of teratomas in class IVa. Class V must be multiplied by 2 because each teratoma of this type represents two crossovers. Therefore, if the number of teratomas in class 111 equals J, the number of teratomas in class IV equals K, and the number of teratomas in class V equals L. then R
=
+
2(K+
L). This formula requires that the gene order be known for the two genes relative to the centromere. The standard error for X is given by:s . E . ~ = JVar(f)
+
Var(g)+
~(covf,)=
JfCl
-
f ) / 4 N+
g(1 - g ) / N - f g / N where f equals J / N and g equals (K+
L)/N.802 J. T. EPPIG AND E. M. EICHER TABLE 2
Segregation of Mpi-1 ond Mod-1 in ovarian teratomas
Crossover
Chromosomes of tera-
Class toma Phenotype of teratoma
None
Between the centromere and Mpi-1
Between Mpi-1 and Mod-1
Between the centromere and Mpi-1 plus Mpi-1 and Mod-1
4-Strand double between Mpi-1 and Mod-1
MPI-1A MOD-1A
MPI-1B MOD-1B
MPI-1AB MOD-1AB
MPI-1A MOD-1AB
MPI-1B MOD-1AB
MPI-1AB MOD-1B
MPI-1AB MOD-1A
MPI-1AB MOD-1AB
MPI-1A MOD-1B
MPI-1B MOD-1A
* Note: class IVa and I1 are phenotypically indistinguishable.
in the APPENDIX. Those probability values are difficult to apply unless a very large sample size is obtained.
RESULTS
Gene-gene interval
OVARIAN TERATOMA MAPPING IN MICE
803
chromosome
9
(order: centromere
-
Mpi-2
-
Mod-I), were used to test the
equivalence of the ovarian teratoma mapping method and the classical recom-
bination mapping method. F1 females were produced by crossing animals from
the LT.CAST-Mpi-1" congenic strain with those from the LT.BG-Mod-l* congenic
strain. These females were used for the teratoma mapping experiment
or
backcrossed to LT/Sv (Mpi-1
*
Mod-2 "/Mpi-l Mod-1
")
males. The recombina-
tion percentage between Mpi-1 and Mod-1 was
18.6
f
3.3
(Table
3).
Mod-1
*
females is shown in Table
3.
The crossover events that produced these
teratoma phenotypes are shown in Table 2. The phenotypes MPI-1A MOD-1A
and
MPI-1B MOD-1B represent the parental (nonrecombinant) types. The
phenotype MPI-1AB MOD-1AB represents crossovers between the centromere
and Mpi-1 plus
%
the crossovers between the centromere and Mpi-1 a n d Mpi-1
and Mod-2. A crossover event between Mpi-2 and Mod-1 produced the teratoma
phenotypes MPI-1A MOD-1AB and MPI-1B MOD-1AB. T h e MPI-1AB MOD-
1A and MPI-1AB MOD-1B phenotypes represent
%
the crossovers between the
centromere and Mpi-1 and Mpi-2 and Mod-2. A four-strand double crossover
between Mpi-1 and Mod-1 produced the teratoma phenotypes MPI-1A MOD-1B
and MPI-1B MOD-1A. The recombination percentage between Mpi-2 and Mod-
2
is
22.9
&5.4,
using the formula X
=R'/2N
=(J
+
2(K
+
L))/ZN
=(1
+
26)/118.
The estimate of recombination for the Mpi-1-Mod-2 interval using the back-
cross method was
18.6
+-
3.3%,
a value not different from the estimate of
22.9
+- 5.4% for the interval using the teratoma method (P >
0.5).
W e conclude from
this experiment that the teratoma mapping method is a valid method for
measuring genetic recombination percentages.
Genes unlinked to their centromeres
If the teratoma mapping method produces recombination percentages equiv-
alent to classical recombination methods, w e would not expect genes known to
be more than
30
cM
from the centromere to show linkage to the centromere
using the ovarian teratoma mapping method. Table
4shows data obtained for
six genes (Pep-3, Pgd-1, Pgm-1, Mpi-2, Mod-1 and Got-1) that meet this criterion.
For
each gene, the proportion of heterozygous teratomas
(Y)
obtained from
heterozygous host females was greater than
0.50,
well above the maximum of
0.33
needed to obtain a meaningful centromere-gene distance. These results are
consistent with the known chromosomal location of these genes and suggest
that recombination is not inhibited in oocytes that later become teratomas.
Centromere-gene intervals
Centromere-gene recombination frequencies were determined for the centro-
mere of chromosome
7
-
Gpi-1 interval and the centromere of chromosome
24-
Np-2 interval.
The
GPI-1 phenotypes of 241 ovarian teratomas from heterozygous Gpi-l"/
Gpi-Zb females are listed in Table
5.Five of these teratomas had a GPI-1A plus
GPI-1B band and lacked the heterodimeric band of a GPI-1AB phenotype. This
pattern is identical with that produced by mixing GPI-1A with GPI-1B samples,
804
J. T. EPPIG ANDE.
M . EICHERTABLE 3
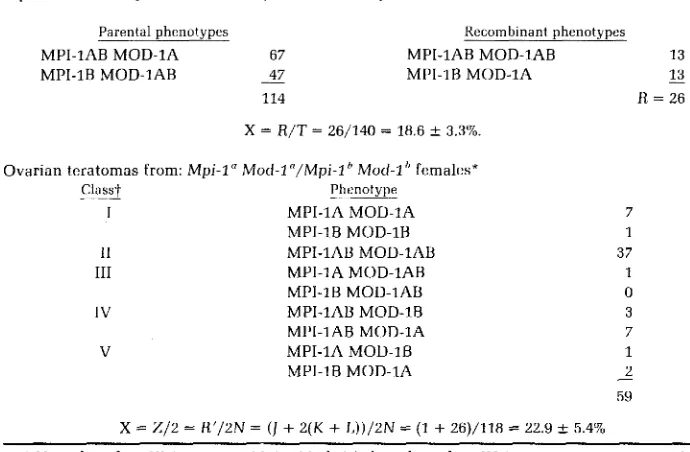
Phenotypic distribution of Mpi-1 and Mod-1 in backcross animals anti ovarian teratomas
Backcross:
Mpi-1" Mod-l"/Mpi-l Mod-lh X MDi-lh Mod-l"/Mpi-I" Mod-1"
Parental phenotypes Recombinant phenotypes
MPI-1AB MOD-1A 67 MPI-1AB MOD-1AB 13
13
114 R = 26
MPI-1B MOD-1AB - 47 MPI-1B MOD-1A -
X = R/T = 26/140 = 18.6 f 3.3%.
Ovarian teratomas from: Mpi-1" Mod-1 "/Mpi-1 Mod-1 females*
~ Classt Phtmotype
I MPI-1A MOD-1A
MPI-1B MOD-1B
I1 MPI-1AB MOD-1AB
111 MPI-1A MOD-1AB
MPI-1B MOD-1AB
IV MPI-1AB MOD-1B
MPI-1AB MOD-1A
V MPI-1A MOD-1B
MPI-1B MOD-1A
X = Z / 2 = R'/2N =
(I
+
2 ( K+ L ) ) / 2 N
= (1+
26)/118 = 22.9+-
5.4'707
1
37
1 0 3
7
1 2
59
-
* Note that class 111 (crossover Mpi-2-Mod-1) is less than class IV (crossover centromere
-
Mpi-1 and Mpi-1-Mod-I). This may be a sampling artifact or a peculiar characteristic of chromosome 9 in the centromere - Mpi-1 region favoring chiasmata in that region.t
See Table 2.confirming that each was composed
of two distinct teratomas. Teratomas of
the phenotypes GPI-1AB plus
GPI-1B
or
GPI-1AB
plus GPI-1A were not found.
The few teratomas composed of two distinct teratomas of like phenotype would
not be detectable. However, the calculated recombination percentage would not
significantly change because the total number of teratomas typed was large (N
=
241).
In this experiment, the recombination percentage between the centro-
mere of chromosome
7and Gpi-1 is
11.4
+-
1.4 (55
recombinants out of
241
teratomas).
In two additional reports (EPPIG
et
al.
1977;
EICHER
1978),
the chromosome
7
centromere
-
Gpi-1 interval was measured using the ovarian teratoma method.
The data from these reports plus the present study are presented in Table
5.
The combined recombination percentage between the centromere of chromo-
some
7and
Gpi-1
is 11.3
f
1.2 (65
recombinants out of
288
teratomas).
The
NP-1
phenotypes of
95
ovarian teratomas from
Np-l"/Np-lh
females
were distributed as follows:
37were
NP-lA, 28
were
NP-1B
and
30
were
NP-
1AB.
The recombination percentage between the centromere
of
chromosome
14OVARIAN TERATOMA MAPPING IN MICE
805
TABLE 4
Phenotype of ovarian teratomas derived from females heterozygous for genes known to be at least 30 cM from the centromere
Host Chromosome Teratoma Number of teratomas Y*
PEP-3AB 1 PEP-3A
PEP-3B PEP-3AB
3
13 0.52
17
PGD-1 AB
PGM-1 AB
M P I - 1 AB
MOD-1 AB 9
PGD-1A PGD-1B PGD-1AB
PGM-1A PGM-1B PGM-1 AB
Total 33
a
a
0.6631
Total 47
5
2 0.65
13
Total 20
MPI-1A 13
MPI-1B 4 0.76
MPI-1AB 55
Total 72
MOD-1A 25
MOD-1B
a
0.61MOD-1AB 51
Total 84
GOT-1 AB 19 GOT-1A 6
GOT-1B 7 0.52
GOT-1AB 14
Total 27
* Y is the frequency of heterozygous teratomas.
To
compare the centromere-gene recombination percentage obtained using
the teratoma method with that obtained using a Robertsonian translocation as
a centromeric marker, a backcross was made between Rb6
N p - l a / + Np-1'
females and
+
N p - l b / + N p - l b
males. Of 147 offspring analyzed, 32 were of the
RB6 NP-1AB phenotype, 14 were RB6 NP-lB, 25 were
+
NP-1AB and 76 were
+
NP-1B. The recombination percentage for this cross is 26.5
k3.6. This
backcross gave a different recombination percentage for the centromere-gene
interval from the value of 15.8 estimated using thz ovarian teratoma method (P
806 J. T. EPPIG AND E. M. EICHER
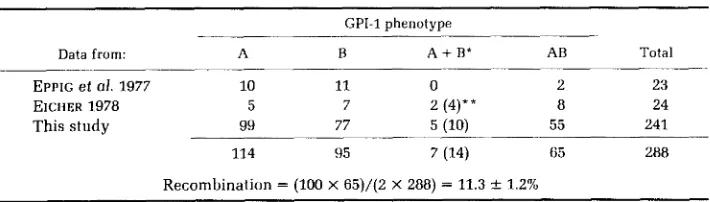
TABLE 5
Phenotype of teratomas from Cpi-1"/Gpi-lh females
GPI-1 phenotype
Data from: A B A
+
B* AB TotalEPPIC et al. 1977 10 11 0 2 23
EICHER 1978 5 7 2 (4)** 8 24
This study 99 77 5 (10) 55 241
114 95 7 (14) 65 288
Recombination = (100 x 65)/(2 X 288) = 11.3 1 1.2%
* Each of these teratomas represents two distinct teratomas, one GPI-1A and one GPI-1B, that
* * Actual number of teratomas.
arose in a single ovary and were not separated when dissected.
DISCUSSION
The ovarian teratoma method is a recently developed method for obtaining
recombination frequencies between the centromere and nearby loci. Until now,
centromere-gene recombination frequencies in the laboratory mouse have been
poorly defined relative to the remainder
of the chromosome map. The data
reported here demonstrate the validity of the ovarian teratoma mapping method
and establish centromere-gene recombination frequencies for two mouse chro-
mosomes.
We determined a gene-gene recombination percentage using the ovarian
teratoma method to ascertain whether this mapping method is equivalent to
classical recombination measurements. Recombination between Mpi-2 and
Mod-I on chromosome
9
was estimated at
18.6
k3.3%
from backcross data and
22.9
&5.4%
using the ovarian teratoma mapping method. Thus, the recombina-
tion percentage determined for this gene-gene interval is the same whether
applying the backcross method
or the ovarian teratoma method. We conclude
that the ovarian teratoma method is a reliable method for determining recom-
bination percentage.
A further demonstration of the validity of the teratoma method is the behavior
of genes known to be far from their centromeres. We found that, in fact, there
was no evidence to suggest these genes were linked to their centromeres using
the ovarian teratoma method, and thus, the result was consistent with classical
recombination measurements. These results also suggest that there is no sup-
pression of recombination in oocytes that later become teratomas.
Centromere-gene recombination percentages were determined for two mouse
chromosomes. The recombination percentage between the centromere of chro-
mosome
7
and Gpi-1 was
11.3 k1.2
and between the centromere of chromosome
24
and
Np-2
was
15.8 k2.4. In contrast, the chromosome
24
centromere
-
Np-2
recombination percentage was 26.5
f
3.6 using Rb(9.14)6Bnr as a cytological
centromeric marker.
OVARIAN TERATOMA MAPPING IN MICE
807
OTT
et
al.
(1976b) to relate the frequency of heterozygous teratomas
(Y)
to the
map distance
(D)
measured in morgans:
D
= '/s
arcsin[(3/2)Y]. This function
agrees well with empirical data from Drosophila and Neurospora and closely
follows the Ludwig and Carter-Falconer mapping functions
(OTT
et al. 197613).
The chromosome
7
centromere
-
Gpi-2
distance is 11.5 cM and the chromosome
14
centromere
-
Np-2
distance is 16.4 cM, using
OTT'Smapping function.
In summary, we have demonstrated that the ovarian teratoma mapping
method is an important tool for determining accurate recombination frequencies
for centromere-gene intervals. The method produces recombination fractions
comparable to the backcross method and shows the expected high recombina-
tion fractions for centromere-gene intervals known to be greater than
30
cM.
The ovarian teratoma method has now been used to obtain two centromere-
gene recombination frequencies in the laboratory mouse and will be valuable in
defining other centromere-gene intervals.
We thank LEROY STEVENS for kindly providing the LTXBJ mice; VERNE CHAPMAN for providing the Pgk-1- allele from Danish wild mice and the California mice; and MURIEL DAVISSON for providing the Robertsonian translocations, Rb(5.15)4Lub and Rb(7.18)9Lub (originating from ALFRED GROPP in Lubeck). We thank MARGARET GREEN for helpful suggestions on the manuscript. This research was supported by grants GM 20919 and RR 01183 from the National Institutes of Health (to E.M.E.). The research was conducted while J.T.E. was a predoctoral student in the Zoology Department a t the University of Maine at Orono. The Jackson Laboratory is fully accredited by the American Association for Accreditation of Laboratory Animal Care.
LITERATURE CITED
CATTANACH, B. M. and MOSELEY, H., 1973 Nondisjunction and reduced fertility caused by the
Mouse News Lett. 53: 34.
tobacco mouse metacentric chromosomes. Cytogenet. Cell Genet. 12: 264-287.
DAVISSON, M. T. and RODERICK, T. H., 1975
EICHER, E, M., 1978 Murine ovarian teratomas and parthenotes as cytogenetic tools. Cytogenet.
EICHER, E. M., 1978 Foundation for the future: formal genetics of the mouse. pp. 7-49. In: Mammolian Genetics and Concer: The Jackson Laboratory Fiftieth Anniversary Symposium, Edited by E. S. RUSSELL. Alan R. Liss, Inc., New York.
Cell Genet. 2 0 232-239.
EICHER, E. M.,
1.
MAY, J. L. SOUTHARD and L. L. WASHBURN, 1977EICHER, E. M., B. A. TAYLOR, S. C. LEIGHTON and J. E. WOMACK, 1980 A serum protein polymor-
EICHER, E. M. and L. L. WASHBURN, 1978 Assignment of genes to regions of mouse chromosomes.
EPPIG, J. J., L. P. KOZAK, E. M. EICHER and L. C. STEVENS, 1977 Ovarian teratomas in mice are
FLAHERTY, L., 1981
Mouse News Lett. 56: 42.
phism determinant on chromosome 9 of Mus musculus. Mol. Gen. Genet. 177 571-576.
Proc. Natl. Acad. Sci. USA 75 946-950.
derived from oocytes that have completed the first meiotic division. Nature 269 517-518.
Congenic strains. pp. 215-222. In: The Mouse in Biomedical Research, Vol. I, History, Genetics, and Wild Mice, Edited by H. L. FOSTER,
1.
D. SMALL and J. G. Fox. Academic Press, New York.Gene mapping. pp. 105-117. In: The Mouse in Biomedical Research, Vol. I, History, Genetics, and Wild Mice, Edited by H. L. FOSTER, J. D. SMALL and J. G. FOX. Academic Press, New York.
GREEN, M. C., 1981
LINDER, D., 1969 Gene loss in human teratomas. Proc. Natl. Acad. Sci. USA 6 3 699-704.
808
J. T. EPPIG AND E. M . EICHERLYON, M. F., J. M. BUTLER and R. KEMP, 1968
OTT, J., F. HECHT, D. LINDER, E. W. LOVRIEN and B. K. MCCAW, 1976a
The positions of the centromeres in linkage groups
Human centromere mapping using teratoma data. pp. 396-398. In: Baltimore Conference (1375): Third International Work- shop on Human Gene Mapping. Birth Defects: Original Article Series, Vol. 12, No. 7. The National Foundation, New York.
Estimating distances from the centromere by means of benign ovarian teratomas in man. Ann. Hum. Genet. 40: 191-196. The development of teratomas from parthenogenetically I1 and IX of the mouse. Genet. Res. 11: 193-199.
OTT, J., D. LINDER,
B.
K. MCCAW, E. W. LOVRIEN and F. HECRT, 1976bSTEVENS, L. C. and D. S. VARNIJM, 1974 activated mouse eggs. Dev. Biol. 3 7 369-380.
Mapping of nucleoside phosphorylasc (Np-1) and csterise 10 (Es-10) on mouse Chromosome 14. Biochem. Genet. 15: 347-355.
WOMACK, J. E., M. T. DAVISSON, E. M. EICHER and D. A. KENDALL, 1977
Corresponding editor: D. BENNETT
APPENDIX
A simplified calculation was used in the main text to obtain a gene-gene rccombination frequency using ovarian teratoma data. This method assumed that a maximum of one crossover can occur between thc centromere and nearest gene. Double recombinations occurring between the two genes arc counted in the same way as backcross progeny. On the basis of this assumption, five categories of ovarian teratomas were expected, resulting from:
(1) no crossover in either the centromerc-genc or gene-gcne region;
( 2 ) no crossover in the centromcrc-gene region and a single crossover in the gene-gene region; (3) a single crossover in the centromere-gene region and no crossover in the gene-gene region;
(4) a single crossover in both the centromere-gene and gene-gene region: and
(5) a four-strand double crossover in the gene-gene region.
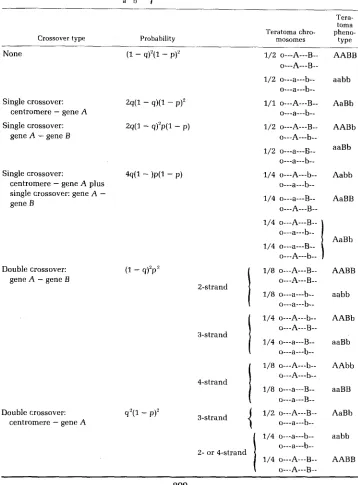
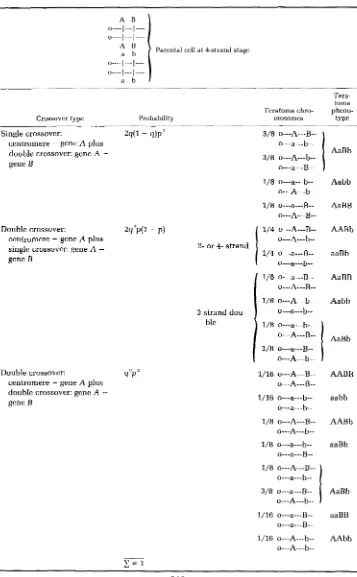
A more cxact method of determining gene-gene recombination frequency using the ovarian teratoma method is prcsented below. All possible double crossover types (two-, three- and four- strand) are assumed to occur in both the centromere-nearest region and gene-gene region. The calculations provide expected proportions of ovarian teratomas of each phenotype assuming various recombination values for the centromere-gene and gene-gene interval. To use these more exact values, a large number of ovarian teratomas are required so that the smallest class (AAbb, aaBB) is sufficiently represented. This class is 2% or less of the total number of ovarian teratomas.
The following discussion assumes that gene A (alleles A and a ) is closer to the centromere than gene B (alleles B and b), that both genes are codominant and that alleles A-B and a-b are in coupling. The probability of a crossover occurring between the centromere and gene A is q , and the probability of a crossover occurring between genes A and B is p. It is also assumed that zero, one or two crossovers can occur in each interval (centromere-gene A and gene A-gene B) in all combinations and without chromatid interference. Thus, double crossovers are expected to occur in the ratio 1 two-strand: 2 three-strand: 1 four-strand.
Table 6 shows the crossover types, the corresponding probability of each crossover type and the resulting chromosomes and phenotypes of the ovarian teratomas. The sum of the probabilities for all crossover types is 1.
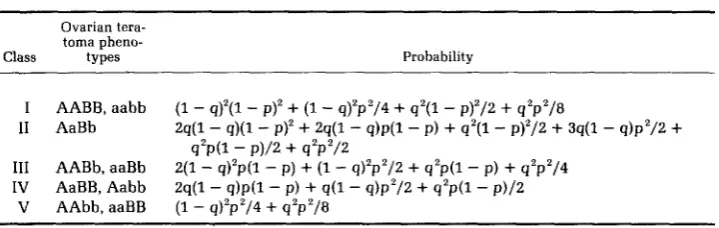
A particular phenotype observed in a n ovarian teratoma can arise by several different crossover combinations (see Table 6). In Table 7, the information from Table 6 has been arranged according to the phenotypes of the ovarian teratomas. Each phenotype has been assigned to a class and the probability of that class has been determined. Actual data collection would be in this form.
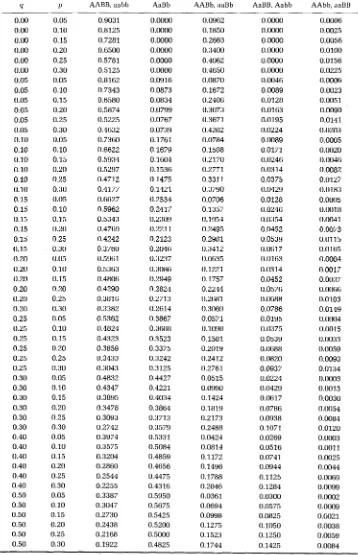
By assigning values to q and p , the expected proportions of each ovarian teratoma phenotype are obtained. Table 8 displays expected proportions for ovarian teratoma phenotypes with q ranging from 0.00 to 0.50 and p ranging from 0.05 to 0.30.
TABLE 6
Teratoma phenotypes resulting from crossingover in specific regions
3-strand
Parental cell at 4-strand stage
o---A---B--
d
TABLE 6 (continued)
Teratoma phenotypes resulting from crossingover in specific regions
%strand dou-
Parental cell at +strand stage
o---A---B--
1/8 o---A---b-- Aabb o---a---b--
Tera-
toma Teratoma chro- pheno-
Crossover type Probability mosomes type
~ I Qn A U I
".
I n,.. \ 2AaBb o---A---B--
1/8 o---a---B.- o---A---b--
1/8 o---A---B-- o---a---b--
3/8 o---a---B-- o---A---b--
OVARIAN TERATOMA MAPPING I N MICE
ai1
TABLE 7Ovarian teratoma phenotypes, classes and probabilities
Ovarian tera- toma pheno-
Class types Probability
I AABB, aabb (1 - qj'(1
-
P ) ~+
(1-
q)'p2/4+
q2(1 - p)'/Z+
q2p2/82q(l - q)(l
-
p)2+
zq(1-
q)p(l-
p)+
q2(1-
p)'/2+
3q(l - q)p2/2+
2(1
-
q)'p(l - p)+
(1-
q)'p2/2+
q 2 p ( l - p)+
q2p2/4 2q(l - q ) p ( l - p)+
q ( l - q)p2/2+
q2p(1 - p)/ZI1 AaBb
q2p(1 - Pj/2
+
q2p2/2 111 AABb, aaBbIV AaBB, Aabb
V AAbb, aaBB (1 - q)'p2/4
+
q2p2/%Thus, a reasonable value for q can be obtained by comparing the actual proportion of AaBb teratomas detected with the expected proportion of AaBb teratomas, providing the frequency of AaBb teratomas is less than 0.20. Values for q ranging between 0.20 and 0.30 show overlap at the extreme values assigned to p. Thus, this is the least reliable region for p and q determinations. Finally, values of q greater than 0.30 produce expected proportions of AaBb teratomas greater than 0.40. Thus, a frequency of AaBb teratomas greater than 0.40 should be considered evidence that the map distance between the centromere and gene A is greater than 30 cM. The measurable centromere- gene recombination frequency using the ovarian teratoma method requires the proportion of heterozygous teratomas to he less than 0.33 (see main text and OTT et al. 1976aj.
TABLE 8
Expected proportion of ovarian teratomas of each phenotype
4 P AABB, a a b b AaBb AABb, aaBb AaBB, A a b b AAbb, daBB
0.00 0.05 0.9031 0.0000 0.0962 0.0000 0.0006 0.00 0.10 0.8125 0.0000 0.1850 0.0000 0.0025 0.00 0.15 0.7281 0.0000 0.2663 0.0000 0.0056 0.00 0.20 0.6500 0.0000 0.3400 0.0000 0.0100 0.00 0.25 0.5781 0.0000 0.4062 0.0000 0.0156 0.00 0.30 0.5125 0.0000 0.4650 0.0000 0.0225 0.05 0.05 0.8162 0.0916 0.0870 0.0046 0.0006 0.05 0.10 0.7343 0.0873 0.1672 0.0089 0.0023 0.05 0.15 0.6580 0.0834 0.2406 0.0128 0.0053 0.05 0.20 0.5874 0.0799 0.3073 0.0163 0.0090 0.05 0.25 0.5225 0.0767 0.3671 0.0195 0.0141 0.05 0.30 0.4632 0.0739 0.4202 0.0224 0.0203 0.10 0.05 0.7360 0.1761 0.0784 0.0089 0.0005 0.10 0.10 0.6622 0.1679 0.1508 0.0171 0.0020 0.10 0.15 0.5934 0.1604 0.2170 0.0246 0.0046 0.10 0.20 0.5297 0.1536 0.2771 0.0314 0.0082 0.10 0.25 0.4712 0.1475 0.3311 0.0375 0.0127 0.10 0.30 0.4177 0.1421 0.3790 0.0429 0.0183 0.15 0.05 0.6627 0.2534 0.0706 0.0128 0.0005 0.15 0.10 0.5962 0.2417 0.1357 0.0246 0.0018 0.15 0.15 0.5343 0.2309 0.1954 0.0354 0.0041 0.15 0.20 0.4769 0.2211 0.2495 0.0452 0.0073 0.15 0.25 0.4242 0.2123 0.2981 0.0539 0.0115 0.15 0.30 0.3760 0.2046 0.3412 0.0617 0.0165 0.20 0.05 0.5961 0.3237 0.0635 0.0163 0.0004 0.20 0.10 0.5363 0.3086 0.1221 0.0314 0.0017 0.20 0.15 0.4806 0.2949 0.1757 0.0452 0.0037 0.20 0.20 0.4290 0.2824 0.2244 0.0576 0.0066 0.20 0.25 0.3816 0.2713 0.2681 0.0688 0.0103 0.20 0.30 0.3382 0.2614 0.3069 0.0786 0.0149 0.25 0.05 0.5362 0.3867 0.0571 0.0195 0.0004 0.25 0.10 0.4824 0.3688 0.1098 0.0375 0.0015 0.25 0.15 0.4323 0.3523 0.1581 0.0539 0.0033 0.25 0.20 0.3859 0.3375 0.2019 0.0688 0.0059 0.25 0.25 0.3433 0.3242 0.2412 0.0820 0.0093 0.25 0.30 0.3043 0.3125 0.2761 0.0937 0.0134 0.30 0.05 0.4832 0.4427 0.0515 0.0224 0.0003 0.30 0.10 0.4347 0.4221 0.0990 0.0429 0.0013 0.30 0.15 0.3895 0.4034 0.1424 0.0617 0.0030 0.30 0.20 0.3478 0.3864 0.1819 0.0786 0.0054 0.30 0.25 0.3093 0.3713 0.2173 0.0938 0.0084
0.40 0.05 0.3974 0.5331 0.0424 0.0269 0.0003
0.40 0.15 0.3204 0.4859 0.1172 0.0741 0.0025 0.40 0.20 0.2860 0.4656 0.1496 0.0944 0.0044 0.40 0.25 0.2544 0.4475 0.1788 0.1125 0.0069 0.30 0.30 0.2742 0.3579 0.2488 0.1071 0.0120
0.40 0.10 0.3575 0.5084 0.0814 0.0516 0.0011
0.40 0.30 0.2255 0.4316 0.2046 0.1284 0.0099 0.50 0.05 0.3387 0.5950 0.0361 0.0300 0.0002 0.50 0.10 0.3047 0.5675 0.0694 0.0575 0.0009 0.50 0.15 0.2730 0.5425 0.0998 0.0825 O.GO21 0.50 0.20 0.2438 0.5200 0.1275 0.1050 0.0038 0.50 0.25 0.2168 0.5000 0.1523 0.1250 0.0059 0.50 0.30 0.1922 0.4825 0.1744 0.1425 0.0084