ABSTRACT
ALBERT, JENNIFER LYNN. Using Student-Generated Animations about Water Boiling to Impact Student Understanding of the Particulate Nature of Matter. (Under the direction of Margaret R. Blanchard and Eric N. Wiebe.)
Atomic and molecular misconceptions are common place in most classrooms. This is not surprising, given that students’ experiences with chemistry are mostly through
macroscopic observations, yet what is taking place chemically occurs at the molecular level. In order to help students gain an understanding of what occurs at the sub-microscopic level of matter, teachers typically employ visualizations of atoms and molecules, which allow students to gain a window into this invisible level of molecular interactions. Thus, the particulate nature of matter is presented to students through various forms of visualizations such as models, pictures in textbooks, and computer animations. Typically, students view visualizations presented in the textbook as a part of reading assignments, and respond to questions. That is, students historically have had little control over the visualizations
presented to them and therefore scant opportunities to evaluate these predominantly textbook models, or demonstrate what they have learned from them.
on how students discussed phase change during a semi-structured interview in which they were asked to draw their model of atoms and molecules. Their findings form the basis for an empirically-based learning progression (LP) on the nature of matter, suggesting the relative order in which students in their study learned about atoms and molecules, as well as aspects of phase change and related concepts.
Drawing on the work of Van Meter and Garner (2005) and Stevens et al. (2010), this dissertation moves students’ interactions with visualizations into the digital realm. Little is known about how students’ interactions with digital animations impact their learning about chemistry. Wu and Shah (2004) reviewed several studies in which students viewing
animations were compared to those not viewing animations. Each of these studies found that students who viewed animations performed better on questions related to dynamic processes.
Less is known about the relationship between students’ involvement in creating animations and students’ conceptual learning. Hübscher-Younger and Narayanan (2008) found that students who created animations explaining mathematical algorithms showed gains in conceptual understanding. To date, only one study has been published in which students constructed original animations. For this study, Chang, Quintana, and Krajcik (2010) investigated how students’ understanding of chemistry was impacted by the
This study is a mixed-methods analysis of 94 students in six Scientific Visualization (Sci Vis) classes of two instructors. The Sci Vis curriculum teaches students to use a variety of visualization tools (e.g. ArcView™, 3ds Max® and Flash™) to display different scientific concepts. For example, students use 3ds Max® to create an animation of DNA replication. Students in two of the classes (Sci Vis I) used CorelDRAW® to construct animations using .JPEG images supplied in a digital folder depicting different elements of water boiling (e.g. pot, steam, molecules). Students in the other four classes (Sci Vis II) used 3ds Max® to create original animations. Students were instructed to read the provided text and produce an animation of water boiling in enough detail that someone looking at the animation would be able to write the text.
The pre/posttest was developed by combining 12 questions from the Particulate Nature of Matter Assessment (Yezierski & Birk, 2006), 15 questions from the Smith et al. (2006) learning progression study, and 3 questions from state end-of-course exams. On Day 1, students were provided with the text and asked to begin their animations. On Day 2, students spent 30 minutes working through a Web-based Inquiry Science Environment (WISE, Linn, Davis, & Bell, 2004) module, answering questions related to phases and phase change and looking at embedded animations. Students then returned to completing their own animations and asked to keep in mind the animations they had just watched as they finished their own. On Day 3, the Group 3 students met in small groups and discussed their
Initial analyses of data indicated that of the 94 total participants in the study, only 35 students had non-zero scores on all assessments. Therefore, these 35 students were selected for analysis and students who did not participate fully were removed. Analyses included repeated measures ANOVA on the pre/posttest, scoring of student animation projects and WISE module question responses according to developed rubrics, and constant comparative coding of informal student interview data. Although there were no statistically significant gains by any of the three groups on the pre/posttest, there was a statistically significant correlation between scores on the pretest and posttest and the total project score. In their animations, students included many of the key elements from the provided text, as suggested by Van Meter and Garner (2005), and in the Stevens et al. (2010) learning progression. Unlike the Van Meter and Garner findings, few students saw a relationship between their animation and those they viewed in the WISE module. Findings indicate that the creation of animations seemed to affect students’ understanding of motion and of the composition of atoms and molecules. This indicates that, for students who engaged cognitively with the activity that employed tenets of Van Meter and Garner’s GTDC, creation of digital animations enhanced conceptual learning.
Findings indicate that it is possible to replicate Van Meter and Garner’s GTDC in a digital environment. Students were able to integrate elements into their own animations from their mental models, the provided text, and the viewed animations. Interestingly, the
from other studies (e.g. Wu & Shah, 2004). However, this was found only in the classes in which students created original animations, not in the classes in which students constructed animations with supplied images. The limited increases in gains scores suggest that all steps – reading the text, beginning the animations, answering questions, and comparing their animations to provided models - are needed in order to have meaningful learning gains when students create digital animations. The modest learning gains by students also suggest that students may need more teacher scaffolding in order to maximize results. Further, students’ creativity seems to have been sparked by the creation of computer animations and many students showed gains in conceptual understanding, as evidenced in their interviews. This implies that the use of digital animation creation may be a way to increase student interest in chemistry.
Using Student-Generated Animations about Water Boiling to Impact Student Understanding of the Particulate Nature of Matter
by
Jennifer Lynn Albert
A dissertation submitted to the Graduate Faculty of North Carolina State University
in partial fulfillment of the requirements for the Degree of
Doctor of Philosophy
Science Education
Raleigh, North Carolina 2012
APPROVED BY:
__________________________________ _________________________________ Alton J. Banks, Ph.D. Margaret R. Blanchard, Ph.D.
Co-Chair of Advisory Committee
__________________________________ _________________________________ M. Gail Jones, Ph.D. Eric N. Wiebe, PhD
DEDICATION
BIOGRAPHY
Jennifer Lynn Albert was born in 1981 in Grass Valley, California. Her parents, Jim and Laura Shuffield, moved to North Carolina when she was three. Laura stayed at home with Jennifer and her brother, Craig, until they both started school. Laura then began the nursing program at FTCC, graduating with a RN in 1990. Jim owns and operates an automotive repair shop and races dirt track with Craig on the weekends. Craig is also a mechanic, married to Brannigan, and has three wonderful children, Owen, Axel, and Piper.
Jennifer excelled in science during high school, taking several AP level courses, and ultimately falling in love with chemistry. She graduated from Terry Sanford High School in 2000 and was a finalist for the Park Scholarship at North Carolina State University. She attended NCSU, ultimately awarded the Joyce Hall Aspnes Scholarship and Target All-Around Scholarship. As an undergraduate, Jennifer participated in Habitat for Humanity, traveling to Columbus, GA to build an entire house over Spring Break. Jennifer graduated with a B.S. in Chemistry in 2003.
received the John and Nell Penick Fellowship and the College of Education Doctoral Dissertation Support Grant.
In 2009, Jennifer took the position of Fayetteville Outreach Coordinator at The
Science House. There she conducting professional development for hundreds of teachers and thousands of students across the state of North Carolina. But, ultimately she returned to the College of Education to run the NSF ITEST grant (STEM Teams) awarded to Dr. Margaret Blanchard.
ACKNOWLEDGEMENTS
I am very grateful for the support given to me throughout this process by my advisors, colleagues, study participants, family, and friends.
Thank you to my advisory committee co-chairs Dr. Margaret Blanchard and Dr. Eric Wiebe for providing direction during the research and writing phases of this dissertation. Dr. Blanchard, thanks for countless hours editing and various other forms of “pinch hitting” and cheerleading. You have been an invaluable mentor, inspiring colleague and a wonderful friend. Dr. Wiebe, thank you for allowing me to work with a curriculum you helped to create, your guidance, and for sharing with me your vast experience with scientific
visualization. I thank my committee members Dr. Gail Jones and Dr. Alton Banks for their thoughtful feedback. I also acknowledge Dr. Jason W. Osborne’s statistical assistance in answering questions regarding various analyses. Finally, thank you to Dr. Lauren Madden for your hours spent coding projects and student responses and for being a good friend.
I am so appreciative for the help of two Sci Vis teachers in Guilford County. Thank you for letting me into your classrooms to work with your students. Your commitment to education is inspiring. Thank you also to your students who agreed to participate. I learned a great deal from them.
positive presence in my life and so thoroughly entertaining my children that they do not even miss me.
TABLE OF CONTENTS
LIST OF TABLES ... ix
LIST OF FIGURES ... x
CHAPTER ONE: INTRODUCTION ... 1
The Nature of Chemistry ... 1
Learner-Generated Drawings ... 5
Creating Visualizations ... 6
Scientific Visualization ... 9
Research Questions ... 10
Summary ... 11
CHAPTER TWO: REVIEW OF THE LITERATURE ... 13
Learning Progressions ... 16
Generative Theory of Drawing Construction ... 24
Scientific Visualization ... 30
Summary ... 37
CHAPTER THREE: METHODOLOGY ... 38
Setting ... 38
Participants ... 41
Lesson Design ... 43
Data Sources and Analyses ... 46
CHAPTER FOUR: DO STUDENT-GENERATED DIGITAL ANIMATIONS ENHANCE STUDENT PROGRESS ALONG A PHASE CHANGE LEARNING PROGRESSION? A
STUDY OF 35 STUDENTS IN SIX SCIENTIFIC VISUALIZATION CLASSES ... 64
Abstract ... 64
Literature Review... 68
Theoretical Frameworks ... 72
Research Questions ... 76
Methods... 76
Participants ... 77
Data Sources and Analyses ... 81
Findings... 88
Discussion ... 101
Conclusion and Implications... 107
REFERENCES ... 109
APPENDICES ... 122
APPENDIX A: Glossary... 123
APPENDIX B: Student Demographic Form ... 124
APPENDIX C: Pre/Posttest ... 125
APPENDIX D: Text Provided to Students ... 132
APPENDIX E: Questions in WISE Module ... 133
APPENDIX F: Rubric for WISE Module Questions ... 134
LIST OF TABLES
Table 2.1 Science content defined between the upper and lower anchors for the hypothetical
learning progression for atomic structure ………..……… 22
Table 2.2 Characteristics of Water Boiling Drawings – Frequency (%) of appearance in Paper (P) versus Computer Drawings (C) ………...….. 28
Table 3.1 School Setting Demographics ………..………. 40
Table 3.2 Description of Participants ……… 42
Table 3.3 Study Design ………...……….. 45
Table 3.4 Description of Data Sources ……….……… 46
Table 3.5 Student Project Rubric ……….………. 51
Table 3.6 Coding Rubric for WISE open-ended questions ………….……….. 55
Table 4.1 Description of Subset Participants ………..……….………….… 78
Table 4.2 Study Design ………..………... 80
Table 4.3 Description of Data Sources ……….… 82
Table 4.4 Summary of data from student exemplars ……….... 86
Table 4.5 Project Scores vs. WISE scores ……….………... 89
Table 4.6 Exemplars of students describing key elements from the water boiling animation activity ………...……….... 90
Table 4.7 Examples of researcher coding of student-generated animation data ………... 93
Table 4.8 Summary of animation project rubric data by group ……… 94
Table 4.10 Exemplars of students’ misconceptions or new conceptions from the water
LIST OF FIGURES
CHAPTER ONE: INTRODUCTION
Physics, chemistry, biology, and environmental science are the main STEM areas in which high school students are required to take courses and consequently shape their views of STEM as a whole. Chemistry is a core STEM topic that many students shy away from because of the assumed level of difficulty in the current way it is taught (Johnstone, 1997). One of the barriers to change is the requirement of a cumulative exam to pass on to the next grade level or course (Bishop et al., 2001). These exams, including those in chemistry, include static images of atoms and molecules that students must interpret to answer the questions. In North Carolina, Virginia, and New York, approximately one-third of the chemistry end-of-course exam assesses knowledge of atomic/molecular structure and
behavior (e.g. NCDPI, 2010). Due to the prevalence of this topic, much time and attention in the classroom is spent on atoms and molecules, but mostly from the perspective of
mathematical algorithms (e.g. PV=nRT) (Habraken, 2004). Habraken asserts that this ”convey[s] a false and long-since abandoned conception of chemistry in chemistry classrooms” (p.93).
The Nature of Chemistry
According to Oversby (2000), “the discipline of chemistry occupies a special place in science since few of the macroscopic observations can be understood without recourse to sub-microscopic representation or models” (p.227). This presents a problem for researchers and students in the classroom because atoms are on the picometer (1 x 10-12 m or
as “the most visual of sciences” (Habraken, 1996, p. 193). Chemists make use of visual abstractions such as models, diagrams, and other visualizations to get a sense of the structure and components of atoms that cannot be seen, such as the Fischer Projection (see Figure 1.1). Most of the methods used in teaching chemistry, the verbal and mathematical, require some degree of abstract thinking, which is difficult for many students (Habraken, 1996). Habraken (2004) argues that the visual-spatial abilities of most students who regularly use computers suggest the need for us to re-think how we teach chemistry.
Figure 1.1. Example of Fischer Projection (Downloaded from http://en.wikipedia.org/wiki/Fischer_projection).
Chemistry has three levels of study: symbolic, macroscopic, and sub-microscopic (particulate and molecular). Students experience phenomena at the macroscopic level (e.g. watching water condense on the outside of a cold glass) and tend to apply those
the phenomena” (Williamson & Abraham, 1995, p. 530). Despite the ability of students to potentially respond correctly to questions without a deep understanding, these experiences represent discreet knowledge that students are not able to transfer to new problems and therefore, become sources of misconceptions. For example, students may be able to pick from a set of multiple choice responses that molecules break apart when water boils but in their minds, molecules ‘breaking apart’ means that they separate into atoms instead of individual molecules. It is not until students go beyond the particulate nature of matter and truly understand atomic-molecular theory that they gain the capacity for “deep and satisfying answers to key questions that we all ask about the world around us” (Smith, Wiser,
Anderson, & Krajcik, 2006, p. 11).
learn, through experience, that it is due to the structure of the atomic bonds in the metal. Many researchers (e.g. Garnett, Garnett, & Hackling, 1995; Griffiths & Preston, 1992) have worked to compile a list of common misconceptions related to atoms and
molecules. Examples of these misconceptions are: “atoms are large enough to be seen under a microscope, molecules within a phase move at the same speed, and matter is continuous and there is no vacuum or space between them” (Garnett et al., 1995, p. 73) The depth and breadth of these lists is such that “one may expect to find significant variability in students’ ideas about matter even within the same grade level” (Talanquer, 2009, p. 2126). These findings about the nature and number of misconceptions indicate the need to address a set of key foundational conceptions that are needed to understand most physical science topics taught in later grades.
To demonstrate the difficulty of abstract thinking in students, Margel, Eylon, and Scherz (2008) completed a longitudinal study of grade 7-9 students’ conceptions of the structure of materials, over a three year period. The curriculum they used introduced the macroscopic view of materials and then proceeded to “spiral” down to the particulate view, and finally the molecular view. Most students in the United States and abroad learn about materials in a similar fashion. The study found that over the three year period, only 23% of students retained a molecular view of materials, acquired through the curriculum
students draw their conception of materials is a promising avenue for assessing their understanding.
Learner-Generated Drawings
The value of drawing, as a vehicle for learning, has been explored by a few researchers such as Van Meter and Garner (2005), who have developed a theoretical
framework for learner-generated drawings. The framework is modeled after Mayer’s (1993) work with illustrations and textbook design, both frameworks focus on the selection,
organization, and integration of aspects of representation. Learner-generated drawings are defined as “pictorial representations (a) that are intentionally constructed to meet a learning goal, (b) that are meant to depict represented objects accurately and, (c) for which the learner is primarily responsible for construction and/or final appearance” (Van Meter & Garner, 2005, p. 290). Thus, drawing is a process that is meant to aid students in the representation of “invisible” phenomena and convey information to student and teacher that may not be apparent without the drawing (Van Meter, Aleksic, Schwartz, & Garner, 2006).
Van Meter et al. (2006) have had varying degrees of success with students who participated in drawing interventions, based on the amount of support provided to the students. In a recent study, Van Meter et al. (2006) compared knowledge gains of students who received different levels of support ranging from simply drawing from the text to
reveal that a constraint mechanism, in the form of support, is needed to “guide
comprehension and constrain understanding” (Van Meter et al., 2006, p. 160). Regardless of the support provided, though, empirical evidence supports the notion that drawing by hand helps students with the creation of a mental model (Van Meter & Garner, 2005).
Mental models are the internal representations of a student’s ideas (Vosniadou, 1994). Researchers (e.g. Harrison & Treagust, 2000; Van Meter et al., 2006) have used drawing to help students express these mental models. Although, we cannot precisely assess their mental models (Harrison & Treagust, 2000), the drawings give us an idea of the students’ conceptions and alternative conceptions, what Vosniadou (1994) called “synthetic mental models” (p.50). Drawings also provide us with an external representation, which can also be considered a visualization. According to Scheiter, Wiebe, and Holsanova (2009, pp. 68-69) “visualizations are a specific form of external representation that are intended to
communicate information by using a visuo-spatial layout of this information and that are processed in the visual sensory system”. Visualizations cover a wide range of
representations, from 2-dimensional (2-D) and 3-dimensional (3-D) to static and dynamic, and can be used to communicate a wide range of ideas in many different ways.
Creating Visualizations
and with enjoyment. Many studies have found that computer software improves student understanding and visualization skills (e.g. Sanger & Badger, 2001; Williamson & Abraham, 1995; Wu, Krajcik, & Soloway, 2001). However, the focus of most research studies deals with computerized visualizations that the students either view or interact with, and to date, little is known about student learning with learner-generated computer visualizations. Only in the last two years have we seen studies begin to make use of learner-generated animations.
Digital animations have been used recently in studies by Chang, Quintana, and Krajcik (2010) and Hoban, Loughran and Nielsen (2011). Chang et al. (2010) studied how the steps of the modeling process (design, interpret and evaluate) affected middle-school student learning as students used Chemation on Palms to create three animations. They found that students performed best when using all three steps. Hoban et al. (2011) used Slowmation with preservice teachers to document how these teachers represent their
understanding of science concepts. They called for research into “simpler ways for learners such as preservice teacher to make [these animations]” (p. 990). However, both studies have students combining already created elements in the production of their learner-generated animations.
A variety of other tools exist to aid students in the creation of visualizations. Barnea and Dori (1999) used Computerized Molecular Modeling (CMM) allowing students to try out different 3-D configurations and make calculations such as bond energy. Wu, Krajcik, and Soloway (2001) used eChem to help students manipulate 3-D molecular models and observe characteristics at the microscopic and macroscopic levels. Many of the Career and Technical Education courses, such as the one that will be used in this study, use other forms of
package being used, computers can add a type of scaffold, such as the order in which students must add elements, for student learning and explanation through features in the software (Linn & Hsi, 2000). However, computer use alone does not guarantee student understanding. It is important to select the “appropriate computer [software] tool with students’ [having] high competency in its usage” (Hsieh & Cifuentes, 2006, p. 138).
Visualizations are an important tool in education because they illustrate phenomena that cannot be observed (Buckley, 2000) and are connected to how we think as evidenced by information processing theory (Wickens, 2002). Most of the visualizations students
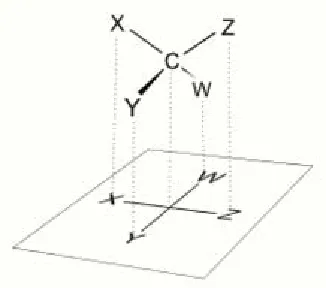
Visualizations may come in different forms. They may be 2-D or 3-D and either static or dynamic. Two-dimensional (2-D) visualizations have length and width and appear to be on the same plane as the computer screen, textbook, or paper. Three-dimensional (3-D) visualizations add depth and appear to be coming out of the computer or paper. Static
visualizations are those that do not move, such as textbook pictures. Dynamic visualizations are those that move, similar to animations in video games. Both 2-D and 3-D visualizations have the option of being static or dynamic. Hoffler and Leutner (2007) conducted a meta-analysis of educational uses of both static and dynamic visualizations and found animations to have more advantages. Other studies by Williamson and Abraham (1995) and Chang et al. (2010) investigated specifically the animation of molecules in different treatments. Findings were inconclusive; therefore it is still unclear if there is a specific approach that is
particularly efficacious.
Scientific Visualization
communicate technical and scientific information to a variety of audiences. Graphic design principles, along with 2-D and 3-D graphical techniques, are used to represent both
empirically and theoretically derived data in visualizations” (p. 40).
Consensus visualizations
Not only does the Sci Vis curriculum lend itself to the creation of visualizations by providing students with expertise in computer software, but it also provides a forum for discussion. The course is designed for students to work both independently and in groups. Group work or collaborative learning is a technique used by in many classrooms and described most prominently with Vygotsky’s (1978) zone of proximal development. Essentially, students at higher levels are able to guide or assist students at lower levels. When applied to visualizations, the product is a consensus model. Schwarz et al. (2009) found that as students worked together to create a consensus model, usually a pen/paper drawing, they “moved from unprincipled decisions about changes in their models to using criteria of accuracy and explanatory value” (p. 648). Thus, group work centered on the development of a visualization enhanced student reasoning.
Research Questions
al., 2001) but no clear answers to many pressing questions about instructional practices that best address these misconceptions. Visualizations generated by curriculum developers have long been used to aid student learning, either through simply viewing or using ready-made objects to construct (Wu & Shah, 2004). Thus, this proposed research will evaluate the strategies in a wider context and as an agent for conceptual change.
The research questions pertaining to this study are:
1. Do student-generated computer animations enhance student conceptual understanding as suggested by Van Meter and Garner’s (2005) Generative Theory of Drawing Construction (GTDC)?
2. To what extent do student-generated animations relate to elements in the phase change learning progression and/or the provided text?
3. Does the process of students generating animations affect specific misconceptions?
Summary
In this chapter, I describe the use of visualizations in chemistry, a topic with particulate and molecular properties. In the chapter that follows, Chapter 2, the literature concerning learner-generated drawings and learning progressions is reviewed. Chapter 3 details the methods used to conduct and analyze the study. Finally, Chapter 4, formatted as a publication-ready manuscript, describes the findings and conclusions of this study.
Chapter 4, entitled “Do student-generated digital animations enhance student progress along a phase change learning progression? A study of 35 students in six Scientific
CHAPTER TWO: REVIEW OF THE LITERATURE
The study of chemistry is built on a foundation of atomic and molecular behavior. Because of this, the field makes use of abstractions in the form of visualizations to represent this atomic and molecular behavior. What is represented in these visualizations is based on indirect measures made with instrumentation (including the human senses). Most of the experiences students have had with science are macroscopic—that is, what they experience and measure is what happens at the scale the human eye can see. For example, they watch as a chemical reaction causes bubbles or a color change. Students have trouble making
connections between those macroscopic observations and the underlying microscopic mechanisms (e.g. Wu, 2003). To compound the problem, students have trouble correctly conceptualizing the scale of an atom and the molecules involved in chemical processes (e.g. Tretter et al., 2006).
Teachers use many different pedagogical strategies to help students enhance their conceptual understanding of atomic-molecular theory (Stevens et al., 2010). These strategies cover the range of modeling, drawing, and static and dynamic visualization. Wu and Shah (2004) reviewed many different types of these strategies and tools including concrete models, animation, computer-based construction and multimedia tools, and integrated learning
Conceptual Change Model
Misconceptions, on a variety of topics, are prevalent among students. Chi (2005) asserts that misconceptions can either be fragmented or coherent. diSessa (1988) defines fragmented misconceptions as “a set of loosely connected and reinforcing ideas” (p. 52). According to Chi, “a coherent view claims that misconceptions are not merely inaccurate or incomplete isolated pieces of knowledge (with respect to the correct scientific conceptions), but rather, they can be portrayed as alternative conceptions” (p. 162). Driver et al. (1994) describe how “young people have a range of knowledge schemes that are drawn on to interpret the phenomena they encounter in their daily lives. These are strongly supported by personal experience and socialization into a ‘commonsense’ view” (p. 7). Therefore, taken together, these researchers indicate that students’ conceptions or misconceptions are
primarily created from personal experiences and individualized.
In contrast to conceptions or misconceptions based on daily experiences, Nakiboglu (2003) suggests that “misconceptions pertaining to some chemical phenomena… are
fundamentally different because the existence of atoms and molecules are not directly within the realm of everyday experience” (p. 171). Indeed, science teachers, and particularly
8.1 An atom resembles a sphere with components inside. 8.2 An atom resembles a solid sphere
8.3 An atom looks like several dots/circles 8.4 Electrons move in orbits
8.5 Atoms are flat
8.6 Matter exists between atoms
9.1 Atoms are large enough to be seen under a microscope 9.2 Atoms are larger than molecules
9.3 All atoms are the same size
9.4 The size of an atom is determined primarily by the number of protons 9.5 Heat may result in a change of atomic size
10.1 All atoms have the same weight 11.1 All atoms are alive
11.2 Only some atoms are alive
11.3 Atoms are alive because they move
Conceptual change model (CCM) was proposed by Strike & Posner (1985) as a way to theorize how to help students overcome their misconceptions. According to the CCM, in order to change their initial conceptions, learners must “judge a competing conception to be more intelligible, plausible, and fruitful than alternative in order for the new conception to be used in place of the old” (Demastes, Good, & Peebles, 1996, p. 408). A final step of CCM is that the learner accepts the new conception. Slotta and Chi (2006) describe conceptual change as “a matter of developing new conceptualizations alongside existing ones and understanding how and when to differentiate between alternatives” (p. 266). Later, Strike and Posner (1992) expanded their notions of CCM by suggesting that learners’ value of the subject matter and motivation were important considerations, as well, describing a
conceptual ecology to include additional contextual aspects. Although Strike and Posner assert that CCM was not intended to be a comprehensive learning theory, its use has been instrumental in developing studies to gain more understanding of how students learn subjects, such as chemistry concepts, when they are at odds with initial conceptions.
Learning Progressions
What is a learning progression?
Learning progressions (LPs) are a way to look at how students develop more
student understanding of specific scientific content, specifically the particulate nature of matter. Most learning progressions in science education are similar in that they deal with specific content. In contrast, Schwarz et al., (2009) use a learning progression to track the
scientific process of modeling. These two learning progressions complement each other because they can both be used to guide the same activity but track different but equally important aspects of scientific ways of knowing. They can help students progress through the levels to achieve a greater understanding (Baroody, Cibulskis, Lai, & Li, 2004).
Learning progression is a general term covering many ideas. A learning progression may be either hypothetical (HLP) or empirical (EP). Both learning progressions used in this study are hypothetical in that they are based mostly on logic and current research in the area. There has been some but not extensive empirical testing. An empirical learning progression typically has been extensively refined through several assessment tasks and there has not been enough research to fully flesh out progressions in science. Learning progressions are also made up of smaller steps called trajectories. Learning trajectories may also be
hypothetical (HLT) or empirical and address much more specific content than the “big ideas” of the overall progression (Stevens, Shin, & Krajcik, 2009). For example, a learning
progression may deal with students perceptions of phase change, and within it, a learning trajectory describes how students move from “matter made up of molecules” to “particles are atoms and molecules” (Stevens et al., 2010).
students are rarely asked to engage in thinking about phenomena, such as the movement of molecules as water boils. Duschl, Schweingruber, & Shouse (2007) assert that we have failed to “systematically develop students’ epistemological understanding of the nature of models and theories” (p.102). Learning progressions seek to uncover the linkages that help students better understand, organize curricula and standards around those linkages and
encourage students’ metacognitive skills that will help them gain a more fully developed way of thinking. For example, it can enhance student learning if students learn about particles before specifying atoms and molecules (Marbach-Ad, Rotbain, & Stavy, 2008).
Characteristics of a Learning Progression
Every learning progression is developed differently. The escalated approach has a specific set of anchors that define the upper and lower levels of the progression backed by empirical evidence. The landscape approach is a series of levels and threads that are founded on previous research (Salinas, 2009). The variation approach is a newer, less used approach based on phenomenography and contains a hierarchical set of experiences of increasing understanding (Park, Light, Swarat, & Drane, 2009). The escalated approach is the evidence-centered assessment design (Mislevy & Riconscente, 2005) while the landscape approach is the learning-goal-driven design (Krajcik, McNeill, & Reiser, 2007). The escalated and landscape approaches are two relevant examples under design-based research (Collins, Joseph, & Bielaczyc, 2004). While the escalated approach has been the most used thus far, researchers are constantly constructing new ways to develop and validate their learning progressions.
hypothetical learning trajectories as “the learning goal, the learning activities, and the thinking and learning in which the students might engage” (p.133). Clements and Sarama (2004) believe that the value of learning progressions over learning sequences and other approaches is the interconnection between psychological developmental progressions and instructional sequences. Learning trajectories grew out of combinations of information-processing theory, constructivism, and cognitive theory but have become less linear and ladder-like with a wider and deeper range of sources for development (Baroody et al., 2004).
Atomic-Molecular Theory Learning Progression
Smith et al. (2006) describe a learning progression detailing specifically how conceptual understanding of atomic and molecular level phenomena are linked through progression of conceptual development. A progression of conceptual understandings around atomic-molecular theory includes related misconceptions that can be understood as either intermediate developments along the progression or deviations from the progression that impede movement along the progression.
This learning progression is developed for grades K-8 and organized around three key questions and six big ideas. One set of the big ideas (1-3) are centered on matter and its properties. The second set (1AM-3AM) discuss the atomic-molecular theory of matter, which is not introduced until middle school or high school. Each big idea is elaborated on further and supported with learning performances and assessment suggestions. They are (Smith et al., 2006, pp. 12-13):
a. 1. Matter and material kinds. Objects are constituted of matter, which exists as many different material kinds. Objects have properties that can be measured and depend on the amount of matter and on the material kinds they are made of.
b. 1AM. Atomic-molecular account of matter and material kinds. All matter on earth is made of a limited number of different kinds of atoms (a little over 100 have now been identified), which are commonly bonded together in molecules and networks. Each atom takes up space, has mass, and is in constant motion. The mass, weight, and volume of objects and the properties of materials are determined by the nature, arrangement, and motion of the atoms and molecules of which they are made.
2.) What changes and what stays the same?
a. 2. Conservation and transformation of matter and material kinds. Matter can be transformed, but not created or destroyed, through physical and chemical processes.
molecules change arrangement and/or motion but remain intact, so the chemical substance remains the same.
3.) And how do we know?
a. 3. Epistemology. We can learn about the world through measurement, modeling, and argument.
b. 3AM. Epistemology of the atomic-molecular theory. Atoms are too small to be seen directly with tools available in classrooms. The properties of and changes in atoms and molecules have to be distinguished from the macroscopic properties and phenomena for which they account. We learn about the properties of atoms and molecules indirectly, using hypothetico– deductive reasoning.
Table 2.1
Science content defined between the upper and lower anchors for the hypothetical learning
progression for atomic structure (Stevens et al., 2010, p. 692).
Atomic Structure
Atoms are made up of electrons, neutrons, and protons
Protons are positively charged, electrons negatively charged and neutrons are neutral Protons and neutrons are of similar mass, but electrons have a much smaller mass
The number of protons defines the type of element and is the atomic number on the Periodic Table
Neutral atoms of the same type (element) have the same number of protons and electrons, but not necessarily the same number of neutrons
Different numbers of neutrons for a given number of protons creates different isotopes of the same element The nucleus takes up only a very small percentage of the volume of an atom, but makes up the vast majority of the atomic mass
The electrons are distributed in ‘‘shells’’ that surround the nucleus. These shells represent energy levels (n) The outer shell of electrons is different than the inner shells of electrons. The inner shells plus the nucleus make up the atomic core
The configuration of the outermost electrons determines how an atom can interact with other atoms Each shell (or level) of an atom contains a certain number of orbitals (e.g., 1–1s; 2–2s, 2px, 2py, 2pz) Electron distribution within an atom cannot be predicted well by the solar system model; electrons are better
described by the electron cloud model, which describes the electron probability density Electrons exhibit particulate and wavelike behavior
The position and momentum of an electron cannot be determined simultaneously (Heisenberg’s Uncertainty Principle)
Energy changes in isolated atoms (or molecules and other confined systems) can only occur in certain defined (quantized) amounts
In building their learning progression, Stevens et al. (2010) use a construct-centered design (CCD) process (Krajcik, Shin, Stevens, & Short, 2009) which combines the two approaches mentioned previously. In this process, once the anchors have been established by researchers/developers, the claims, evidence and tasks were assembled. They are defined as: “a) a claim describes the knowledge, skills, or other attributes to be assessed or learned; b) the evidence describes what behaviors or performances are needed to support the claim; and c) tasks [are] situations that will elicit those behaviors or help students develop the
knowledge to provide the desired evidence” (Stevens et al., 2010, p. 692). This study will make use of the anchors and levels for atomic structure (see Table 2.1) and phase change (Stevens et al., 2010).
Learning progressions are an innovative approach to teaching about atomic-molecular theory. Most students are subjected to a list of facts or “rhetoric of conclusions” that they are expected to memorize and regurgitate for a test (Duschl et al., 2007). Duschl et al. assert that when students are exposed to experiments dealing with atoms and molecules, they are seen as “little pieces of materials that inherit all of their macroscopic properties” and do not see them as “preexisting entities with distinct properties and characteristics” (p.102). As such, learning progressions seek to engage students in true model-based scientific reasoning.
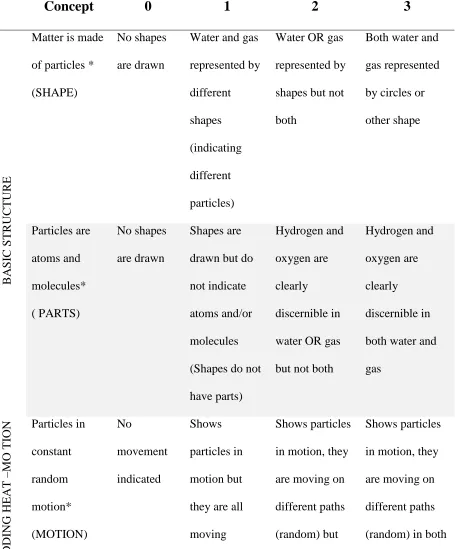
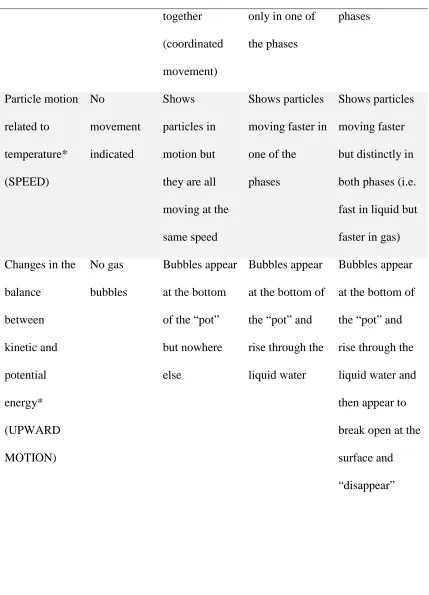
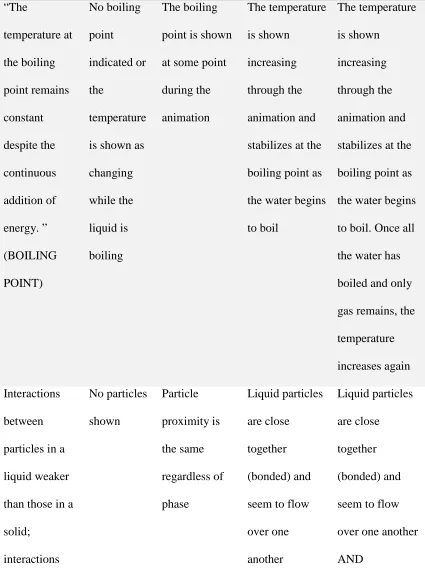
During the development of their learning progression Stevens et al. (2010) asked students “to draw their model of an atom and explain it” (p. 693). The study undertaken in this dissertation research recreated this task with a molecule of water. The task was then extended to a model of water boiling at the sub-microscopic scale in accordance with Stevens et al. suggestion to use models to help students connect macroscopic and sub-microscopic phenomena. This instructional strategy represents only a portion of what could be considered a learning trajectory, in that the goal, in accordance with the work of Stevens et al., is to help students progress up a level while making connections to prior and future learning within a narrow set of learning goals.
Using learning progressions to inform practice
The National Research Council’s (2007) report Taking Science to School includes an entire chapter on learning progressions in the hopes that they will one day help link content and assessment. Alonzo (2010) furthers this discussion by examining three major
considerations in linking learning progressions to assessment, the third of which involves the validation of learning progressions. Many different methods are being used by science education researchers to develop learning progressions and there is not a standard in this development or even in the language used. In light of this, Alonzo charges researchers to set attainable goals for students and create well-designed instruction to further the development of learning progressions linked to assessment.
Generative Theory of Drawing Construction
research that focuses on students creating their own visualizations. This drawing approach adds greater structure to the model creation process and a different option for assessment of student products. A learning progression provides overarching goals for student learning; the theory of learner-generated drawing provides insight into the role student drawing (e.g., modeling) plays in learning.
Learner-generated drawings are student created visualizations that are meant to look like the object (or idea) that they represent (Van Meter & Garner, 2005). It is a strategic process “because drawing is goal-oriented, improves knowledge organization, and can improve learning outcomes” (Van Meter et al., 2006, p. 143). Furthermore, drawing has the potential of integrating verbal and nonverbal representations because the drawing can be done in response to written text (Van Meter & Garner, 2005). The benefits of using drawing as opposed to exclusively written or verbal methods lies in a human’s capacity for pictorial memory. According to Paivio’s (1986) dual coding theory, pictures “yield a perceptual code and a verbal code in memory, which doubles the chances of retrieval” (Sawyer, 2006, p. 284). Therefore, it seems logical that student creation of drawings will improve student understanding of the selected topic.
common human-scale experiences (e.g. a precipitate falling out of solution) and may well extend to developing common understandings around invisible processes at the atomic scale.
The generative theory of drawing construction is an extension of Mayer’s Generative Theory of Textbook Design (Mayer & Sims, 1994; Mayer et al., 1995). The GTTD discusses the relationship between illustrations in textbooks and the corresponding text. Mayer et al. found that students received higher scores when illustrations were accompanied by text in close proximity. The GTTD discusses that it is the selection of words/images, organization of words/images and finally, the integration of words/images that help students gain
information from illustrations in their textbooks. In a similar way, learner-generated drawing supports student learning in three ways (Van Meter et al., 2006): “1) constrain the
construction of drawings; 2) prompt checking the accuracy of constructed drawings; 3) and/or direct learners’ attention to key elements and the relationships amongst these” (p. 148).
The generative theory of drawing construction is similar to the process of modeling. Both modeling and drawing encourage students to create visualizations of a specific topic, assess and redesign that visualization, and pay close attention to details of the visualization. In other words, both processes have an imbedded cycle of reflecting about the thinking going into the visualization which modeling experts call meta-modeling (Schwarz & White, 2005).
author-provided organizers and found in their first experiment that neither group produced significant gain scores. The two variations of Experiment 1 showed that author-provided organizers facilitated more learning. The possible explanation was that the generative process may be confusing and create extraneous cognitive load.
To combat the confusion and overburden that can potentially occur due to the generative process, Van Meter and Garner (2005) purposefully reviewed 30 articles (15 on classroom application and 15 dealing with empirical research). Their goal was to identify ideal characteristics to create a best practices framework for incorporating drawing in the classroom. They state, “when drawing, a learner must select to-be-represented elements and organize them into a symbolic verbal representation” (p. 315). This leads to three cognitive processes that Van Meter and Garner (2005) adapted from Mayer’s Generative Theory of Textbook Design (e.g. Mayer et al., 1995); selection, organization, and integration.
Elements of Learner-Generated Drawings
Selection determines what elements are chosen from the text, such as molecules, steam or a pot. If an illustration is also provided, these elements then become the focus of inspection of the illustration. For instance, a selection of text may be accompanied by an illustration of a pot with water molecules and arrows indicating movement. Then, “inspection of the illustration may, in turn, cause the learner to notice something important…which leads to closer inspection of the text and, possibly, the selection of
(e.g. steam, ice, bubbles) from the demonstration were analyzed for frequency among student visualizations (see Table 2.2).
Table 2.2
Characteristics of Water Boiling Drawings – Frequency (%) of appearance in Paper (P)
versus Computer Drawings (C) (Albert & Wiebe, 2011)
Macroscopic Characteristics
% P vs. % C
Molecular Shape
% P vs. % C
Other Characteristics
% P vs. % C
Beaker 100 / 70 Circles 40 / 83
Macro/micro overlapping
28 / 62
Hot plate 91 / 16 Space-fill 25 / 33 Movement 40 / 54
Water 100 / 66 Lewis 5 / 0 Labels 62 / 95
Steam 85 / 37
Ball and Stick
20 / 25
Level of H2O Changed
14 / 0
Ice 5 / 37 Ions 2 / 0
Magnifier 80 / 33 Microscope 5 / 20
Bubbles 74 / 37
Scale 5 / 54
internal verbal elements are organized into a coherent representation. This representation then serves as the foundation for constructing the internal nonverbal representation” (Van Meter & Garner, 2005, p. 317). The process is not necessarily linear and, depending on the skill and knowledge of the student, this can force the student to go back and forth between the verbal and nonverbal or even the original text (Van Meter & Garner, 2005).
Finally, integration brings all the pieces together. “[A]s the organized verbal
representation is used to construct the nonverbal representation, these two representations are necessarily integrated” (Van Meter & Garner, 2005, p. 318). It is this overlap that may make learner-generated drawing a successful strategy. If inconsistencies arise in either the text or illustrations, there is a back-up to clear up any confusion which leads to drawing accuracy and knowledge gains (Van Meter & Garner, 2005).
Drawing vs. Constructing
look like, and how they are best incorporated together. It means that the student is less supported in the production of the project but also given more room to discover and learn.
In conclusion, learner-generated drawings are a promising avenue for helping
students gain knowledge from text and illustrations. The steps overlap those of the modeling process and have a built in meta-cognitive element that forces students to reflect on what they are thinking and doing. However, the drawing process must be properly supported to create constraints on the drawing construction that will enable the process to be efficient and effective. Similarly, the knowledge gains must be assessed using higher-order assessments to reveal the deep, predictive nature of the knowledge gains (Van Meter & Garner, 2005). These needs have been explored and addressed in research and the proposed study.
Scientific Visualization
the purpose of this paper, the term visualization will be used generally and without categories.
The ability to create, manipulate, and explore visualizations in one’s mind is a valuable skill. Psychology refers to this skill as spatial ability and research has found high correlations between this skill and achievement among college chemistry students (e.g. Carter, LaRussa, & Bodner, 1987; Pribyl & Bodner, 1987). In fact, spatial relation is one of the many factors that sets visual representations apart from verbal representations (Scheiter et al., 2009). Beyond its importance in achievement, spatial ability has been linked to other cognitive abilities such as logical reasoning. It is a way for students “to consolidate and clarify ideas…[and] an important memory strategy” (Baker & Pilburn, 1997, p. 178). Finally, spatial skills are another avenue to help students to solve problems. Schools
traditionally teach the analytical, linear method for solving problems and shy away from the more holistic paths that make use of spatial skills (Baker & Pilburn, 1997). And since spatial ability seems to be such a strong component of science and helpful in problem solving, it makes sense that it be a skill that is fostered in schools (Bodner & McMillen, 1986; Zhang, 1997).
A large body of research exists that tries to explain how we process visualizations. According to Paivio’s (1986) dual-coding theory, pictorial and verbal information are coded differently by the brain. Visualizations exploit the perceptual-motor system and are unique in that they “partake of perceptual processes and experiences” (Schwartz & Heiser, 2006, p. 283). In fact, Scheutz (1999) states that they cannot exist without the “individuals for whom they are ‘meaningful’” (p. 35). But the value of visualizations goes beyond the unique
found that people will recognize pictures from an original set of 10,000 at a rate of 83% when presented with both new and original pictures. So not only do pictures remain in memory and are easily recalled, but there are also other advantages to visualizations. Gilbert (2005) suggests that “’metacognition in respect of visualization’ be referred to as
‘metavisualization’” (p. 15) and that, as suggested above, it is a skill necessary for all.
Visualizations are used in education in a variety of formats. Pozzer and Roth (2003) suggest that “representations [i.e., visualizations] lie on a continuum depending on the
amount of contextual detail that they carry in the background of the central object proper” (p. 1092) where photographs have less abstraction and more details, and graphs and tables have more abstraction and less detail. Pozzer and Roth (2003) analyzed what students really get out of photographs in textbooks and found that it depends on how those photographs are situated and the information provided with those photographs. They also found that textbook authors do not necessarily keep these in mind nor do they have the same format throughout an entire textbook. Niaz (1998) did a specific study on how different structures of the atom were used in chemistry textbooks. Her findings re-confirmed an earlier study by Schwab (1974) showing that textbooks ignore “heuristic principles” and focus on the experimental details of the models. Mayer, Steinhoff, Bower, and Mars (1995) address these issues and more in their Generative Theory of Textbook Design.
Chemistry Models
Science classrooms, especially chemistry classes, make extensive use of
important. The term ‘model’ is used to describe a variety of objects and has no true agreed upon definition. Halloun (2006) presents a sample list of definitions used throughout the last two decades but it is clear there is not a consensus. For the purposes of this work, only analogical and mental models will be discussed. Harrison and Treagust (1996) define
analogical models as those that “have one or more of the target’s attributes represented in the analog’s concrete structure” (p. 512). These are the models shown to and produced by students (a drawing of a water molecule). Vosniadou (1994) defines mental models as those that “refer to a special kind of mental representation, an analog representation, which
individuals generate during cognitive functioning” (p.48). These are the models that the students first create in their minds and then use to create the analogical models on paper or computer. Furthermore, models are distinct from other visualization in their purpose. As Schwarz et al. (2009) point out, the true power behind models are their ability to help students predict, explain, and create dynamic knowledge. Gilbert (1993) suggests that models are an important tool for teaching and learning, yet Harrison and Treagust (2000) caution that using models is not without significant problems. These problems stem from the inability to predict how students will interpret models and their ability to learn the modeling language. Therefore, they “argue that teachers should teach modeling skills, encourage students to use multiple rather than isolated analogical models, and take the time to discuss and critique the models used in class” (p. 353).
that students think about models and the modeling process. This analysis is also incorporated into the learning progression developed by Schwarz et al. (2009). Essentially, the goal of using models and modeling in science is to not only help students learn concepts but to also spark creative thinking using an important tool of science.
Models in the classroom can either be 2-D or 3-D. Physical 2-D models are typically anything drawn or printed on paper or stock, projecting either two or three dimensions of the represented object, while 2-D computer modeling software works on a similar “virtual paper surface”. 3-D physical models are, as stated, three physical dimensions while 3-D computer models allow you to construct in all three dimensions (virtually) but are still projected in only two dimensions. Harrison and Treagust (2000) explored the use of modeling throughout the year in a chemistry class. The majority of the models created by the case study student were 2-D paper-based static drawings of atoms and molecules (with limited use of a modeling kit being the expectation). Over the course of the year, the student developed into a level 2/3 modeler (using Grosslight et al. (1991) terminology) with only a few remaining
misconceptions about the structure of the atom, and the ability to use models to predict certain properties. Although 2-D paper-based static drawings have been shown to be useful ways for students to express models, the advent of computers has created a shift towards 3-D computer modeling software. Wu, Krajcik, and Soloway (2001) reported on the use of
manipulate or simply watched a demonstration of these models, it increased their spatial abilities.
Static vs. dynamic
In addition to models, other visualizations in 2-D and 3-D—both static and dynamic—are prevalent in science classrooms. They come in textbooks, PowerPoint presentations, overhead transparencies, and videos and computer software. Hoffler and Leutner (2007) conducted a meta-analysis of 26 studies comparing static and dynamic visualizations. They compiled a list of situations when dynamic visualizations may be better than static to enhance student learning and vice-versa. In a study by Tversky, Morrison, and Betrancourt (2002), animation was not necessarily a better media in all cases, a study by Hegarty (2004) determined that dynamic visualization was better in some cases. Marbach-ad, Rotbain and Stavy (2008) took the question a step further and tested the effectiveness of computer animation and illustration for learning about molecular genetics. They found that the computer animation better aided students in understanding the dynamic processes. Therefore, it stands to reason that computer animation may be useful in enhancing student understanding of other dynamic, molecular processes.
Scientific and Technical Visualization Course
CAD and 3-D modeling, in combination with the latest computer software (Wiebe & Clark, 1998). The North Carolina Department of Public Instruction (2010) website describes the course as providing
students with advanced skills in the use of complex visualization tools for the study of mathematical and/or science concepts. Students design and develop increasingly complex data and concept driven visualization models. Focusing on scientific and technical concepts, students learn how to communicate and analyze phenomena using statistical, graphic, and conceptual visualization computer applications.
Communication, computer, technical, mathematics, and science skills are reinforced in this course.
Essentially, it is a course meant to enhance the mathematics and science content knowledge students receive in their core courses and help them apply it through the creation of graphs, 2-D static, 3-D static and dynamic visualizations. The course has three levels with each level consisting of more complex and independent work. In level I, students hone basic skills using both 2-D and 3-D software by completing independent projects. At level II, students have had enough exposure to the 3-D software to create visualization with a reasonable level of complexity of form and motion without the software becoming a factor. The focus of this study is Sci Vis I and II. The Sci Vis curriculum usually has a biology, physics and earth science project, but rarely a chemistry unit. This study will create a chemistry unit based on the boiling of water, potentially to be used in the curriculum in the future.
compatibility of learner-generated drawing principles and modeling processes with the computer media.
Summary
In this chapter, three areas of research were outlined: Learning progressions,
CHAPTER THREE: METHODOLOGY
This study is a quasi-experimental, mixed-method design. The focus of the study was student generation of visualizations to learn about atomic and molecular concepts.
Therefore, the research took place in the classrooms of two teachers teaching Sci Vis I and II. The research questions guiding this study were:
Research Questions
1. Do student-generated computer animations enhance student conceptual understanding as suggested by Van Meter and Garner’s (2005) Generative Theory of Drawing Construction (GTDC)?
2. To what extent do student-generated animations relate to elements in the phase change learning progression and/or the provided text?
3. Does the process of students generating animations affect specific misconceptions?
Setting
develop their understanding of these software programs through the production of animations and multiple representation projects. These courses were chosen to help control for
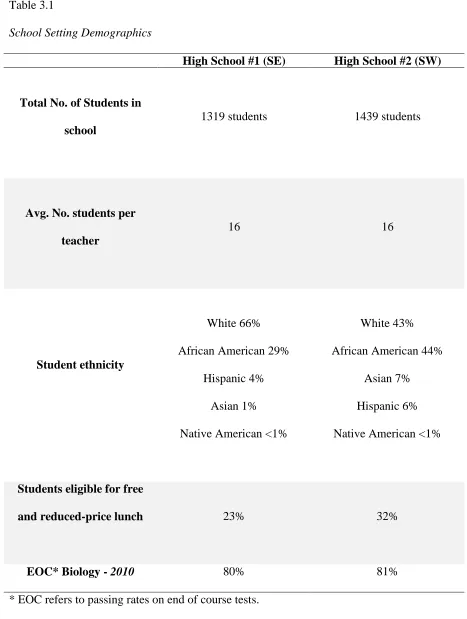
Table 3.1
School Setting Demographics
High School #1 (SE) High School #2 (SW)
Total No. of Students in school
1319 students 1439 students
Avg. No. students per teacher
16 16
Student ethnicity
White 66% African American 29%
Hispanic 4% Asian 1% Native American <1%
White 43% African American 44%
Asian 7% Hispanic 6% Native American <1%
Students eligible for free
and reduced-price lunch 23% 32%
EOC* Biology - 2010 80% 81%
Participants
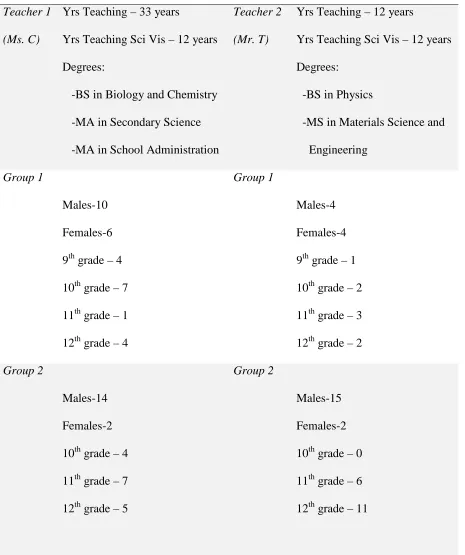
Table 3.2
Description of Participants*
Teacher 1
(Ms. C)
Yrs Teaching – 33 years
Yrs Teaching Sci Vis – 12 years Degrees:
-BS in Biology and Chemistry -MA in Secondary Science -MA in School Administration
Teacher 2
(Mr. T)
Yrs Teaching – 12 years
Yrs Teaching Sci Vis – 12 years Degrees:
-BS in Physics
-MS in Materials Science and Engineering
Group 1
Males-10 Females-6 9th grade – 4 10th grade – 7 11th grade – 1 12th grade – 4
Group 1
Males-4 Females-4 9th grade – 1 10th grade – 2 11th grade – 3 12th grade – 2
Group 2
Males-14 Females-2 10th grade – 4 11th grade – 7 12th grade – 5
Group 2
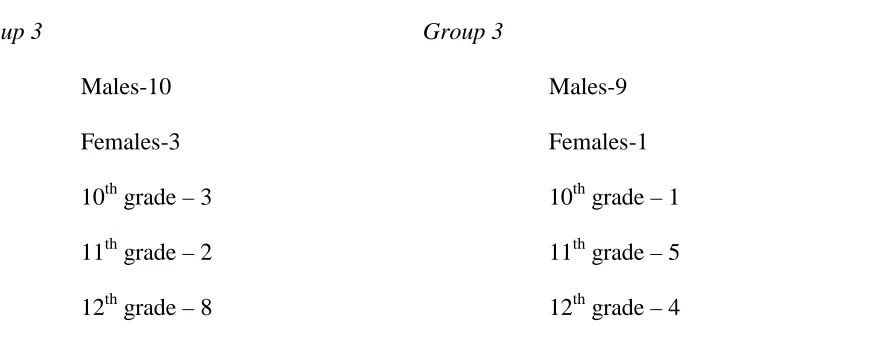
Table 3.2 Continued
Group 3
Males-10 Females-3 10th grade – 3 11th grade – 2 12th grade – 8
Group 3
Males-9 Females-1 10th grade – 1 11th grade – 5 12th grade – 4
*demographics represent the 81 students who supplied information but 94 were used for the study
Lesson Design
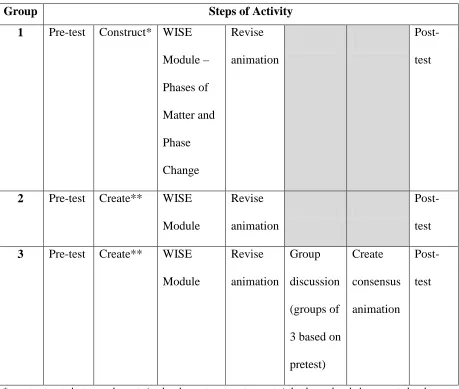
This water boiling animation activity lasted 2-3 days. The schools are on block schedule so each class period lasted 1 hour and 30 minutes in length for a total of 3 - 4.5 hours. Projects were completed individually by students and then analyzed for content and understanding. The groups proceeded as follows (see Table 3.3 for summary):
Day 1: Students received text explaining what happens as water boils at the macroscopic and molecular levels and construct/create an animation based on that text.
- Group 1 - Students began constructing a short animation using pictures (.jpg) of elements (water, molecules, pot, etc.) they were provided in a digital folder. - Group 2 - Students began creating a short animation using their own original
elements.
Day 2: Students spent 30 minutes reading through the Phases of Matter and Phase Change WISE module, watched several animations, and answered online questions. Then students were asked to complete their animations keeping in mind the animations they watched in the WISE module.
Table 3.3
Study Design
Group Steps of Activity
1 Pre-test Construct* WISE Module – Phases of Matter and Phase Change
Revise animation
Post-test
2 Pre-test Create** WISE Module
Revise animation
Post-test 3 Pre-test Create** WISE
Module
Revise animation
Group discussion (groups of 3 based on pretest)
Create consensus animation
Post-test
* construct – students use elements (molecules, pot, water, steam, etc.) that have already been created and are supplied as .jpg to put together an animation that portrays their interpretations on the important ideas from the text
Data Sources and Analyses
Pretest/Posttest. The pretest and posttest was composed of 30 multiple-choice items, 12 were drawn from Version 1 of the Particulate Nature of Matter Assessment (Yezierski & Birk, 2006), 3 from released Chemistry and Physical Science end-of-course standardized tests (NCDPI, 2010) and 15 from Smith et al.’s (2006) learning progression. This
pre/posttest had a Cronbach α of 0.65 with the sample of high school students. Test items measured students’ factual knowledge of atoms, molecules, and phase change and identify specific common misconceptions students may hold. Pretests were assessed with a one-way ANOVA to ensure that all classes were equivalent. The pre/posttests were analyzed with a repeated measures ANOVA to determine any significant gains among students and then items were separated by categories and specific misconceptions to identify differences
Table 3.4
Description of Data Sources
Data Source Description
Pre/Post Test 30 question multiple choice test Student
animation scores
Animations were scored with a rubric (Albert, Wiebe & Blanchard, 2012) based on the phase change learning progression (Stevens et al.,
2010) Student
question scores
Short answer and multiple choice questions within the WISE Module based on phase change
Student Interviews
among students.
Sample Test Questions:
A pot of water is placed on a hot stove. Small bubbles begin to appear at the bottom of the pot. The bubbles rise to the surface of the water and seem to pop or disappear. What are the bubbles made of?
A. heat
B. oxygen or hydrogen C. air
D. oxygen and hydrogen E. steam
Which of the following statements is incorrect?
A. Water molecules move at the same speed in the solid, liquid, and gaseous phases.
B. Water molecules move the fastest when they are in the gaseous phase. C. Water molecules in the solid phase vibrate.
D. Water molecules in the liquid phase move faster than molecules in the solid phase.
Student Projects. Students were given a selection of text (see selection below and Appendix D for complete text) and asked to construct/create an animation about water boiling from the description in the text.
As water boils, the water turns into steam (also known as water vapor or water gas.) You can probably watch this happen if you pay close attention when you boil your pot of water. First, the water begins to form bubbles at the bottom of the pot near the heating device. Then, the bubbles begin to rise until the bubbles begin to pop off the surface of the water and seemingly evaporate into the air. What's happening here? …As more energy goes into making those bubbles though, they will begin to be able to stand up to the outside air pressure. When they get to the point where they can stand up to the outside air pressure, you'll see massive bubbles coming off of your water, the temperature of your water will stay the same and your boiling point will be reached.