Journal of Pain Research
Dove
press
O R I G I N A L R E S E A R C H
open access to scientific and medical research
Open Access Full Text Article
Does self-perception of sensitivity to pain
correlate with actual sensitivity to experimental
pain?
Doron Meiselles1,*
Joshua Aviram2,*
Erica Suzan1
Dorit Pud2
Elon Eisenberg1,3
1The Ruth and Bruce Rappaport Faculty of Medicine, Technion – Israel Institute of Technology, 2Faculty of Social Welfare and Health Sciences, University of Haifa, 3Institute of Pain Medicine, Rambam Health Care Campus, Haifa, Israel
*These authors contributed equally to this work
Background:People often state that they are “sensitive” or “insensitive” to pain. However, the accuracy and clinical relevance of such statements is unclear.
Objective: The aim of this study was to search for associations between self-perception of sensitivity to pain and experimental pain measures, including known psychophysical inhibitory or excitatory pain paradigms.
Subjects and methods:Subjective sensitivity to pain was reported by 75 healthy participants and included three self-perceived variables: pain threshold, pain sensitivity and pain intensity in response to a hypothetical painful event (hypothetical pain intensity [HPI]). Experimental pain measures consisted of thermal pain threshold (°C), suprathreshold thermal pain intensity (Visual Analog Scale, 0–100) and the psychophysical paradigms of conditioned pain modulation (CPM) and temporal summation (TS), representing inhibitory and excitatory pain processes, respectively.
Results:No significant correlations were found between self-perceived pain threshold or pain sensitivity and any of the experimental pain measures. In contrast, the reported HPI correlated
with thermal pain threshold (r= -0.282; p= 0.014), suprathreshold thermal pain intensity
(r= 0.367; p= 0.001) and CPM (r= 0.233; p= 0.044), but not with TS.
Conclusion:Self-perception of pain sensitivity articulated by intangible expressions such as pain threshold or pain sensitivity is unrelated to actual sensitivity to experimental pain. In contrast, when measured by intensity of a hypothetical painful event (HPI), sensitivity to pain is associated with some, but not all, experimental pain reports. Further studies are needed for better understanding of these associations and their potential clinical significance.
Keywords:pain threshold, pain intensity, quantitative sensory testing, QST, conditioned pain modulation, CPM, temporal summation, TS
Introduction
Interindividual variability in the experience of pain and in the response to analgesic therapies is well established and is of clinical importance.1,2 Attempts to identify patients
who are inclined to experience higher pain intensities than others or those who are less likely to respond to analgesic interventions have been made over the years. The abovementioned research constituted of genetic,3 imaging4 and psychological studies
(eg, anxiety and catastrophization).5 In addition, considerable efforts were invested
in quantitative sensory testing (QST) with an emphasis on correlating responses to experimental pain testing (pain threshold, intensity, etc) and clinical pain.6 Indeed,
“static” QST such as pain thresholds predicted acute postoperative pain.7–10 In addition,
the more advanced “dynamic” QST paradigms of conditioned pain modulation (CPM) Correspondence: Doron Meiselles
The Ruth and Bruce Rappaport Faculty of Medicine, Technion – Israel Institute of Technology, 1 Efron Street, Haifa 3525422, Israel
Tel/fax +972 4 983 5792 Email [email protected]
Journal name: Journal of Pain Research Article Designation: ORIGINAL RESEARCH Year: 2017
Volume: 10
Running head verso: Meiselles et al
Running head recto: Self-perceived versus actual sensitivity to pain DOI: http://dx.doi.org/10.2147/JPR.S149663
Journal of Pain Research downloaded from https://www.dovepress.com/ by 118.70.13.36 on 24-Aug-2020
For personal use only.
This article was published in the following Dove Press journal: Journal of Pain Research
13 November 2017
Dovepress Meiselles et al
and temporal summation (TS) also predicted chronic post-operative pain and the response to analgesic medications.11,12
Notably, CPM and TS reflect inhibitory and excitatory pain processes, respectively, so in contrast to static pain measures, they point to possible underlying mechanisms.12–14 However,
experimental pain does not always reflect the clinical experi-ence of pain, it is time-consuming and it requires designated equipment and, therefore, has not become a routine part of patient evaluation in the clinical practice.
A slightly different approach in the study of interindi-vidual heterogeneity in the experience of pain is the search for possible associations between reports of self-perceived sensitivity to pain and actual sensitivity to pain. However, two studies failed to show associations between reported self-perceived pain threshold, tolerance or sensitivity and experimental pain measures in healthy volunteers.15,16 This
led Edwards and Fillingim16 to conclude that “circumventing
psychophysical pain testing by assessing individual’s self-reported pain sensitivity is unlikely to be a useful strategy.” More recently, contradicting results were reported. The Pain Sensitivity Questionnaire (PSQ), a self-rating instrument based on pain intensity ratings of 17 daily life situations, showed significant associations with both experimental pain measures in healthy subjects17 and with postoperative pain
intensity in patients.18–20 Despite that, the clinical
applica-bility of this 17-item questionnaire in the daily busy clinics is challenging, thereby leaving the question of its practical utility open.
In an attempt to introduce a simpler approach, rather than using all 17 PSQ situations, we focused on a single hypothetical painful event. We looked for associations between experimen-tal pain measures and 1) reported pain intensity in response to a single hypothetical painful event, and 2) reports of self-perceived “pain sensitivity” and “pain threshold.” In addition, we looked for associations between the same self-reports and the magnitudes of dynamic QST measures. We hypothesized that pain intensity in response to the hypothetical painful event but not the other self-perceived variables (ie, self-perceived pain sensitivity and pain threshold) would show associations with at least some of the experimental pain measures.
Subjects and methods
Subjects
The ethics committees at Rambam Health Care Campus (0487-14-RMB) and at the University of Haifa (004/15) approved the study. The study sample included 75 paid, healthy volunteers (44 women) aged 25.9 ± 4.1 years (mean
± SD), from whom a complete dataset was obtainable. The
participants responded to advertisements spread-out around university campuses in Haifa, Israel. They met the follow-ing criteria: 1) age between 18 and 45 years, 2) no reported medical illness of any kind, 3) declined using medication or drugs during at least 1 month prior to entering the study and 4) a negative urine pregnancy test for female participants. Medical records of participants were not reviewed, and urine toxic screens were not performed. All participants provided written informed consent to participate in the study.
Self-perceived sensitivity to pain
The assessment of self-perceived sensitivity to pain con-sisted of three questions. The first two questions assessed self-perception of pain threshold and pain sensitivity and were phrased as follows: “How would you define your pain threshold in comparison to others using a 0–10 scale, where ‘0’ represents an extremely low pain threshold and ‘10’ stands for an extremely high pain threshold?” and “How would you define your pain sensitivity in comparison to others on a similar scale, where ‘0’ represents complete pain insensitivity and ‘10’ means extreme pain sensitivity?” Prior to responding to these two questions, participants received an explanation regarding the meaning of both pain sensitiv-ity and pain threshold, and the difference between the two: “Pain threshold is the point at which an applied stimulus first becomes painful. The lower the pain threshold, the earlier the stimulus becomes painful. Pain sensitivity on the other hand, represents the extent to which a painful stimulus is perceived as painful by you.” The third question tested self-perceived pain intensity in response to a hypothetical painful event (hypothetical pain intensity [HPI]) and was phrased as follows: “Imagine that while walking fast, you suddenly and forcefully bump a toe into a table’s leg. How would you rank the pain intensity that you would experience at that moment, where ‘0’ means no pain at all and ‘10’ is the most intense pain imaginable?”This hypothetical painful event was chosen because apart from being painful, it is generally perceived as a non-maiming situation, which has been experienced by most people. For all assessments, a 100 mm Visual Analog Scale (VAS) was used.
Static QST
The TSA 2001-II Thermal Sensory Device (Medoc, Ramat Ishai, Israel) was used for testing heat and cold pain thresh-olds. The 30 mm × 30 mm thermode was attached to the thenar eminence of the dominant hand. Baseline temperature was set at 32°C. The temperature was increased or decreased at a rate of 1°C/second. Subjects were asked to press a button
Journal of Pain Research downloaded from https://www.dovepress.com/ by 118.70.13.36 on 24-Aug-2020
Dovepress Self-perceived versus actual sensitivity to pain
once heat/cold stimuli first became painful. Each test was repeated three times, and the average temperature was con-sidered as the subject’s heat/cold pain threshold (°C).
Dynamic QST
CPM
CPM consisted of a test stimulus which was applied by attach-ing the thermode to the thenar eminence of the dominant hand. The conditioning stimulus (conditioning pain) was generated by immersing the subject’s nondominant hand into a cold-water bath (12°C) for 30 seconds. Determining the subjects’ CPM was performed as follows: once temperature of the first heat stimulus reached 47°C, participants were asked to express verbally their pain intensity using a 0–100 numeric pain scale. This was defined as “test pain 1.” Immediately afterward, subjects immersed their nondominant hand into the cold bath. About 30 seconds later, while their hand was still immersed in the cold water, a second identical heat stimulus was applied and the subject reported the pain intensity in response to this stimulus. This was defined as “test pain 2.” CPM was calcu-lated by subtracting test pain 2 from test pain 1. A positive value is indicative of an effective CPM.Notably, test pain 1 was also regarded as suprathreshold heat pain intensity. Sub-jects were asked to report the pain intensity in response to the conditioning stimulus (conditioning pain) immediately prior to withdrawing their hand from the cold bath. This report was regarded as suprathreshold cold pain intensity. These measures were used for further correlation analyses.
TS
The TSA thermode was attached to the inner forearm of the nondominant hand, and tonic painful heat stimulation was generated using the “ramp and hold” method.21 The baseline
temperature was set at 32°C, rose at a rate of 1°C/second to the maximal temperature of 46.5°C and sustained at that temperature for 120 seconds. Throughout the entire process (135 seconds), subjects continuously reported the pain inten-sity using a Computerized VAS (Co-VAS, 0–100), which automatically recorded readings at intervals of 0.1 seconds. The typical response to the tonic heat stimulation is com-posed of a peak in pain intensity just as temperature reaches its maximal value of 46.5°C, “first peak.” This peak is fol-lowed by a decline in pain intensity to a minimum, “nadir.” Thereafter, pain intensity rises again to a “second peak.” The calculated TS is the difference in pain intensity between the second peak and the nadir. Seldom, an atypical response is observed, where pain intensity rises gradually in a consistent fashion with no noticeable nadir. In this case, the TS was
calculated as the difference between the maximal recorded pain intensity and pain intensity recorded once the thermode reached the maximal temperature of 46.5°C.22 This type of
response was noted in three participants in the current study.
Study design
Volunteers were instructed to avoid any strenuous physi-cal activity during the 4 hours prior to the study session. A
β-hCG urine test (Innovacon, Inc., San Diego, CA, USA) was used to rule out pregnancy among female participants. After providing a verbal and a written explanation of the study, informed consent was obtained. Participants were then requested to respond to a fixed sequence of the self-perceived pain sensitivity questions. Each question was displayed on a separate page. Subsequently, an experimental pain training session was held, aimed at familiarizing participants with the different pain tests. The experimental pain tests were conducted 10 minutes later, at a fixed order, with 5–10-min-ute intervals between consecutive tests. Each session lasted approximately 1 hour. All experiments were performed in a quiet room and at a temperature of 25°C.
Statistical analysis
The results of the study were analyzed using SPSS for Windows Version 20 Statistical Package (IBM Corporation, Armonk, NY, USA). The statistical significance level was set at 5%, and the normality of variables’ distribution was established using the Shapiro–Wilk test (p-value > 0.01).23
Two experimental pain scores were constructed by averaging Z-scores of single variables:17 1) a thermal pain threshold
score which consisted of the heat and cold pain thresholds and 2) a suprathreshold pain intensity score which consisted of the suprathreshold heat and cold pain intensities. Pearson product–moment correlation coefficient (two-tailed) was used to test for associations between the different variables. Both single variables and experimental pain scores were correlated with the self-perceived variables. A sample size of 75 participants was required for a correlation with a sta-tistical significance level of 5%, a medium effect size24 and
an expected power of 80%.25
Results
Self-perceived sensitivity to pain
Participants ranked (mean ± SD: range) their self-perceived pain threshold relative to others at a level of 5.5 ± 1.6: 1–9. Pain sensitivity relative to others was perceived as 4.9 ± 1.5: 2–9. Pain intensity in response to the hypothetical painful event (HPI) was 6.4 ± 1.6: 2–10 (Table 1).
Journal of Pain Research downloaded from https://www.dovepress.com/ by 118.70.13.36 on 24-Aug-2020
Dovepress Meiselles et al
Static QST yielded the following results (mean ± SD): cold and heat pain thresholds were 13 ± 6.6°C and 46.5
± 3.1°C, respectively. Suprathreshold heat pain intensity was 41.7 ± 26.9. Notably, two subjects reported no pain in response to the heat stimulus, but were not excluded from either the study or the analyses, as to allow the widest pos-sible range of responses. Suprathreshold cold pain intensity was 73.4 ± 22.4 (Table 1).
Dynamic QST
Mean CPM and TS scores were 24.3 ± 18.6 and 39.9 ± 26.5, respectively (Table 1).
Associations between variables
The Shapiro–Wilk test (p-value > 0.01) and a visual inspec-tion of the self-perceived variables’ histograms revealed normal distribution of variables. Thus, Pearson product– moment correlation coefficient (two-tailed) was used to test for correlations between the different variables. No significant correlations were found between self-perceived pain thresh-old or self-perceived pain sensitivity and any of the static or dynamic QST measures.
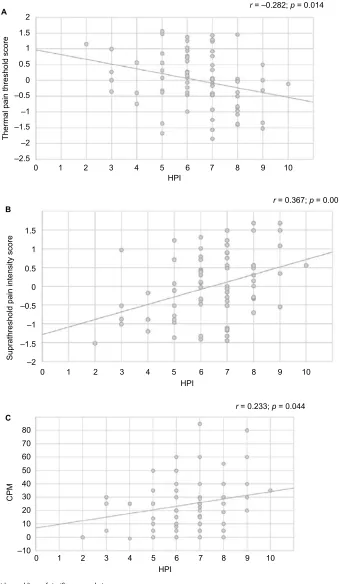
In contrast, significant correlations between HPI and multiple static QST measures were found, including positive correlations with cold pain threshold (r= 0.268; p= 0.02), suprathreshold heat pain intensity (r= 0.284; p= 0.013) and suprathreshold cold pain intensity (r= 0.358; p= 0.002). In addition, HPI correlated with the thermal pain threshold score (r= –0.282; p= 0.014; Figure 1A), suprathreshold pain intensity score (r= 0.367; p= 0.001; Figure 1B) and dynamic QST measure of CPM (r= 0.233; p= 0.044; Figure 1C). In conclusion, higher HPI was associated with lower pain
threshold scores, higher suprathreshold pain intensity scores and higher CPM. HPI did not correlate with either heat pain threshold or TS.
Discussion
The main findings of the current study are that the self-perceived pain threshold and pain sensitivity showed no associations with any of the QST measures whatsoever. In contrast, a significant correlation was found between the self-perceived pain intensity in response to a hypothetical painful event (HPI) and most static QST measures, as well as CPM. No association could be demonstrated between HPI and TS.
Similar to our findings, Edwards and Fillingim16 could
not demonstrate an association between self-reported pain sensitivity and experimentally measured heat pain threshold and tolerance. In the current study, we expanded Edwards and Fillingim’s results. Rather than using a single item of heat pain, we implied a variety of static and dynamic psy-chophysical measures. Still, in our study, the self-perceived variables of pain threshold and pain sensitivity failed to show significant associations with any of the QST measures, regardless of the modality used.
The absence of an association between self-perceived pain threshold or pain sensitivity and the QST measures could stem from the intangible nature of pain threshold and pain sensitivity. It is possible that, at least under these experimental circumstances, participants have trouble placing themselves correctly on an abstract scale of pain sensitivity, relative to the general population.16 It would certainly be of interest to
deter-mine whether associations between similar self-perception of pain threshold or pain sensitivity and clinical pain exist. We are unaware of such studies, but an extrapolation of our
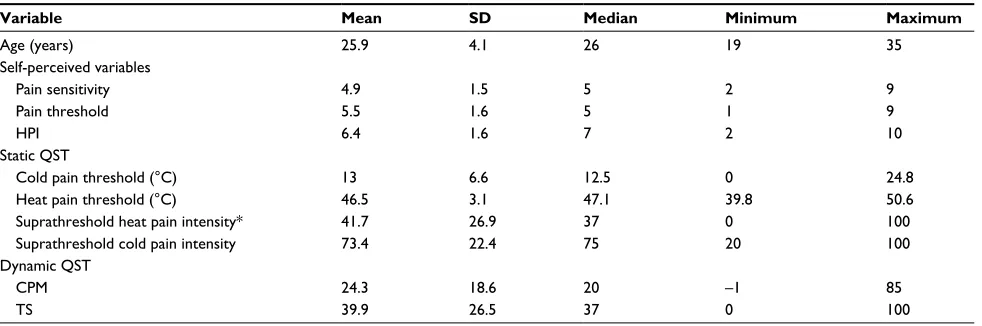
Table 1 Descriptive statistics
Variable Mean SD Median Minimum Maximum
Age (years) 25.9 4.1 26 19 35
Self-perceived variables
Pain sensitivity 4.9 1.5 5 2 9
Pain threshold 5.5 1.6 5 1 9
HPI 6.4 1.6 7 2 10
Static QST
Cold pain threshold (°C) 13 6.6 12.5 0 24.8
Heat pain threshold (°C) 46.5 3.1 47.1 39.8 50.6
Suprathreshold heat pain intensity* 41.7 26.9 37 0 100
Suprathreshold cold pain intensity 73.4 22.4 75 20 100
Dynamic QST
CPM 24.3 18.6 20 –1 85
TS 39.9 26.5 37 0 100
Notes: HPI is pain intensity in response to a hypothetical painful event. *Two participants reported a suprathreshold heat pain intensity of 0.
Abbreviations: CPM, conditioned pain modulation; HPI, hypothetical pain intensity; QST, quantitative sensory testing; TS, temporal summation.
Journal of Pain Research downloaded from https://www.dovepress.com/ by 118.70.13.36 on 24-Aug-2020
Dovepress Self-perceived versus actual sensitivity to pain
Figure 1 Scatter plots with trend lines of significant correlations.
Note: HPI versus (A) thermal pain threshold score, (B) suprathreshold pain intensity score and (C) CPM.
Abbreviations: CPM, conditioned pain modulation; HPI, hypothetical pain intensity.
2 1.5 A
B
C 1 0.5
1.5
1
0.5
0
–0.5
–1
–1.5
–2
80 70 60 50 40 30 20 10 0 –10 0
Thermal pain threshold score
Suprathreshold pain intensity score
CP
M
–0.5 –1 –1.5 –2 –2.5
0 1 2 3 4 5 6
HPI 7 8 9
r = –0.282; p = 0.014
r = 0.367; p = 0.001
r = 0.233; p = 0.044 10
0 1 2 3 4 5 6
HPI
7 8 9 10
0 1 2 3 4 5 6
HPI
7 8 9 10
Journal of Pain Research downloaded from https://www.dovepress.com/ by 118.70.13.36 on 24-Aug-2020
Dovepress Meiselles et al
and previous results on experimental pain,15,16 makes it quite
unlikely that such associations will be found.
Conversely, the finding of significant correlations between subjective pain intensity in response to a hypothetical painful event (HPI) and multiple QST measures could be explained by the tangible nature of the HPI. This hypothetical event can be linked or anchored to previous pain experiences and therefore make this self-report more relevant to the results of the experimental pain tests. Furthermore, unlike the other two questions which focus on placing one’s pain thresholds or pain sensitivity relative to others, the HPI is entirely a product of one’s self-observation and perception. Interestingly, a growing body of evidence points to the fact that pain intensity ratings of daily life situations, measured by the PSQ, may be of clinical value.19,20 In contrast to the
PSQ, which consists of 17 items, the multiple correlations found in the current study show that even a single concrete question could potentially be used to evaluate sensitivity to pain, at least in an experimental context. The relevance of this finding to clinical pain is yet to be determined.
Both CPM and TS have demonstrated association with various clinical pain states, such as postoperative and neuropathic pain, and with the response to analgesic inter-ventions,26 but thus far have not been associated with
self-perception of sensitivity to pain. The positive association found in our study between HPI and CPM is of interest and congruent with several previous studies showing high CPM magnitude in subjects who display high levels of experimen-tal and clinical pain. It may indicate that “effective” CPM is required for those who are “sensitive to pain.”12,26 In contrast,
TS is used to evaluate central facilitating aspects underlying pain experiences. It is believed to represent the “wind-up” phenomenon in response to repeated or prolonged nocicep-tive stimuli27 and therefore seems less relevant to the abrupt
pain experience described in our hypothetical painful event. Two limitations of the study should be noted. First, our sample included only healthy subjects in the age range of 19–35 years. Given the established association between age and response to experimental pain,28,29 these results may not
apply to people at different age groups. Second, participants were recruited by responding to advertisements in universi-ties, a fact that could have led to a selection bias.
Conclusion
Self-perceived pain intensity in response to a hypothetical painful event (HPI), but not intangible self-perceived pain threshold and pain sensitivity, shows associations with mul-tiple QST measures including experimental thermal pain
threshold and intensity, and the dynamic measure of CPM. Other self-perceived parameters are not associated with any of the experimental measures tested. These results suggest that a single concrete question, rather than commonly used intangible terms such as pain threshold or sensitivity to pain, could potentially be used to evaluate individual’s sensitivity to pain, at least in an experimental context. Further studies are needed to validate these findings.
Acknowledgments
The abstract of this paper was presented with interim findings, at the 13th Rambam Health Care Campus Research Day. The abstract was published under “Digital Presentations” in the
Rambam Maimonides Medical Journal.
Disclosure
The authors report no conflicts of interest in this work.
References
1. Fillingim RB. Individual differences in pain responses. Curr Rheumatol Rep. 2005;7(5):342–347.
2. Nielsen CS, Staud R, Price DD. Individual differences in pain sensitivity: measurement, causation, and consequences. J Pain. 2009;10(3):231–237.
3. Webster LR, Belfer I. Pharmacogenetics and personalized medicine in pain management. Clin Lab Med. 2016;36(3):493–506.
4. Khalili-Mahani N, Rombouts SA, van Osch MJ, et al. Biomarkers, designs, and interpretations of resting-state fMRI in translational pharmacological research: a review of state-of-the-art, challenges, and opportunities for studying brain chemistry. Hum Brain Mapp. 2017;38(4):2276–2325.
5. Hansen MS, Horjales-Araujo E, Dahl JB. Associations between psycho-logical variables and pain in experimental pain models. A systematic review. Acta Anaesthesiol Scand. 2015;59(9):1094–1102.
6. Cruz-Almeida Y, Fillingim RB. Can quantitative sensory testing move us closer to mechanism-based pain management? Pain Med. 2014;15(1):61–72.
7. Granot M, Lowenstein L, Yarnitsky D, Tamir A, Zimmer EZ. Post-cesarean section pain prediction by preoperative experimental pain assessment. Anesthesiology. 2003;98(6):1422–1426.
8. Granot M, Zimmer EZ, Friedman M, Lowenstein L, Yarnitsky D. Association between quantitative sensory testing, treatment choice, and subsequent pain reduction in vulvar vestibulitis syndrome. J Pain. 2004;5(4):226–232.
9. Edwards RR, Haythornthwaite JA, Tella P, Max MB, Raja S. Basal heat pain thresholds predict opioid analgesia in patients with postherpetic neuralgia. Anesthesiology. 2006;104(6):1243–1248.
10. Pan PH, Coghill R, Houle TT, et al. Multifactorial preoperative predic-tors for postcesarean section pain and analgesic requirement. Anesthe-siology. 2006;104(3):417–425.
11. Weissman-Fogel I, Granovsky Y, Crispel Y, et al. Enhanced presurgical pain temporal summation response predicts post-thoracotomy pain inten-sity during the acute postoperative phase. J Pain. 2009;10(6):628–636. 12. Yarnitsky D, Granot M, Nahman-Averbuch H, Khamaisi M, Granovsky Y. Conditioned pain modulation predicts duloxetine efficacy in painful diabetic neuropathy. Pain. 2012;153(6):1193–1198.
13. Le Bars D, Willer JC, De Broucker T. Morphine blocks descending pain inhibitory controls in humans. Pain. 1992;48(1):13–20.
14. Price DD, Von der Gruen A, Miller J, Rafii A, Price C. A psychophysical analysis of morphine analgesia. Pain. 1985;22(3):261–269.
Journal of Pain Research downloaded from https://www.dovepress.com/ by 118.70.13.36 on 24-Aug-2020
Dovepress
Journal of Pain Research
Publish your work in this journal
Submit your manuscript here: https://www.dovepress.com/journal-of-pain-research-journal
The Journal of Pain Research is an international, peer reviewed, open access, online journal that welcomes laboratory and clinical findings in the fields of pain research and the prevention and management of pain. Original research, reviews, symposium reports, hypoth-esis formation and commentaries are all considered for publication.
The manuscript management system is completely online and includes a very quick and fair peer-review system, which is all easy to use. Visit http://www.dovepress.com/testimonials.php to read real quotes from published authors.
Dove
press
Self-perceived versus actual sensitivity to pain
15. Robinson ME, Wise EA, Gagnon C, Fillingim RB, Price DD. Influences of gender role and anxiety on sex differences in temporal summation of pain. J Pain. 2004;5(2):77–82.
16. Edwards RR, Fillingim RB. Self-reported pain sensitivity: lack of correlation with pain threshold and tolerance. Eur J Pain. 2007;11(5): 594–598.
17. Ruscheweyh R, Marziniak M, Stumpenhorst F, Reinholz J, Knecht S. Pain sensitivity can be assessed by self-rating: development and validation of the Pain Sensitivity Questionnaire. Pain. 2009;146(1): 65–74.
18. Kim HJ, Lee JI, Kang KT, et al. Influence of pain sensitivity on surgi-cal outcomes after lumbar spine surgery in patients with lumbar spinal stenosis. Spine. 2015;40(3):193–200.
19. Azimi P, Benzel EC. Cut-off value for pain sensitivity questionnaire in predicting surgical success in patients with lumbar disc herniation.
PLoS One. 2016;11(8):e0160541.
20. Valeberg BT, Høvik LH, Gjeilo KH. Relationship between self-reported pain sensitivity and pain after total knee arthroplasty: a prospective study of 71 patients 8 weeks after a standardized fast-track program.
J Pain Res. 2016;9:625–629.
21. Tousignant-Laflamme Y, Pagé S, Goffaux P, Marchand S. An experi-mental model to measure excitatory and inhibitory pain mechanisms in humans. Brain Res. 2008;1230:73–79.
22. Suzan E, Aviram J, Treister R, Eisenberg E, Pud D. Individually based measurement of temporal summation evoked by a noxious tonic heat paradigm. J Pain Res. 2015;8:409–415.
23. Razali NM, Wah YB. Power comparisons of Shapiro-Wilk, Kolmogorov-Smirnov, Lilliefors and Anderson-Darling tests. J Stat Mod Anal. 2011;2(1):21–33.
24. Kraemer HC, Morgan GA, Leech NL, Gliner JA, Vaske JJ, Harmon RJ. Measures of clinical significance. J Am Acad Child Adolesc Psychiatry. 2003;42(12):1524–1529.
25. Hulley SB, Cummings SR, Browner WS, Grady D, Newman TB. Design-ing Clinical Research: An Epidemiologic Approach. Philadelphia, PA: Lippincott Williams & Wilkins; 2013:79.
26. Granovsky Y. Conditioned pain modulation: a predictor for development and treatment of neuropathic pain. Curr Pain Headache Rep. 2013;17(9):1–7. 27. Arendt-Nielsen L. Central sensitization in humans: assessment and
pharmacology. Handb Exp Pharmacol. 2015;227:79–102.
28. Edwards RR, Fillingim RB, Ness TJ. Age-related differences in endog-enous pain modulation: a comparison of diffuse noxious inhibitory con-trols in healthy older and younger adults. Pain. 2003;101(1):155–165. 29. Lautenbacher S, Peters JH, Heesen M, Scheel J, Kunz M. Age changes in pain perception: a systematic-review and meta-analysis of age effects on pain and tolerance thresholds. Neurosci Biobehav Rev. 2017;75:104–113.
Journal of Pain Research downloaded from https://www.dovepress.com/ by 118.70.13.36 on 24-Aug-2020