Abstract. The present work is devoted to classical molecular dynamics investigation into microscopic mechanisms of the bcc-hcp transition in iron. The interatomic potential of EAM type used in the calculations was tested for the capability to reproduce
ab initio data on energy evolution along the bcc-hcp transformation path (Burgers deformation + shuffle) and then used in the
large-scale MD simulations. The large-scale simulations included constant volume deformation along the Burgers path to study the origin and nature of the plasticity, hydrostatic volume compression of defect free samples above the bcc to hcp transition threshold to observe the formation of new phase embryos, and the volume compression of samples containing screw dislocations to study the effect of the dislocations on the probability of the new phase critical embryo formation. The volume compression demonstrated high level of metastability. The transition starts at pressure much higher than the equilibrium one. Dislocations strongly affect the probability of the critical embryo formation and significantly reduce the onset pressure of transition. The dislocations affect also the resulting structure of the samples upon the transition. The formation of layered structure is typical for the samples containing the dislocations. The results of the simulations were compared with the in-situ experimental data on the mechanism of the bcc-hcp transition in iron.
1. Introduction
A simulation of polymorphous transitions with Classical Molecular Dynamics (CMD) is complicated by the absence of an interatomic potential which could describe at least two phases with the same accuracy. Indeed, the transition from one crystal symmetry to another one is accompanied by changes in the electronic structure. Thus, it is rather difficult to use the same functional form and parametrization of an interatomic potential to describe interatomic interactions provided by different electronic structures.
Nevertheless classical MD has proved to be useful tool for the study of mechanisms of polymorphous transitions. Although interatomic potentials used cannot describe with high accuracy all the scope of properties of phases involved in the transition they are capable to describe/explain qualitatively and sometimes quantitatively the nature of processes that take place on the atomic level.
First MD simulations of polymorphous transition in iron under shock compression conditions were reported in [1–3]. The EAM potential by Voter & Chen [4] was used in these simulations. In these papers the peculiarities of bcc-hcp polymorphous transition in monocrystalline and polycrystalline samples were investigated. As for the monocrystalline samples the effect of loading in different crystallographic directions was studied. The main result of that work is that within the CMD approach it is possible
aCorresponding author:[email protected]
to reproduce basic characteristics of shock-wave loading accompanied by the polymorphous transition. The kinetics of the transformation proved to be rather fast to allow the considerable amount of the material to be transformed into the new phase within the timescale of about 10– 20 ps. The degree of the metastability at that (i.e. the distance from the equilibrium line or, in other words, the degree of overheating and overcompressing) proved to be reasonable.
The kinetics of the transformation is extremely sensitive to the difference of Gibbs potentials of the phases and when a Lagrangian particle crosses equilibrium boundary the rate of the martensitic transformation grows exponentially while the particle moves away from the boundary. When the calculations were carried out with polycrystalline samples the degree of metastability was even lower because grain boundaries serve as generators of plastic deformation favoring the formation of the new phase embryos of overcritical size.
In more recent paper [5] the polymorphous transition in iron was investigated under uniform uniaxial compression conditions at the strain rate 109s−1. Polycrystalline
samples were used in the simulations. The investigation was focused on a comparison of a number of interatomic potentials from the point of view of reproducing basic properties of α−, γ−, and -phases, as well as the transformation of initial bcc structure into a close-packed ones provided. The following potentials were tested in [5]: Mendelev [6], MEAM-p [7], Ackland [5] and Voter [4].
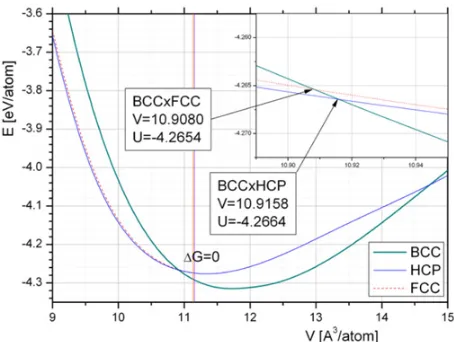
Figure 1. Cold (T=0 K) energy curves for bcc, fcc, and hcp crystal structures for the Ackland potential. Volume and energy at the intersection of bcc-fcc and bcc-hcp curves are shown in boxes.
The goal of present work is an investigation into microscopic mechanisms of the bcc-hcp polymorphous transformation in iron, namely, the role of Burgers mechanism accompanied by the shuffle of atomic layers (see [11]) and preexisting dislocations. In particular, the generation of dislocations and the plasticity mechanisms taking place during pure Burgers deformation of α-iron samples and the effect of dislocations on the time of -phase critical embryos generation are investigated.
2. Interatomic potential and basic
properties of hcp and bcc iron
In the following simulations we used interatomic potential of the EAM type that was modified in [5] as an improvement of Finnis-Sinclair potential [8]. The high pressure behavior of the potential [8] was improved in [5] to provide for α− transition at 13.75 GPa. In [5] this potential was characterized as quite well reproducing main features of the bcc-hcp transition in iron as well as dislocation properties. Hereafter this potential is referenced as Ackland potential. In Fig.1 energy-volume curves E(V ) calculated at T=0 K are presented. In Fig.2 enthalpy-pressure G(P) curves at T=0 K for iron phases are shown relative to bcc phase.
Next, we calculated energy dependence on the deformation along the Burgers path and compared the obtained results with the results of calculations performed with the VASP code [9,10]. In VASP calculations 8 atom supercell analogous to that from [11] was used. The bcc-phase was taken as having ferromagnetic structure and hcp-phase as having antiferromagnetic AFM I structure. Pseudopotential PAW GGA taking into account 8 outer electrons as valent was used. The cut-off energy was chosen in a standard way. A 18×4×26 k-point grid was used.
The calculations of the deformation along the Burgers path were performed for the bcc structure undergoing the deformation from=0 to =1 (Shuffle coordinate remains zero) and for the hcp structure undergoing
Figure 2. Cold (T=0 K) enthalpy E+P V curves for bcc, fcc,
and hcp crystal structures for the Ackland potential. Volume of bcc phase and volume change at the transitions fcc and bcc-hcp are shown in boxes.
deformation from =1 to =0 (Shuffle coordinate remains equal 1, i.e. all four atomic layers are fully shuffled). For the details of the Burgers deformation see [11].
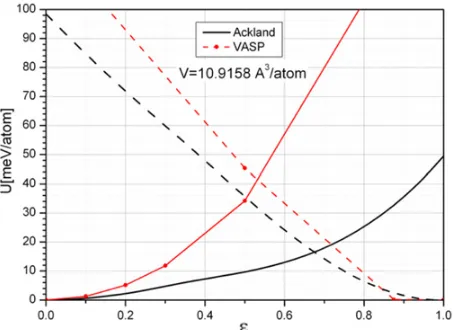
The CMD calculations were carried out with the sample composed of 10×10×10 supercells (containing 8 atoms) with periodic boundary conditions. To provide for a direct comparison with the results of the VASP code the energy was calculated for a number of fixed deformationsand the MD relaxation was turned off. For a given deformationthe corresponding deformed 8 atom supercell was constructed and then the whole sample was constructed of these deformed supercells. In such a way we excluded the generation of any elastic waves in the sample. The volume of the supercell at which the calculations were carried out corresponds to the intersection of bcc and hcp energy curves, i.e. for the VASP and the EAM [5] calculations the volumes slightly differ and are equal 10.53 and 10.9158 A3/atom, respectively. The comparison of the
calculations obtained with the potential [5] and with the VASP code is presented in Fig.3.
One can see that the potential [5] considerably underestimates energy growth along the Burgers path for the bcc-phase. For the hcp-phase the agreement is much better but the underestimation is also takes place. The considerable underestimation of the energy change for α-phase along the Burgers path is due to magnetic energy contribution that is not taken into account in the EAM potential. Note here, that it is quite difficult to account for the magnetic contribution to the total energy in the frame of semiempirical approach.
In the next Fig. 4 we plotted energy of 8 atom supercell as dependent on shuffle coordinate at a number of fixed deformations . The calculations were carried out for the volume V=10.9158 A3/atom corresponding
Figure 3. Energy dependence on deformationalong the Burgers path for the Ackland potential. Red is for VASP results, black is for Ackland potential. Solid lines are for bcc initial state (=0, Shuffle=0 and dashed lines are for hcp initial state (=1, Shuffle=1).
Figure 4. Energy of 8 atom supercell as dependent on shuffle coordinate at fixed deformationfor the Ackland potential. The curve designated as “Synchronous” is for simultaneous shuffling of all 4 atoms in the unit cell. Other curves are for the case when layers shuffle takes place in a consecutive way: coordinate 0.25 corresponds to the configuration where one layer is fully shuffled, 0.5−two layers etc..
the thresholds are smaller for the EAM potential used if compared with ab initio calculations [11].
3. Large scale CMD simulations
The first series of the simulations was carried out to investigate into the mechanism of plasticity proper to the Burgers deformation path. In the simulations the samples constructed of 50×25×100 supercells (8 atom per supercell) were used and periodic boundary conditions were applied. To provide for a quasistatic regime of loading the deformation from =0 to =1 takes one million MD step (MD step=1.5 fs). Prior to the deformation modeling the samples were relaxed at zero stress tensor and T=300 K during 100,000 MD steps.
Figure 5. Stresses vs. deformation along the Burgers path.
Figure 6. Thin cut of the samples after Burgers deformation. Red oval designates the twin formed in the sample as a result of the Burgers deformation. Yellow is for the bcc structure. Structures were recognized by the ATA.
The dependence of normal stresses during the Burgers deformation is presented in Fig.5. It is seen that at0.72 the sharp release of the stresses takes place due to the commencement and development of plastic deformation. The character of the plastic deformation is shown in Fig. 6. Analysis of the structural changes showed that the release of the stresses took place due to formation of twins. Results of structure recognition with the Adaptive Template Analysis (ATA) [16] show that the twins form tube-like structure oriented along [111] direction (see Fig.7). The orientation of crystal lattice with respect to the twin boundary is presented in Fig.8.
The MD simulations of bulk compression were carried out with big samples (dimensions of the samples were 60×30×30 nm, ∼5 mln particles) in periodic boundary conditions. The simulations were performed for three deformation rates ˙: 666.6µs−1 (Fast), 66.66µs−1 (Medium), 6.666µs−1 (Slow). Temperature was kept
Figure 7. Tube-like structure of twins in the bulk of the sample. Only boundaries of twins are shown. Structures were recognized by the ATA.
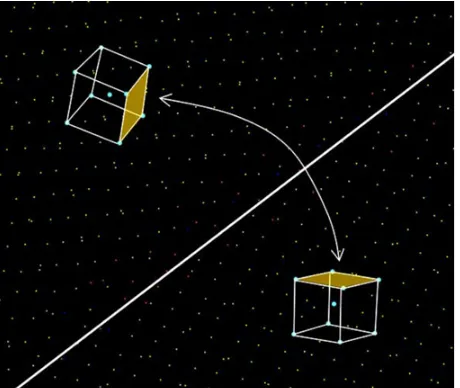
Figure 8. Orientations of crystal lattice (cubic unit cells) above and below the boundary between twins.
[110] axis. To generate the screw dislocations we used the method described in [15].
The pressure-density plot for the bulk compression of the sample free of defects is presented in Fig. 9. As it is seen in the figure in the absence of defects there is a noticeable degree of overcompressing before the transition starts. The equilibrium transition pressure for this potential is ∼14 GPa. But because of the small system size and low probability of formation of critical size embryo of the new phase at pressures slightly above the equilibrium pressure the transition does not start (in the timescale of the MD simulation) until some degree of the metastability is achieved. In other words the probability of critical size embryo formation rapidly grows as the current state gets further away from the equilibrium line, i.e. with the difference increase of Gibbs potentials between the α− and the−phases. At some degree of overcompression the
Figure 9. Pressure vs. density for the bulk compression.
Figure 10. Fragment of the sample initially free of defects upon completion of the bcc-hcp transition. Medium loading rate, MD step=360000: P=35.261 GPa,ρ=9.02 g/cm3. ATA colors: Blue – hcp structure, green and red – boundaries between the hcp grains.
probability becomes high enough for the transition occurs at the given size of the sample and the timescale of the simulation.
At the fast compression rate the transition starts only at∼56 GPa. There is a noticeable dependence on the rate of loading. Indeed, at the medium rate the characteristic “delay time” at each pressure is effectively an order of magnitude greater, and the transition occurs at smaller pressure ∼47 GPa. At the slowest rate of loading the transition starts at∼43 GPa.
Let’s now look at the structure of the samples during the transition. A fragment of the sample initially free of defects is shown in Fig.10. The picture presented here is for the medium rate of loading. But for all the rates the pictures look qualitatively the same. The transition starts from the embryos of the new phase randomly produced in the bulk of the sample. The rapid growth of the embryos leads to the formation of polycrystalline structure composed mostly of the hcp grains chaotically oriented relative to each other.
Figure 11. Fragment of the sample containing dislocations. Medium loading rate. ATA colors: blue – hcp structure, green and red – boundaries between the hcp and the bcc structures and stacking faults in growing hcp grains. Dislocations are shown by arrows. Atoms belonging to the bcc structure are not shown.
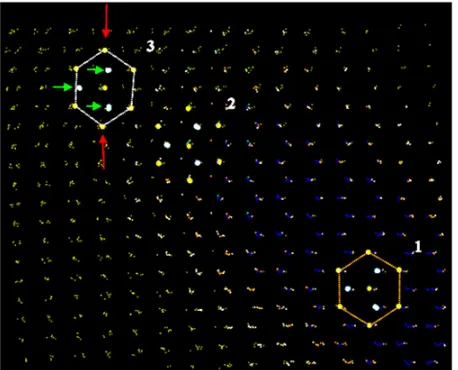
Figure 12. Boundary between growing hcp plate (small blue points) and bcc matrix (small yellow points). The atomic arrangements are viewed from the [110] direction. Elemental structures (central atom and its 12 neighbors) of hcp, transition, and bcc type are designated as 1,2,3. Red arrows show Burgers deformation, green arrows show shuffle direction.
Thus, the presence of the dislocations strongly affects the probability of critical embryo formation and significantly decreases the degree of the metastability achieved during the loading. In Fig.11 the initial stage of the transition is shown. It is well seen in the figure that thin plates of the new phase starts to grow at the dislocations. The dislocations are 1D sources of the transition. As it was concluded in [17] the shear stress is important to initiate the bcc-hcp transition. In the vicinity of the screw dislocations the shear component of deformation is non-zero. The mechanism of the transition from the bcc to hcp structure is realized as the boundary separating the newly formed hcp plate from the bcc matrix propagates through the sample. It is shown in Fig.12. Here one can see three elemental structures (central atom and its 12 nearest neighbors): 1) belonging to the bcc, 2) located at the
structure, green and red – boundaries between the hcp and the bcc structures and between hcp grains. The bcc structure is not shown. Dislocations have vertical orientation; their positions are shown by arrows.
Figure 14. Fragment of sample containing dislocations MD. Step 290,000. Transition is completed. ATA colors: Blue – hcp-structure, green and red – boundaries between the hcp grains and stacking faults in the hcp grains.
boundary, and 3) belonging to the just born hcp structure. It is interesting to note that the hcp structure obtained is slightly distorted due to unfinished shuffle. The similar behaviour was registered in quiasistatic experiments [17] whereas the shear motion finished at the beginning of the transition. In our simulations the newly born hcp structure encapsulated in the thin plates is not in hydrostatic conditions (see below) and we relate the unfinished shuffle with the conditions of unrelaxed shear stress. At later time of the simulation in the bulk of the hcp grains the structure is close to the perfect hcp distorted only by thermal vibrations.
The CMD simulations of the Burgers deformation showed that the bcc crystal undergoes plastic transformations during the deformation. We observed twinning as the mechanism of plasticity.
The simulations of volume compression demonstrated high level of metastability achieved when compressing the samples. The transition starts at the pressure much higher than the equilibrium pressure. Screw dislocations strongly affect the probability of the formation of new phase critical embryos and significantly reduce the pressure at which the transition begins. The dislocations affect also the resulting structure of the samples upon the transition. The formation of layered structure is typical for the samples containing the dislocations due to the origin of the transition at the dislocations in the form of the thin plates of the hcp phase growing outward the dislocation line.
References
[1] Kadau K., Germann N.C., Lomdahl P.S., Holian B.L., Science, 296, (2002) 1681.
[2] Kadau K., Germann N.C., Lomdahl P.S., Holian B.L., Cherne F.J., Atomistic simulation of shock induced phase transitions, AIP Conf. Proc., 706 (2003), 229–234.
(2003).
[7] T. Lee, M.I. Baskes, S.M. Valone, D.J. Doll, J. Phys.: Condens. Matter. 24, 225404 (2012).
[8] G. J. Ackland, D. J. Bacon, A. F. Calder, and T. Harry, Philos. Mag., A75, (1997) 713.
[9] G. Kresse and J. Furthmuller, Comput. Mater. Sci., 6, 15 (1996).
[10] G. Kresse and J. Furthmuller, Phys. Rev. B, 54, 11169 (1996).
[11] B. Dup´e, B. Amadon, Y.-P. Pellegrini, and C. Denoual, Phys. Rev. B 87, 024103 (2013).
[12] D.F. Johnson, E.A. Carter, J. Chem. Phys., 128, 104703 (2008).
[13] J.C. Boettger, D.C. Wallace, Phys. Rev. B, 55, 2840-2849 (1997).
[14] M.S. Duesbery, V. Vitek, Acta mater., 46, 1481 (1998).
[15] W. Cai, V.V. Bulatov, J. Chang, J. Li, and S. Yip, Philos. Mag., 83, 539 (2003).
[16] F.A. Sapozhnikov, G.V. Ionov and V.V. Dremov, Russian Journal of Physical Chemistry B, 2, 238-245 (2008).