Malaysian Parent Ratings of the Strengths and Difficulties Questionnaire: Measurement Invariance across Language Versions, Gender, Informants, and Race
Rapson Gomez
Federation University Australia
Vasileios Stavropoulos
Cairnmillar Institute, Australia & National and Kapodistrian University of Athens, Greece
Correspondence concerning this article should be addressed to Rapson Gomez, School of Health Sciences and Psychology, Federation University Australia, University Drive, Mt Helen, PO Box 663, Ballarat, Victoria, Australia, 3353. Email:
Abstract
For a Malaysian sample, the current study used exploratory factor analysis (EFA) to determine the best model for parent ratings of the Strengths and Difficulties Questionnaire (SDQ), and then multiple-group confirmatory factor analysis (MCFA) to examine
measurement invariance for these ratings across different language versions (Malay and English), child’s gender (boys and girls), informants (mothers and fathers), and racial groups (Malay, Chinese and Indians). In all 1407 Malaysian parents completed SDQ ratings of their children (age ranging from 5 to 13 years). The EFA revealed a 2-factor model oblique model, with support for a positive construal factor and a psychopathology factor. For this model, the MCFA showed full measurement invariance (configural, metric and scalar) across all the groups in the different comparisons. For all comparisons, there were equivalencies for latent mean scores. The implications of the findings for clinical and research practice involving the SDQ in Malaysia are discussed.
The Strengths and Difficulties Questionnaire (SDQ), which is available free of charge in more than 79 languages (www.sdqinfo.com) is a rating scale for screening the emotional and behavioural problems of children, aged 4 to 16 years (R. Goodman, 1997; R. Goodman, Meltzer, & Bailey, 1998). Worldwide, the SDQ is one of the most often used measure for screening children’s emotional and behavioural problems (Metltzer, Gatward, Goodman, & Ford, 2000). Despite the fact that the SDQ has been frequently used in clinical settings and research studies in Malaysia (e.g., Cheah & Yuen, 2016; Gomez & Suhaimi, 2013; Kadir et al., 2015; Othman, Blunden, Mohamad, Hussin, & Osmar, 2009; Yakub, Kadir, Malekian, & Mansor, 2016), psychometric information for this instrument in this nation is limited. The aim of the current study was to examine the factor structure of the parent version of SDQ in a Malaysian community sample, and also measurement invariance for these ratings across different language versions (Malay and English), child’s gender (boys and girls), informants (mothers and fathers), and racial groups (Malay, Chinese and Indians).
Description, Use, Nosological Relevance and Popularity of the SDQ
Identical versions of the SDQ are available for parent and teacher completion. There is also a near identical version for self-completion by adolescents between 11 and 16 years of age (R. Goodman, Meltzer, & Bailey, 2003). Each version of the SDQ contains five
theoretical based subscales, with five items in each subscale (R. Goodman, 1997; R.
Goodman et al., 1998). The subscales are emotional symptoms (ES), conduct problems (CP), hyperactivity-inattention (HY), peer problems (PP), and prosocial behaviour (PS). As the SDQ is brief, and the SDQ items and their organization into the different subscales (especially the HY and CP subscales) concured with nosological models in the previous DSM-IV, the SDQ was offered then as a valid and useful screening instrument (Stone, Otten, Engels, Vermulst, & Janssens, 2010) for clinical research and practice, including
Nevertheless, DSM-IV (APA, 1994) has now been replaced by DSM-5 (APA, 2013). In that context, and given that there have been only minor changes across DSM-IV and DSM-5 in regards to Attention Deficit Hyperactivity Disorders (ADHD), Conduct Disorder (CD), and Oppositional Disorder (ODD), the SDQ CP and HY subscales could be considered suitable for screening DSM-5 ADHD, CD, and ODD (APA, 1994; APA, 2013; Rosales et al., 2015). Similarly to DSM-IV, in DSM-5, the identified anxiety disorders involve separation anxiety disorder, social phobia, specific phobia, panic disorder, agoraphobia, and generalized anxiety disorder (APA, 1994; APA, 2013). In that line, the major depressive disorders listed in DSM-5 (APA, 2013) are persistent depressive disorder (core symptom being persistent depressive mood) and disruptive mood dysregulation disorder (core symptoms being
irritability and temper outburst). Subsequently, provided that the SDQ subscale for ES items refers to nervous behaviours, fears, aches, worries, and unhappiness manifestations, this subscale could be seen as suitable for potentially screening DSM-5 anxiety disorders, as well as persistent depressive disorder. Overall therefore, one could assume that the SDQ may be envisaged as relevant for screening the DSM-5 classifications of ADHD, CD, ODD, anxiety disorders, and persistent depressive disorder among children and adolescent populations. This hypothesis is strengthened by recent studies that used the instrument for mental health
screening purposes in under-aged (<18 years) populations (Mellins et al., 2018; Hoosen, Davids, Vries, & Shung-King, 2018).
Factor Structure of the SDQ
Reflecting the content of the SDQ items and their organization into the different
factor analytical procedures have generally supported this theorized five-factor model (e.g., Becker et al., 2004; Dickey & Blumberg, 2004; R. Goodman, 2001; Hawes & Dadds, 2004; Mieloo et al., 2014; Niclasen et al., 2012; van Leeuwen, Meerschaert, Bosmans, De Medts & Braet,., 2006). However, researchers have noted that Confirmatory Factor Analyses (CFA) applied on different samples have provided questionable support for this model (see recent reviews by Caci, Morin and Tran, 2015; Kersten et al., 2016; Stone et al., 2010).
To date, worldwide, at least 12 different models, described and reviewed in Gomez and Stavropoulos (2017), have been suggested for the SDQ. The same study used CFA to examine the relative support for these models. The findings showed most support for an oblique six factor model that included the five SDQ domains and a positive construal factor comprising all the ten SDQ positive worded items. However, while this model showed good fit in terms of its RSMEA value, the CFI and TLI showed poor fit. Thus we still do not have a generally acceptable structural model for the SDQ. In that line, and given the uses advocated for the SDQ, it is critical that a good understanding of its psychometric properties is
established, including in countries where such data is limited, such as Malaysia. Examination of the Factor Structure of the SDQ in Malaysia
information on the optimum SDQ model for a Malaysian sample. This is problematic as the SDQ has been used widely in this country (e.g., Cheah & Yuen, 2016; Gomez & Suhaimi, 2013; Kadir et al., 2015; Othman et al., 2009; Yakub et al., 2016). Additionally, a
psychometric property that could foster more confidence in the use of the SDQ in Malaysia is the support for the instrument’s measurement invariance.
Measurement Invariance
Measurement invariance refers to groups reporting the same observed scores when they have the same level of the underlying trait (Reise, Widaman, & Paugh, 1993). As applied to the SDQ, measurement invariance would mean that for the groups being
compared, the SDQ has the same measurement and scaling properties across the groups. As support for measurement invariance is a prerequisite for meaningful group comparisons, it follows that if there is no support for measurement invariance across the groups being studied, then the results of such comparisons could be confounded by differences in measurement and scaling properties for the SDQ across the groups. If there is weak or no support for invariance, then it is suggested that the groups in question cannot be justifiably compared in terms of their SDQ observed scores, as the same observed scores across the groups may not reflect the same levels of the underlying SDQ trait being measured. Thus, if the SDQ is to be used across different groups (in the present case different groups within the broader Malaysian population), then it is necessary to confirm that the ratings of the SDQ across the groups being compared present with measurement invariance.
uniqueness (error variances invariance) (Vandenberg & Lance, 2000). Metric, scalar and error invariance are alternatively referred as weak, strong and strict invariance (Meredith, 1993).
Studies of Measurement Invariance of the SDQ
To date, only a few studies have examined measurement invariance for parent ratings of the SDQ (Caci et al., 2015; Chiorri, Hall, Casely-Hayford, & Malmberg, 2016; Ezpeleta, Granero, de la Osa, Penelo, & Domènech, 2013; A. Goodman, Patel, & Leon, 2010; Ortuño-Sierra et al., 2015; Palmieri & Smith, 2007; Stone et al., 2013). The review by Caci et al. (2015) concluded that the evidence, based on 9 studies, is generally supportive of some (but not full) level of invariance of the SDQ 5-factor measurement model across genders, age, grade, language, and informant. However, as noted by Ortuño-Sierra et al. (2015) various country-specific modifications may be required for the efficient application of the instrument. At present, there is no information on measurement invariance for parent ratings of the SDQ (or other versions of the SDQ) for a Malaysian sample. Among others, there are reasons to suspects that SDQ ratings for a Malaysian sample could lack measurement invariance across child’s gender (boys and girls), informants (mothers and fathers), and racial groups (Malay, Chinese and Indians).
daughters and sons (gender defined-linked perceptions). At the psychometric level, these differences could show as lack of measurement invariance (metric and/or scalar) across behaviour ratings of mother and fathers, and parent ratings of boys and girls.
Interestingly, the Malaysian population comprises Malays, Chinese, Indians, and others (Swee-Hock, 2015). The major groups are Malays, Chinese, and Indians. These groups have different ethnic value systems. The ethnic value system of the Malays is embedded in the budi complex, which is central to Malay values, attitudes and behaviours towards the self and others (Bhaskaran & Sukumaran, 2007). According to Ramli (2013), these include being polite, generous, respectful, sincere, righteous, discrete, feeling shame at the individual level, and knowing that stresses intuitive feelings. Together they interact to provide norms of individual and social behaviours that lead to approval from others (Rampli, 2013).
across Chinese, Malay and Indian parents in terms of how they perceive and therefore report their children’s behaviours. These could potentially lead to lack of measurement invariance (metric and/or scalar) across these racial groups, when they report on their children’s behaviours in relation to the relevant SDQ items.
Aims of the Current Study
Given the above mentioned limitations in existing data on the SDQ in Malaysia, the first aim in the current study was to explore, through Exploratory Factor Analysis (EFA), the factor structure for the SDQ for parent ratings of a Malaysian sample. Like Stone et al. (2013), the present study chose to focus on the parent version of the instrument, since it is the one most widely used for research purposes. For the EFA, the original sample was randomly split into two samples of participants: Sample 1 (calibration sample) and Sample 2 (validation sample). The ratings for the calibration sample were subjected to EFA. Following this, the ratings for the validation sample were subjected to CFA for the EFA model that showed the best fit.
Method Participants
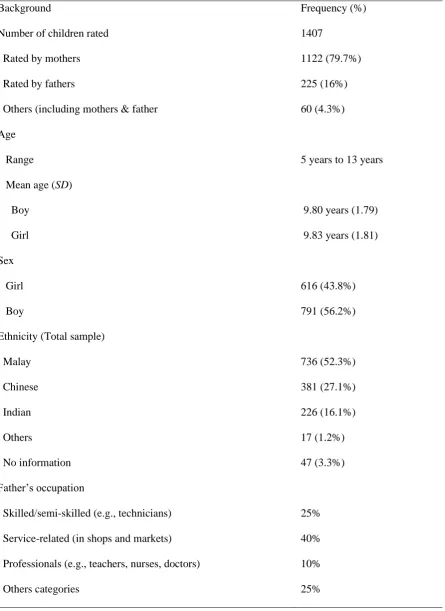
The participants were 1407 caregivers (primarily parents, and henceforth referred to as parents) of primary school children (age ranging from 5 years to 13 years). Table 1 provides background information on the participants rated in the study. As shown, of the 1407 respondents, 1122 were completed by mothers, 225 were completed by fathers, and the remaining 60 were completed by others, including mothers and fathers together. These respondents provided ratings for 616 boys and 791 girls. The mean age (SD) for boys was 9.80 years (1.79) and 9.83 years (1.81) for girls. There was no significant difference for age between boys and girls, t (1405) = 1.28, p > .05. In terms of ethnicity, 736 were Malay
Malaysians, 381 were Chinese Malaysians, 226 were Indian Malaysians, 17 belonged to other ethnic groups, and 47 participants did not provide this information. For Malaysia as a whole, the percentages of Malay, Chinese and Indian are 61.5% Malays, 26.4% Chinese, 10.5% Indian, and 1.6 others (Department of Statistics, Malaysia, 2010). The percentages of Malay, Chinese, Indian and others who provided this information in the current study were 54.3%, 28.0%, 16.1%, and 1.3%, respectively. Subsequently, the ethnic distribution of the study sample did not differ significantly from the reported Malaysian population, χ2 (3) = 1.70, p > .05. In terms of educational attainment, most parents had completed primary and secondary education, and the majority of fathers were engaged in skilled/semi-skilled (e.g., technicians and associated technicians, 25%) and service-related (e.g., service workers in shops and markets; 40%) occupations. Professionals (e.g., teachers, nurses, doctors) constituted
Measure (Strength and Difficulties Questionnaire, R. Goodman, 1997)
The measure included in this study was the parent version of the Strengths and Difficulties Questionnaire (SDQ; R. Goodman, 1997). Parents were provided both English and Malay versions (downloaded from the SDQ website; www.sdqinfo.com) of the SDQ, with instructions to select any one version. Each of the 25 SDQ item is rated as either “not true” (scored 0) or “somewhat true” (scored 1) or “certainly true” (scored 2). Five items are reverse-scored.
Procedure
Prior to data collection, ethical approval for the study was obtained from the
University of Tasmania Social Sciences Human Research Ethics Committee. Following this, approvals were sought from the relevant authorities for distributing the relevant documents, including the dissemination of the SDQ to parents through schools. Initially, approval were obtained from the Research Promotion and Coordination Committee, Economic Planning Unit (EPU), Prime Minister’s Department, Malaysia, to conduct the research through the primary schools in Klang Valley in the State of Selangor in Malaysia. Following this approval, additional approvals were obtained from State Department of Education for both the Federal Territory of Kuala Lumpur and the state of Selangor.
the Federal Territory of Kuala Lumpur. Based on the total population in these districts and zones, projected number (around 1,000) of SDQ ratings desired for the study, and advise from senor Selangor educational authorities, two out of the four Selangor districts and one of the four Federal Territory zones were randomly chosen to be included in the study. The units were the Petaling districts, Hulu Langat districts and Bangsar zone. There were a total of 269 schools in these units (50% from Petaling district; 32% from Hulu Langat district; 18% from Bangsar Zone). Based on the list of the school postcodes, nine schools from Petaling district, six schools from Hulu Langat district and three schools from Bangsar zone were selected using a random number generator. Eighteen primary schools in the Klang Valley region made up the final units. Principals of the selected schools were contacted to further determine their interest in participating in the study. Out of the 18 schools contacted, fourteen agreed to receive information regarding the study. Finally, 12 schools agreed to participate.
Following approvals from the school principals of the twelve schools, classroom teachers were issued with the appropriate number of large sealed envelopes to be forwarded to parents, through their students. Each envelope contained a plain language statement providing the background of the study, and the set of questionnaires, including the SDQ. At this point it should be noted that participation was completely voluntary, and no incentive was offered in regards to it. To minimize the potential bias in ratings, the letter to parents indicated that the study was examining aspects of childhood behaviour. Parents were
requested to participate in the study by completing the questionnaires. They were also asked to provide the child's age, gender and racial background and to return the completed
rate of 56.3%. Overall, 830 parents completed the Malay version and 577 parents completed the English version.
For more detailed description of the participants and procedure, the reader is encouraged to refer to Gomez and Stavropoulos (2017).
Statistical procedures
In the EFA, conducted with Mplus (Version 7) software, we tested for one to 6-factor solutions. For these analyses, WLSMV estimation, with promax (i.e., oblique) rotation was applied to the calibration sample. Scree plot, model fit indices, the content and interpretability of the factors, salience of item loadings, items with cross-loadings, and number of salient items in a factor were used concurrently to ascertain the optimum number of factors to be retained. As per Tabachnick and Fidell (2007), it was decided to use a loading of .45 (20% variance overlap between variable and factor) or more as salient loadings. For items with cross-loadings, the item was allocated only to the factor with the highest cross-loading, and the minimum number of items required for a factor was set at three (Tabachnick & Fidell, 2007).
All the CFA models in the study were conducted using Mplus (Version 7) software (Muthén & Muthén, 2013). As there are three ordered response categories for all the SDQ items, the mean and variance-adjusted weighted least squares (WLSMV) extraction was used for all the CFA analyses (Rhemtulla, Brosseau-Liard, & Savalei, 2012).This is a robust estimator, recommended for CFA with ordered-categorical scores. This method does not assume normally distributed variables. According to measurement experts, relative to other estimators, the WLSMV estimator provides the best option for modeling categorical data (Beauducel & Herzberg, 2006; Lubke & Muthen, 2004; Millsap & Yun-Tein, 2004).
of the SDQ because they involved categorical scores, and as this study utilized a community sample, some level of floor effect could be expected in the ratings.
Measurement invariance was tested using the procedure proposed by Millsap and Yun-Tein (2004) for the WLSMV estimator with theta parameterization. In brief, this
procedure involves comparing progressively more constrained models that test for configural invariance, metric invariance, scalar invariance, and error variances invariance. Support for configural invariance indicates that the same number of factors and equivalence in terms of the pattern of indicator factor loadings hold across groups. Support for metric invariance indicates that the strength of the relationships between the items and their respective factors are equivalent across groups, and that across the groups, the items are measuring their
relevant latent factors using the same metric scale. Support for scalar invariance indicates that for the same level of the latent trait, individuals across the groups will endorse the same observed level (when observed scores are treated as continuous) or response category (when observed scores are treated as ordered categorical). Support for error variances invariance indicates that the unique variances are equivalent across groups.
In the approach proposed by Millsap and Yun-Tein (2004), for testing configural invariance, except for those parameters set for identification purpose, all other parameters are freely estimated across the groups. For testing metric invariance (M2), one group is selected as the reference group, and the factor loadings for like items of all the other groups are
constrained equal to the reference group. This metric invariance model is supported if there is no difference in fit between this model and the configural model (M1). In the current study, Malay version, boys, mothers, and Malays were set as the reference groups, for the
Scalar invariance is inferred if the fit for M3 does not differ significantly from M2. Finally, error variances invariance (M4) is tested by revising M3, so that all like error variances for the non-reference groups are set equal to the reference group. Error variances invariance is inferred if the fit for M4 does not differ significantly from M3. Together these analyses constitute the test for strict measurement invariance (Little, 1997). When there is some support for measurement invariance (full or partial), the groups can be compared for latent mean scores (M5), taking into account the non-invariance in the measurement model.
However, it needs to be highlighted that this analysis does not constitute part of measurement invariance, but test of population heterogeneity.
At the statistical level all the CFA models were evaluated using χ2 values (WLSMVχ2 values in the current case). As all types of χ2 values, including WLSMVχ2, are inflated by large sample sizes, the fit of the models tends to be generally interpreted by researchers using approximate fit indices, such as the root mean squared error of approximation (RMSEA), the comparative fit index (CFI), and Tucker-Lewis Index (TLI). For models based on maximum likelihood estimation, the guidelines suggested by Hu and Bentler (1998) are that RMSEA values close to .06 or below be taken as good fit, close to .07 to <.08 as moderate fit, close to .08 to .10 as marginal fit, and close to > .10 as poor fit. For the CFI and TLI, values of .95 or above are taken as indicating good model-data fit, and values of .90 and <.95 are taken as acceptable fit. For the current study, these appropriate approximate fit indices, and not the χ2 statistic were used as evidence of model fit. It is worth noting however that despite the widespread use of these indices and fit values, a simulation study by Nye and Drasgow (2011) concluded that appropriate indices cut-off values for WLSMV estimation can vary across conditions.
Statistical differences between models were calculated using the differences in χ2
values and the corresponding differences in the df values. An value of .01 was used to allow for more stringent Type 2 error control in the models compared.
Results
Exploratory Factor Analysis for Calibration Sample (Sample 1)
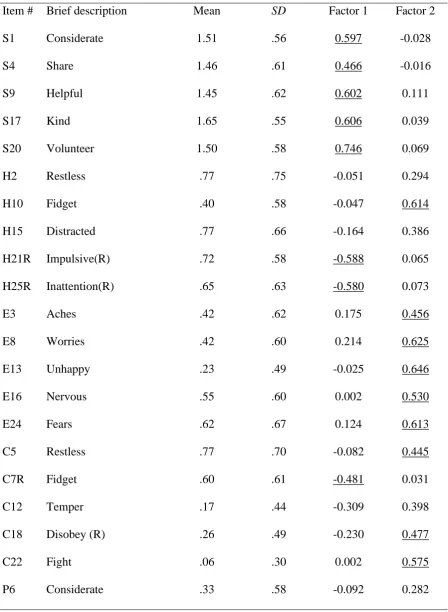
There were no missing values for the SDQ ratings used in the current study. The scree plot from the EFA (see Supplementary Figure S1) involving the calibration sample suggested two or three factors for the SDQ. The fit values for the 1- to 6-factor solutions are presented in Supplementary Table S1. As shown, the 1-factor model showed poor fit in terms of the RSMEA, CFI and TLI values. The 3- to 6-factor models showed good fit in terms of their RSMEA, and CFI values. A closer inspection of salient items indicated that in all these models there were one or more factors with less than three items. For example, in the 3-factor model, only two items showed salient loadings on the third factor, with one of them showing higher loadings on the first factor. Thus, although the 3-, 4-, 5-, and 6-factor models showed good model fit, they did not merit consideration, based on our criteria. For the 2-factor model, there was good model fit in terms of the RSMEA value, and acceptable model fit in terms of the CFI and TLI values. Thus, this model has sufficient fit for further consideration.
clearly interpretable. Given the findings of the scree plot, the content and interpretability of the factors in the 2-factor model, and number of salient items in these factors, the 2-factor model was selected (over the other models) as the preferred model. Based on the item contents for Factors 1 and 2 for the 2-factor model, these factors were labelled “positive construal factor” and “psychopathology factor”, respectively.
CFA for Validation Sample Based on the 2-factor EFA Model
The fit indices for the 2-factor model for the validation sample were as follows: [2 (df = 134) = 406.626, p < .001; RMSEA = .054 (90% CI = .048 - .060); CFI = .907 and TLI = 894]. Thus, the RMSEA indicated good model fit, and the CFI and TLI indicated adequate model fit. The correlation between the “positive construal factor” and the “psychopathology factor” was -.418, p < .001). Although this correlation is significant, it is much lower than .80, and can therefore be interpreted as supportive of their discriminant validity (Brown, 2006). Overall, the findings in the CFA supported the 2-factor model suggested by the EFA for the calibration sample, thereby reinforcing the 2-factor model as the preferred model. CFA of the Full Sample Based on the 2-factor EFA Model
The fit indices for the full sample were as follows: [2 (df = 134) = 568.871, p < .001; RMSEA = .048 (90% CI = .044 - .052); CFI = .923 and TLI = 912]. Thus, the RMSEA indicated good model fit, and the CFI and TLI indicated adequate model fit. The correlation between the “positive construal factor” and the “psychopathology factor” was -.391, p < .001), which is supportive of their discriminant validity (Brown, 2006). Overall the findings in the CFA for the full sample supported the 2-factor model suggested by the EFA. The standardized estimates for the different parameters (factor loadings, error variances, factor correlation) for this model is shown in Supplementary Figure 2.
Cronbach’s alpha is one of the most often used measures of internal consistency reliability, it has been argued that it could be a biased estimate because it assumes tau-equivalent or equal factor loadings of the items comprising the scale – an unrealistic expectation (Zinbarg, Revelle, Yovel & Li, 2005). In contrast, omega coefficient (ω; McDonald, 1999) allows items in the scale to have their own unique loadings (congenic model). As this assumption is more realistic, the ω coefficient is considered as more appropriate to provide a more accurate indication of internal consistency than coefficient α here (Zinbarg et al., 2005). The ω values for the “positive construal factor” and the “psychopathology factor” were .83, and .80, respectively, thereby supporting the internal consistency-reliabilities of the two factors in the 2-factor model.
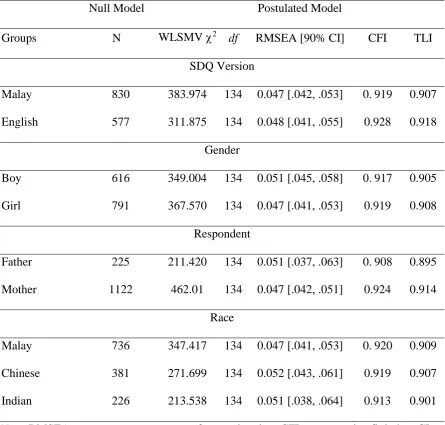
Applicability of the 2-Factor Model for the Groups Examined for Invariance
According to Brown (2014), for reliable estimates from multiple-group CFA models, it would be desirable for the hypothesized model applied to the groups to have adequate fit. Given this, prior to multiple-group analyses, the goodness-of-fit values for the 2-factor model for ratings completed for Malay and English SDQ versions, boys and girls, older and younger age groups, mothers and fathers, and Malay, Chinese and Indian children were examined separately. As shown in Table 3, the RMSEA values for all the 2-factor models indicated good model fit, ranging from .047 to .052. Similarly, the values for the CFI (ranging from .908 to .932) and TLI (ranging from .895 to .918) indicated acceptable fit for all models. Taken together these findings can be interpreted as revealing sufficient fit for the 2-facror model for all groups to pursue invariance testing.
Multiple-Group CFA Analyses for Measurement invariance and Latent Mean Differences
Chinese and Indian children are presented in Table 4. The table shows that for all
comparisons, the RMSEA indicated good fit for the configural model (M1s), and acceptable fit in terms of their CFI and TLI values. These findings can be interpreted as sufficient
support for the respective configural model in each instance. As shown in the table, there was no difference in all comparisons between the configural models (M1s) and the metric
invariance models (M2s); the metric invariance models (M2s) and the scalar invariance models (M3s) and; the scalar invariance models (M3s) and the error variances invariance models (M4s). Also, for all the comparisons, there was also no difference between the error variances invariance models (M4s) and the equivalency for the mean scores models (M5s). Thus, all latent mean scores for the groups compared were equivalent. Overall, therefore, these findings can be interpreted as indicating that for the 2-factor model, there was good support for full measurement invariance (metric, scalar and error variances invariance) for all SDQ items, and also equivalency of latent mean scores for the SDQ ratings across the groups compared.
Discussion
One aim of the study was to evaluate the factor structure of the SDQ, based on parent ratings of a large group of children in Malaysia. For this, EFA was initially applied to test 1- to 6-factor oblique models in a calibration sample. Based on the criteria used to ascertain the number of factors to be retained (scree plot, model fit indices, the content and interpretability of the factors, .45 or above in terms of item loadings, items with cross-loadings allocated to the factor with the highest cross-loading, and at least three salient items in a factor), the 2-factor model was selected as the optimum model. In this model, Factor 1 was conceptualized as a “positive construal factor” and all its items were positively worded. Factor 2 was
involving a validation sample, and a combined sample involving both the calibration and validation samples. Furthermore, for the latter sample, there was support for the 2-factor model in terms of internal consistency reliabilities, in that the coefficient ω values for the “positive construal factor” (ω = .83) and the “psychopathology factor” (ω = .89) were all above .70, that is generally considered the minimum level for acceptable internal consistency reliability (Nunnally, 1978). Thus, the 2-factor model was adopted as the optimum model.
The support for the 2-factor model in the study differs from the originally theorized 5-factor model, with the ES, CP, HY, PP and PS items loading on their own respective 5-factors (R. Goodman, 1997, 2001). Although this does not reflect any of the other 11 SDQ models reviewed by Gomez and Stavropoulos (2017), the present model has some semblance with one of the model they reviewed. In that model, initially proposed by Palmieri and Smith (2007), there is (like our study) a positive construal factor comprising all the 10 positive worded items. The present 2-factor model also has some semblance with the findings from past studies of the factor structure of the SDQ in Malaysian samples (Gomez & Stavropoulos, 2017; Stokes, Mellor, Yeow, & Hapidzal, 2014). Although there was mixed fit, Gomez and Stavropoulos (2017) found most support for an oblique 6–factor model that included a positive construal factor. In their 3-factor model, Stokes et al. (2014) reported a factor for anxieties, attention, and obedience. Although the authors argued that this latter factor was difficult to interpret, it may be viewed as reflecting the “psychopathology factor” identified in the present work.
for latent mean scores, the analyses indicated equivalency for all latent scores across all groups compared. Overall, therefore, it can be argued that our findings indicate good support for full measurement invariance (metric, scalar and error variances invariance) and
equivalency for latent mean scores across all groups compared. The support for configural invariance indicates that the same number of factors for the SDQ and item patterns hold across the different groups compared. The support for metric invariance indicates that the strength of the relationships between the SDQ items and their respective factors are
equivalent across the groups studied, and that across the groups, the items are measuring their relevant latent factors using the same metric scale. Similarly, the support for scalar invariance indicates that for the same level of the latent trait, individuals across the groups compared would endorse the same response category; and support for error variances invariance indicates that the unique variances or reliability for the SDQ items across the groups compared are the same. Thus, the present findings are somewhat inconsistent with existing measurement invariance data for the SDQ. Unlike the findings in the current study for full measurement invariance across the groups compared, the review by Caci et al. (2015) concluded that the evidence, based on 9 studies, is generally supportive of partial (but not full) level of invariance of the SDQ 5-factor measurement model across genders, age, grade, language, and informant. It is likely that the difference in findings may be related to the sample and factor model examined in the current study. As noted by Ortuño-Sierra et al. (2015) various country-specific differences may be present across different countries. In that line, and as there is no information on measurement invariance for parent ratings of the SDQ (or other versions of the SDQ) for a Malaysian sample, our findings can be seen as providing important new information for the efficient use of the SDQ in this country.
Implications
practice and research. First, it is indicated that unlike the originally proposed 5-factor
structure, the SDQ is best viewed in terms of a 2-factor model for parent ratings of Malaysian children. The factors are a “positive construal factor”, and a “psychopathology factor”. As the “positive construal factor” comprises all items (1, 4, 7, 9, 14, 17, 20, 21, and 25) measuring strengths (the five prosocial items and four of the five positively worded items), this factor can be considered to be of little relevance for measuring emotional and behavioural problems of Malaysian children. In constant, as the items for the “psychopathology factor” (3, 5, 8, 10, 13, 16, 18, 22, and 24) derived from the original subscales for ES (all 5 symptoms), CP (3 symptoms), and HY (I item), this factor can be seen as relevant for measuring global psychopathology of Malaysian children. This also means that parent ratings of the SDQ of Malaysian children are unable to distinguish between the different emotional and behavioural problems specified for the SDQ, and should not be used for that purpose. Given this, and also as seven (2, 6, 11, 12, 15, 19 and 23) of the 25 items did not show salient factor loadings, it could be argued that only ratings for the nine items constituting the “psychopathology factor” (3, 5, 8, 10, 13, 16, 18, 22, and 24) are needed for the SDQ to capture psychopathology of Malaysian children.
Second, the invariance findings in this study indicate that the SDQ viewed in terms of the 2-factor model supported in this study can be justifiably used across groups completing the Malay and English SDQ versions; Malaysian parent ratings of boys and girls; Malaysian parent ratings of older and younger children; parent ratings of Malaysian mothers and fathers, and parent ratings of Malay, Chinese and Indian children in Malaysia. Thus, it can be argued that the parent version of the SDQ can be considered a valuable and appropriate measure for clinical and research applications in Malaysia, including screening at risk for
in latent mean scores across various groups were found, the same normative scores could be used generally for the Malaysian population.
Limitations
It needs to be noted that the findings in this study need to be viewed with several limitations in mind. First, the translation of a measure to another language requires
linguistic/semantic equivalence across cultures. In that line, there is no description of how the Malay version of the SDQ provided at the website had achieved its linguistic/semantic
equivalence. Second, as the response rate was 56.3%, this may have impacted the findings. However, based on a meta-analysis, Cummings, Savitz and Konrad (2001) reported that the average response rate to surveys involving health questionnaires was 52% for sample size of around 1000. As the present sample size was 1407, our response rate of 56.3% is higher than the average rate reported by Cummings, et al (2001). Third, it is conceivable that SDQ ratings are influenced by a number of background factors (e.g., age, socio-economic status, and comorbidity). As this study did not control for these factors, the findings may have been confounded by them. Fourth, this study used parent ratings and, as such, it is uncertain if similar findings would emerge with teacher ratings, or with self-ratings. Fifth, all the children rated in this study were from the general community, based in an Asian country. Thus, it is possible that the findings may not be applicable to clinic-referred samples, samples of children with clinical diagnoses, or to different cultural and national groups. Despite these limitations, it is hoped the results and information provided in this paper would contribute meaningfully towards better understanding of the factor structure and measurement invariance of the SDQ, and also clinical practice and research involving the SDQ in Malaysia.
References
Allik, J., & McCrae, R. R. (2004). Toward a geography of personality traits: Patterns of profiles across 36 cultures. Journal of Cross-Cultural Psychology, 35(1), 13-28. American Psychiatric Association. (1994). Diagnostic and statistical manual of mental
disorder (4th ed.). Washington, DC: American Psychiatric Association.
American Psychiatric Association. (2013). Diagnostic and statistical manual of mental disorder (5th ed.). Washington, DC: American Psychiatric Association.
Bhaskaran, S., & Sukumaran, N. (2007). National culture, business culture and management practices: consequential relationships?. Cross Cultural Management: An International Journal, 14(1), 54-67.
Beauducel, A., & Herzberg, P. Y. (2006). On the performance of maximum likelihood versus means and variance adjusted weighted least squares estimation in CFA. Structural Equation Modeling, 13, 186-203. DOI:10.1207/s15328007sem1302_2 Becker, A., Woerner, W., Hasselhorn, M., Banaschewski, T., & Rothenberger, A. (2004).
Validation of the parent and teacher SDQ in a clinical sample. European Child & Adolescent Psychiatry, 13, ii11-ii16.DOI:10.1007/s00787-004-2003-5
Brown, T. A. (2014). Confirmatory factor analysis for applied research. Guilford Publications.
Caci, H., Morin, A. J., & Tran, A. (2015). Investigation of a bifactor model of the Strengths and Difficulties Questionnaire. European Child & Adolescent Psychiatry, 24, 1291-1301. DOI: 10.1007/s00787-015-0679-3
Calmorin, L. P., & Calmorin, M. A. (2007). Research methods and thesis writing. Published and distributed by Rex Book Store Phillippines.
Chiorri, C., Hall, J., Casely-Hayford, J., & Malmberg, L. E. (2016). Evaluating measurement invariance between parents using the Strengths and Difficulties Questionnaire (SDQ). Assessment, 23, 63-74. DOI:10.1177/1073191114568301
Cummings, S. M., Savitz, L. A., & Konrad, T. R. (2001). Reported response rates to mailed physician questionnaires. Health Services Research, 35(6), 1347-1355.
Department of Statistics Malaysia (2010). Evidence retrieved on 10 of January 2010 https://www.dosm.gov.my/v1/
Dickey, W. C., & Blumberg, S. J. (2004). Revisiting the factor structure of the strengths and difficulties questionnaire: United States, 2001. Journal of the American Academy of Child & Adolescent Psychiatry, 43, 1159-1167.
DOI:10.1097/01.chi.0000132808.36708.a9
Ezpeleta, L., Granero, R., de la Osa, N., Penelo, E., & Domènech, J. M. (2013).
Psychometric properties of the Strengths and Difficulties Questionnaire 3–4 in 3-year-old preschoolers. Comprehensive Psychiatry, 54, 282-291.
DOI:10.1016/j.comppsych.2012.07.009
Gomez, R., & Stavropoulos, V. (2017). Parent ratings of the Strengths and Difficulties Questionnaire: What is the optimum factor model? Assessment. OnlineFirst, July 2017. DOI: 10.1177/1073191117721743
Gomez, R., & Suhaimi, A. F. (2013). Incidence rates of emotional and behavioural problems in Malaysian children as measured by parent ratings of the Strengths and Difficulties Questionnaire. Asian Journal of Psychiatry, 6, 528-531.DOI:
10.1016/j.ajp.2013.06.009
Goodman, R. (1997). The Strengths and Difficulties Questionnaire: a research note. Journal of Child Psychology and Psychiatry, 38, 581-586. DOI:
10.1111/j.1469-7610.1997.tb01545.x
Goodman, R. (2001). Psychometric properties of the strengths and difficulties questionnaire. Journal of the American Academy of Child & Adolescent Psychiatry, 40, 1337-1345. DOI:10.1097/00004583-200111000-00015
Goodman, R., Meltzer, H., & Bailey, V. (2003). The Strengths and Difficulties
Questionnaire: a pilot study on the validity of the self-report version. International Review of Psychiatry, 15(1-2), 173-177. DOI:10.1080/0954026021000046137 Goodman, R., Meltzer, H., & Bailey, V. (1998). The Strengths and Difficulties
Questionnaire: A pilot study on the validity of the self-report version. European Child & Adolescent Psychiatry, 7, 125-130.DOI: 10.1007/s007870050057
Hawes, D. J., & Dadds, M. R. (2004). Australian data and psychometric properties of the Strengths and Difficulties Questionnaire. Australian and New Zealand Journal of Psychiatry, 38, 644-651. DOI: 10.1111/j.1440-1614.2004.01427.x
Hoosen, N., Davids, E. L., Vries, P. J., & Shung-King, M. (2018). The Strengths and Difficulties Questionnaire (SDQ) in Africa: a scoping review of its application and validation. Child and adolescent psychiatry and mental health, 12(1), 6.
Hossain, Z., & Juhari, R. (2015). Fathers across Arab and Non-Arab Islamic
societies. Fathers across cultures: the importance, roles, and diverse practices of dads: the importance, roles, and diverse practices of dads, 368.
Kadir, A., Ba'yah, N., Mustapha, Z., Mutalib, A., Hanida, M., & Yakub, N. A. (2015). Using the Strengths and Difficulties Questionnaire (SDQ) to Predict Emotional and
Behavioral Difficulties on Positive and Negative Affect Among Adolescents in
Disadvantaged Communities. Asian Social Work and Policy Review, 9, 125-137. DOI: 10.1111/aswp.12052
Kersten, P., Czuba, K., McPherson, K., Dudley, M., Elder, H., Tauroa, R., & Vandal, A. (2016). A systematic review of evidence for the psychometric properties of the Strengths and Difficulties Questionnaire. International Journal of Behavioral Development, 40, 64-75.
Little, T. D. (1997). Mean and covariance structures (MACS) analyses of cross-cultural data: Practical and theoretical issues. Multivariate Behavioral Research, 32, 53–76.
Lubke, G. H., & Muthén, B. O. (2004). Applying multigroup confirmatory factor models for continuous outcomes to Likert scale data complicates meaningful group comparisons. Structural Equation Modeling, 11, 514-534. DOI:10.1207/s15328007sem1104_2 McDonald, R. P. (1999). Test theory: A unified approach. Mahwah, NJ: Erlbaum.
Mellins, C. A., Xu, Q., Nestadt, D. F., Knox, J., Kauchali, S., Arpadi, S., ... & Davidson, L. L. (2018). Screening for Mental Health Among Young South African Children: the Use of the Strengths and Difficulties Questionnaire (SDQ). Global Social Welfare, 1-10.
Meltzer, H., Gatward, R., Goodman, R., & Ford, T. (2000). The mental health of children and adolescents in Great Britain. HM Stationery Office.ONS, London, UK. Meredith, W. (1993). Measurement invariance, factor analysis and factorial
Mieloo, C. L., Bevaart, F., Donker, M. C., van Oort, F. V., Raat, H., & Jansen, W. (2014). Validation of the SDQ in a multi-ethnic population of young children. The European Journal of Public Health, 24, 26-32.DOI:10.1093/eurpub/ckt100
Millsap, R. E., & Yun-Tein, J. (2004). Assessing factorial invariance in ordered-categorical measures. Multivariate Behavioral Research, 39, 479-515.DOI:
10.1207/S15327906MBR3903_4
Muthén, L. K., & Muthén, B. O. (2013). Users Guide Mplus 7.11. Los Angeles, CA: Muthén & Muthén.
Niclasen, J., Teasdale, T. W., Andersen, A. M. N., Skovgaard, A. M., Elberling, H., & Obel, C. (2012). Psychometric properties of the Danish Strength and Difficulties
Questionnaire: the SDQ assessed for more than 70,000 raters in four different cohorts. PloS One, 7, e32025. DOI:10.1371/journal.pone.0032025
Noordin, F., & Jusoff, K. (2010). Individualism-collectivism and job satisfaction between Malaysia and Australia. International Journal of Educational Management, 24(2), 159-174.
Nunnaly, J. (1978) Psychometric theory. New York: McGraw-Hill.
Nye, C. D., & Drasgow, F. (2011). Assessing goodness of fit: Simple rules of thumb simply do not work. Organizational Research Methods, 14(3), 548-570. DOI;
10.1177/1094428110368562
Ortuño-Sierra, J., Chocarro, E., Fonseca-Pedrero, E., i Riba, S. S., & Muñiz, J. (2015). The assessment of emotional and behavioural problems: Internal structure of The
Strengths and Difficulties Questionnaire. International Journal of Clinical and Health Psychology, 15, 265-273. DOI:1016/j.ijchp.2015.05.005
Malaysia, Psycho Oncology, Published Online: May 22 2009 5:23AM, doi: 10.1002/pon.1584.
Palmieri, P. A., & Smith, G. C. (2007). Examining the structural validity of the Strengths and Difficulties Questionnaire (SDQ) in a US sample of custodial grandmothers. Psychological Assessment, 19, 189-198.DOI:10.1037/1040-3590.
Quah, S. R. (2004). Ethnicity and parenting styles among Singapore families. Marriage & family review, 35(3-4), 63-83.
Ramli, R. (2013). Culturally appropriate communication in Malaysia: budi bahasa as warranty component in Malaysian discourse. Journal of Multicultural
Discourses, 8(1), 65-78.
Reise, S. P., Widaman, K. F., & Pugh, R. H. (1993). Confirmatory factor analysis and item response theory: two approaches for exploring measurement invariance.
Psychological Bulletin, 114, 552-566. DOI:10.1037/0033-2909.
Rhemtulla, M., Brosseau-Liard, P. É., & Savalei, V. (2012). When can categorical variables be treated as continuous? A comparison of robust continuous and categorical SEM estimation methods under suboptimal conditions. Psychological Methods, 17, 354-373. DOI: 10.1037/a0029315
Rosales, A. G., Vitoratou, S., Banaschewski, T., Asherson, P., Buitelaar, J., Oades, R. D., ... & Chen, W. (2015). Are all the 18 DSM-IV and DSM-5 criteria equally useful for diagnosing ADHD and predicting comorbid conduct problems?. European child & adolescent psychiatry, 24(11), 1325-1337.
Stokes, M., Mellor, D., Yeow, J., & Hapidzal, N. F. (2014). Do parents, teachers and children use the SDQ in a similar fashion? Quality & Quantity, 48, 983-1000. DOI:10.1007/s11135-012-9819-8
Janssens, J. M. (2013). The parent version of the strengths and difficulties
questionnaire. European Journal of Psychological Assessment. DOI:10.1027/1015-5759/a000119
Stone, L. L., Otten, R., Engels, R. C., Vermulst, A. A., & Janssens, J. M. (2010). Psychometric properties of the parent and teacher versions of the strengths and difficulties questionnaire for 4-to 12-year-olds: a review. Clinical Child and Family Psychology Review, 13, 254-274.DOI: 10.1007/s10567-010-0071-2.
Stormshak, E. A., Bierman, K. L., McMahon, R. J., & Lengua, L. J. (2000). Parenting practices and child disruptive behavior problems in early elementary school. Journal of clinical child psychology, 29(1), 17-29.
Swee-Hock, S. (2015). The population of Malaysia (Vol. 514). Institute of Southeast Asian Studies.
Tabachnick, B. G., & Fidell, L. S. (2007). Using multivariate statistics. Allyn & Bacon/Pearson Education.
Tu, W. M. (1998). Confucius and confucianism. Confucianism and the family, 3-36. Vandenberg, R. J., & Lance, C. E. (2000). A review and synthesis of the measurement
invariance literature: Suggestions, practices, and recommendations for organizational research. Organizational Research Methods, 3, 4-70. DOI:10.1177/109442810031002 Van Leeuwen, K. V., Meerschaert, T., Bosmans, G., De Medts, L., & Braet, C. (2006). The
strengths and difficulties questionnaire in a community sample of young children in flanders. European Journal of Psychological Assessment, 22, 189-197.
DOI:10.1027/1015-5759.22.3 .
Yap, S. T., Baharudin, R., Yaacob, S., & Osman, S. (2014). Paternal and maternal involvement in Malaysian adolescents: test of factor structure, measurement invariance and latent mean differences. Child Indicators Research, 7(1), 193-208. Zinbarg, R. E., Revelle, W., Yovel, I., & Li, W. (2005). Cronbach’s α, Revelle’s β, and
Table 1
Background Information of Participants Rated in the Study
Background Frequency (%)
Number of children rated 1407
Rated by mothers 1122 (79.7%)
Rated by fathers 225 (16%)
Others (including mothers & father 60 (4.3%)
Age
Range 5 years to 13 years
Mean age (SD)
Boy 9.80 years (1.79)
Girl 9.83 years (1.81)
Sex
Girl 616 (43.8%)
Boy 791 (56.2%)
Ethnicity (Total sample)
Malay 736 (52.3%)
Chinese 381 (27.1%)
Indian 226 (16.1%)
Others 17 (1.2%)
No information 47 (3.3%)
Father’s occupation
Skilled/semi-skilled (e.g., technicians) 25%
Service-related (in shops and markets) 40%
Professionals (e.g., teachers, nurses, doctors) 10%
Table 2
Standardized Loadings from the EFA of the SDQ in the Calibration Sample for the 2-Factor Model
Item # Brief description Mean SD Factor 1 Factor 2
S1 Considerate 1.51 .56 0.597 -0.028
S4 Share 1.46 .61 0.466 -0.016
S9 Helpful 1.45 .62 0.602 0.111
S17 Kind 1.65 .55 0.606 0.039
S20 Volunteer 1.50 .58 0.746 0.069
H2 Restless .77 .75 -0.051 0.294
H10 Fidget .40 .58 -0.047 0.614
H15 Distracted .77 .66 -0.164 0.386
H21R Impulsive(R) .72 .58 -0.588 0.065
H25R Inattention(R) .65 .63 -0.580 0.073
E3 Aches .42 .62 0.175 0.456
E8 Worries .42 .60 0.214 0.625
E13 Unhappy .23 .49 -0.025 0.646
E16 Nervous .55 .60 0.002 0.530
E24 Fears .62 .67 0.124 0.613
C5 Restless .77 .70 -0.082 0.445
C7R Fidget .60 .61 -0.481 0.031
C12 Temper .17 .44 -0.309 0.398
C18 Disobey (R) .26 .49 -0.230 0.477
C22 Fight .06 .30 0.002 0.575
P11R Share .35 .66 -0.330 -0.071
P14R Helpful .38 .54 -0.564 0.127
P19 Kind .37 .58 0.065 0.412
P23 Volunteer 1.03 .71 0.271 0.120
Note. Column 1 shows the item number and the allocated scales in the initially proposed 5-factor 5-factor model for the SDQ (S = Prosocial; H = hyperactivity-inattention; E = emotional symptoms; C = conduct problems; P = peer problems.
Table 3
Fit of the SDQ 2-Factor Model for Groups Tested for Measurement Invariance
Null Model Postulated Model
Groups N WLSMV 2 df RMSEA [90% CI] CFI TLI
SDQ Version
Malay 830 383.974 134 0.047 [.042, .053] 0.919 0.907 English 577 311.875 134 0.048 [.041, .055] 0.928 0.918
Gender
Boy 616 349.004 134 0.051 [.045, .058] 0.917 0.905
Girl 791 367.570 134 0.047 [.041, .053] 0.919 0.908
Respondent
Father 225 211.420 134 0.051 [.037, .063] 0.908 0.895 Mother 1122 462.01 134 0.047 [.042, .051] 0.924 0.914
Race
Malay 736 347.417 134 0.047 [.041, .053] 0.920 0.909 Chinese 381 271.699 134 0.052 [.043, .061] 0.919 0.907 Indian 226 213.538 134 0.051 [.038, .064] 0.913 0.901 Note. RMSEA= root mean square error of approximation; CFI= comparative fit index; CI =
Table 4
Results of Tests for Measurement Invariance and Latent Score Difference across SDQ Language Versions
Model Fit Model Difference
Models (M) WLSMV 2 df RMSEA [90% CI] CFI TLI ΔM Δdf Δ2
Language Versions
M1: Configural invariance 701.606 268 0.048 [.0440, .052] 0.921 0.910 - - -
M2: Metric invariance 701.076 286 0.045 [.041, .050] 0.925 0.919 M2-M1 18 21.655
M3: Thresholds invariance 681.629 302 0.042 [.038, .046] 0.931 0.930 M3-M2 16 7.709 M4: Error variances invariance 679.630 320 0.040 [.036, .044] 0.935 0.938 M4-M3 18 27.646 M5: Invariance for the means of the latent factors 677.436 322 0.040 [.035, .044] 0.936 0.939 M5-M4 2 4.256
Gender
M1: Configural invariance 716.738 268 0.049 [.044, .053] 0.918 0.907 - - -
Mother and Father
M1: Configural invariance 651.950 268 0. 046 [.042, .051] 0.919 0.907 - - -
M2: Metric invariance 638.817 286 0. 043 [.038, .047] 0. 925 0.920 M2-M1 18 18.493 M3: Thresholds invariance 627.270 302 0. 040 [.036, .044] 0. 931 0.930 M3-M2 16 16.308 M4: Error variances invariance 631.758 320 0. 038 [.0346, .042] 0. 934 0.937 M4-M3 18 29.396 M5: Invariance for the means of the latent factors 623.133 322 0. 037 [.033, .042] 0. 936 0.940 M5-M4 2 1.458
Race
M1: Configural invariance (e13$2 free) 819.184 402 0.048 [.043, .053] 0. 917 0.905 - - - M2: Metric invariance 826.251 438 0. 044 [.040, .049] 0. 923 0.919 M2-M1 36 38.728 M3: Thresholds invariance 835.006 470 0. 042 [.037, .046] 0. 927 0.929 M3-M2 32 38.494 M4: Error variances invariance 839.729 506 0. 038 [.034, .043] 0934 0.940 M4-M3 36 42.047 M5: Invariance for the means of the latent factors 830.510 510 0.037 [.033, .042] 0.936 0943 M5-M4 4 2.708
Note. RMSEA= root mean square error of approximation; CFI= comparative fit index; CI = 90% confidence interval; TLI = Tucker Lewis Index.