O R I G I N A L R E S E A R C H
Prediction Of Serum Digoxin Concentration
Using Estimated Glomerular Filtration Rate In
Thai Population
This article was published in the following Dove Press journal: International Journal of General Medicine
Orawan Sae-lim 1 Thitima Doungngern 1 Siriluk Jaisue2
Sirichai Cheewatanakornkul3 Poukwan Arunmanakul4 Sirirat Anutrakulchai5 Rungsrit Kanjanavanit6 Wibul Wongpoowarak7
1Department of Clinical Pharmacy, Faculty of Pharmaceutical Sciences, Prince of Songkla University, Songkhla, Thailand;2Division of Clinical Pharmacy, Faculty of Pharmaceutical Sciences, Khon Kaen University, Khon Kaen, Thailand; 3Division of Cardiology, Department of Internal Medicine, Faculty of Medicine, Prince of Songkla University, Songkhla, Thailand;4Department of Pharmaceutical Care, Faculty of Pharmacy, Chiang Mai University, Chiang Mai, Thailand; 5Division of Nephrology, Department of Medicine, Faculty of Medicine, Khon Kaen University, Khon Kaen, Thailand; 6Division of Cardiology, Department of Internal Medicine, Faculty of Medicine, Chaing Mai University, Chiang Mai, Thailand;7Department of Pharmaceutical Technology, Faculty of Pharmaceutical Sciences, Prince of Songkla University, Songkhla, Thailand
Purpose: Serum digoxin concentration (SDC) monitoring may be unavailable in some healthcare settings. Predicted SDC comes into play in the efficacy and toxicity monitoring of digoxin. Renal function is the important parameter for predicting SDC. This study was conducted to compare measured and predicted SDC when using creatinine clearance (CrCl) from Cockcroft–Gault (CG) equation and estimated glomerularfiltration rate (eGFR) calcu-lated from CKD-Epidemiology Collaboration (CKD-EPI), re-expressed Modification of Diet in Renal Disease (Re-MDRD4), Thai-MDRD4, and Thai-eGFR equations in Sheiner’s and Konishi’s pharmacokinetic models.
Patients and methods:In this retrospective study, patients with cardiovascular disease with a steady-state of SDC within 0.5–2.0 mcg/L were enrolled. CrCl and studied eGFR adjusted for body surface area (BSA) were used in the models to determine the predicted SDC. The discrepancies of the measured and the predicted SDC were analyzed and compared.
Results:One hundred and twenty-four patients ranging in age from 22 to 88 years (median 60 years, IQR 50.2, 69.2) were studied. Their serum creatinine ranged from 0.40 to 1.80 mg/dL (median 0.90 mg/dL, IQR 0.79, 1.10). The mean±SD of measured SDC was 1.12±0.34 mcg/L. In the Sheiner’s model, the mean predicted SDC was calculated by using the CG and the BSA adjusted CKD-EPI equations and was not different when compared with the measured levels (1.10±0.36 mcg/L (p=0.669) and 1.08±0.42 mcg/L (p=0.374), respectively). The CG, CKD-EPI, and Re-MDRD4 equations were a betterfit for patients with creatinine≥0.9 mg/dL for prediction with minimal errors. In the Konishi’s model, the predicted SDC using the CG and the studied eGFR equation was lower than the measured SDC (p<0.05).
Conclusion:In Sheiner’s model, the CG and the BSA adjusted CKD-EPI equations should be used for predicting SDC, especially in patients with serum creatinine ≥0.9 mg/dL. The other studied eGFRs underestimated SDC in both Sheiner’s and Konishi’s model.
Keywords: predicted concentration, digoxin, creatinine clearance, estimated glomerular
filtration rate equation, Cockcroft–Gault equation
Introduction
The Cockcroft–Gault (CG) equation provides an estimation of creatinine clearance (CrCl) in a patient with stable renal function.1CrCl is commonly used for medica-tion dosage adjustment in patients with renal impairment.2–4 The estimated glo-merular filtration rate (eGFR), on the other hand, is widely used to monitor and classify the stage of renal function.2,4Several eGFR equations have been proposed, for example, the Modification of Diet in Renal Disease (MDRD) equation and the
Correspondence: Thitima Doungngern Department of Clinical Pharmacy, Faculty of Pharmaceutical Sciences, Prince of Songkla University Songkhla, 90112, Thailand Tel/Fax +6674428222
Email [email protected]
International Journal of General Medicine
Dove
press
open access to scientific and medical research
Open Access Full Text Article
International Journal of General Medicine downloaded from https://www.dovepress.com/ by 118.70.13.36 on 22-Aug-2020
Chronic Kidney Disease-Epidemiology Collaboration (CKD-EPI) equation. In addition, the Thai-MDRD4 and Thai-eGFR equations have been developed and validated for the Thai population.5Currently, the validity of eGFR-based drug dosing recommendation is limited.6
Digoxin is excreted in the kidney and has a narrow therapeutic index of 0.5–2.0 mcg/L.7 It is approved for treating heart failure and atrialfibrillation.8,9The Digitalis Investigation Group found that a serum digoxin concentra-tion (SDC) greater than 0.9 mcg/L increased the mortality rate in patients with reduced ejection fraction heart failure.10 A higher SDC may be required to control ven-tricular rate in patients with atrial fibrillation. However, a recent study in patients with atrialfibrillation revealed an increase in risk of death if SDC is more than 1.2 mcg/L.11 Thus, closely monitoring SDC is required to optimize therapeutic effects and avoid toxicity. However, SDC monitoring may not be available in all healthcare settings. The prediction of SDC using the digoxin pharmacokinetic model may come into play in efficacy and toxicity mon-itoring. Several pharmacokinetic models were developed to predict SDC; for example, Sheiner et al proposed the equation for predicting serum digoxin clearance in patients with and without heart failure.7 Konishi et al developed a simple equation to predict SDC in patients with heart failure,12 and it has recently been studied in Thai population.13The important parameter of these pharmaco-kinetic models is the renal function, where the CrCl esti-mated by the CG equation is recommended.7The eGFRs, on the other hand, have not been studied for predicting SDC.7,14 Therefore, this study was conducted to compare the measured SDC with the predicted SDC when using the CrCl and eGFR calculated from various equations includ-ing CKD-EPI, re-expressed 4 variable MDRD (Re-MDRD4), Thai-MDRD4 and Thai-eGFR in the Konishi’s and Sheiner’s pharmacokinetic models.
Materials And Methods
Study Design And Setting
A multicenter, retrospective medical chart review study was conducted in three university-based hospitals in Thailand including Songklanagarind Hospital, Srinagarind Hospital, and Maharaj Nakorn Chaingmai Hospital. The Institution Review Board (IRB) of each institute approved the study protocol; the number of the Institution Review Board from all three hospitals were 58-011-19-9, HE-581138, and NONE-2558-02832,
respectively. Due to the retrospective nature of the study, the patient consent was waived by the IRBs. This study was conducted in accordance with the Declaration of Helsinki. We confirmed that the data were maintained with confidentiality.
Patient Selection And Data Collection
The study population was patients age 18 years or older who had SDC measured from January 2012 to December 2015. Patients were included in the study if they were taking digoxin tablets orally in a dose that has remained unchanged for at least 14 days, and had obtained SDC for at least 6 hrs but not more than 24 hrs after the last digoxin dose. Exclusion criteria were having SDC less than 0.5 mcg/L or greater than 2.0 mcg/L, being diagnosed with hypothyroidism or hyperthyroidism, acute kidney injury, requiring renal replacement therapy, and having received medications that effect SDC (eg, amiodarone, verapamil, quinidine, rifampicin) within 1 month. Patient information was retrospectively reviewed from a computer-based patient recording system. Clinical-related data including age, gender, weight, height, serum creatinine, serum albumin, medical history, and concurrent medication use were collected. The body weight, height and serum creatinine were collected on the same day or within 3 months of SDC monitoring. Digoxin-specific information collected in this study include the dosage regimen of digoxin, the timing of digoxin administration, and the schedule of obtaining SDC levels.
The AxSYM®Digoxin III assay (Abbott Laboratories, IL, USA), using the microparticle enzyme immunoassay (MEIA) technique, was used to measure SDC levels. The enzymatic creatinine assay (Roche, Basel, Switzerland) was used to measure serum creatinine levels. All study settings used the same techniques for analysis. The esti-mated digoxin clearance of each patient calculated as follows:
Estimated digoxin clearance ðCldigoxinÞ ¼
ðSFD=τÞ measured SDC (1)
S corresponds to the active fraction of the administered form (digoxin = 1 because digoxin is not administered as a salt), F is the bioavailability of digoxin (digoxin tablet = 0.7), D is the digoxin daily dose (mcg/day) and τ is the dosing interval.7
International Journal of General Medicine downloaded from https://www.dovepress.com/ by 118.70.13.36 on 22-Aug-2020
Estimated Renal Function
Creatinine clearance was estimated from the patient’s serum creatinine using CG equation. The eGFR was esti-mated by using the CKD-EPI equation, the Re-MDRD4 equation, the Thai-MDRD4 equation, and the Thai-eGFR equation as follows:
CG equation1
CrClðmL=minÞ¼f½ð140ageÞ actual body weight=
ð72ScrÞg 0:85ðif femaleÞ (2)
CKD-EPI equation15
Male:if Scr0:9mg=dL;eGFRðmL=min=1:73m2Þ
¼141 ðScr=0:9Þð0:411Þ0:993Age
if Scr >0:9mg=dL;eGFRðmL=min=1:73m2Þ
¼141 ðScr=0:9Þð1:209Þ0:993Age
Female:if Scr0:7mg=dL;eGFRðmL=min=1:73m2Þ
¼144 ðScr=0:7Þð0:329Þ0:993Age
if Scr>0:7mg=dL;eGFRðmL=min=1:73m2Þ
¼144 ðScr=0:7Þð1:209Þ0:993Age (3)
Re-MDRD4 equation16
eGFRðmL=min=1:73m2Þ ¼175Scrð1:154Þageð0:203Þ
0:742ðif femaleÞ
(4)
Thai-MDRD4 equation5
eGFRðmL=min=1:73m2Þ ¼175Scrð1:154Þageð0:203Þ
1:1290:742ðif femaleÞ (5)
Thai-eGFR equation5
eGFRðmL=min=1:73m2Þ ¼375:53Scrð0:848Þ
Ageð0:364Þ0:712ðif femaleÞ (6)
Scr corresponds to the patient’s serum creatinine. The eGFRs computed from equation 3–6 were adjusted for body surface area to convert eGFR to mL/min.
Predicted Serum Digoxin Concentration
Konishi’s Model12
The predicted SDC at steady-state (Css) of Konishi’s digoxin pharmacokinetic model was determined as follows:12
Predicted Cssðmcg=LÞ ¼ doseðmcg=dÞ
½2:22CrClðmL=minÞþ25:7 (7)
The CrCl, calculated from the CG equation, was replaced by the adjusted eGFRs calculated from equations 3–6 in the model.
Sheiner’s Model7
The predicted digoxin clearance (Cldigoxin) in patient with
and without heart failure calculated from equation 8 and 9, respectively.7The CrCl was replaced by the eGFR calcu-lated from Equations 3–6. After that the predicted patient’s SDC at a steady-state was calculated from Equation 10.
Predicted Cldigoxin in patients with heart failure ¼ ½ð0:3mL=kg=minÞ actual body weightðkgÞ
þ½0:9CrCl ðmL=minÞ
(8)
Predicted Cldigoxinin patients without heart failure¼ ½ð0:8mL=kg=minÞ actual body weightðkgÞ
þCrCl ðmL=minÞ
(9)
Predicted Cssðmcg=LÞ ¼ ðSFD=τÞ Predicted Cldigoxin
(10)
S corresponds to the active fraction of the digoxin (1), F is the bioavailability of digoxin tablet (0.7), D is the digoxin daily dose (mcg/day) andτis the dosing interval.7
Statistical Analysis
The difference of the measured and the predicted SDC were analyzed using a pairedt-test with a two-sided significance level of p<0.05. An unpairedt-test was used to compare the two different patient groups. Degree of agreement of the measured values and the predicted values was assessed by the mean of difference between the measured values with the predicted values (mean prediction error, ME) and the mean absolute deviation between the measured and pre-dicted values (mean absolute prediction error, MAE). The modified Bland–Altman plot was used to show the differ-ence between the measured SDC and the ME when the studied eGFR equations were used for prediction.
International Journal of General Medicine downloaded from https://www.dovepress.com/ by 118.70.13.36 on 22-Aug-2020
Results
A total of 124 patients were enrolled in this study. Sixty-four patients (51.6%) were 60 years or older and had a median serum creatinine of 0.9 mg/dL (Table 1). Forty-seven patients (37.9%) were underweight (body mass index <20 kg/m2) and 24 patients (19.4%) were overweight (body mass index >25 kg/m2). Among 55 patients who were diagnosed with heart failure, 23 of these patients (41.8%) had acute decom-pensated heart failure when SDC was measured.
Estimated Renal Function
The adjusted eGFR for body surface area estimated by the studied equations were significantly higher than the CrCl estimated by the CG equation (Table 2).
Measured Serum Digoxin Concentration
And Estimated Digoxin Clearance
The mean measured SDCs of patients with heart failure (n = 55) and without heart failure (n = 69) were 1.13 ± 0.35 and 1.11 ± 0.34 mcg/L, respectively. The mean estimated digoxin clearance of all patients was 92.92 ± 40.41 L/day. Patients with heart failure had a slightly lower estimated digoxin clearance than those without heart failure (86.96 ± 36.07 vs 97.66 ± 43.24 L/day, p = 0.141 using unpairedt-test).
Predicted Serum Digoxin Concentration
Konishi’s Model
The mean predicted SDC of all patients calculated by using the CG and the studied eGFR equations was signifi -cantly lower than the measured level (Table 3). In patients with heart failure, the predicted SDC was also under-prediction.
Sheiner’s Model
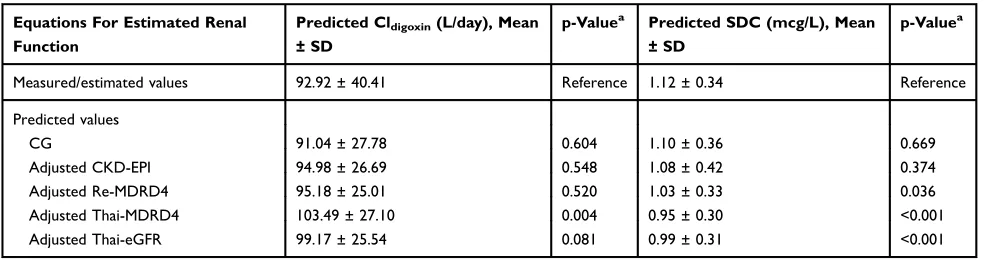
The mean predicted SDC calculated by using the CG and the adjusted CKD-EPI equations was not different as compared with the measured values. Whereas the predicted SDC using the Re-MDRD4, the Thai-MDRD4, and the Thai-eGFR equations was significantly lower than the measured values (Table 4). The mean prediction SDC error was lowest when the CG equation was used for prediction but the mean absolute prediction error was not different from the other equations (Table 5). The prediction error was slightly lower in the group of Thai-eGFR.
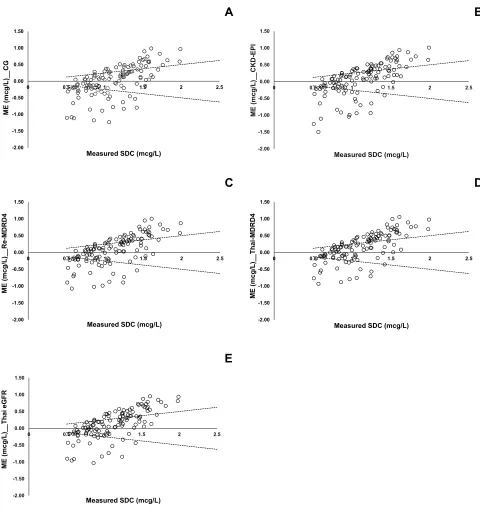
Figure 1 shows the distribution of prediction errors using the Sheiner’s model. The prediction error was low
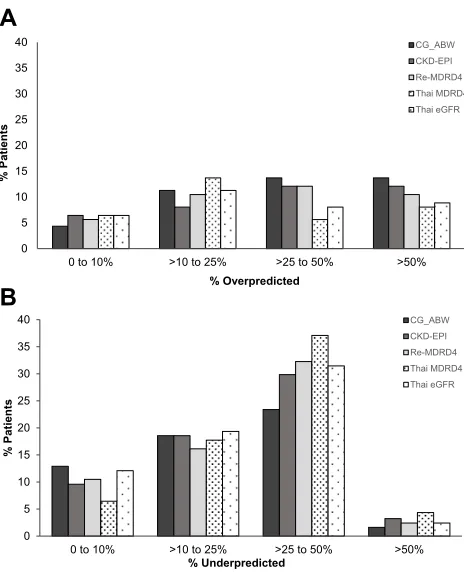
if the measured levels were less than 1.0 mcg/L. Predicted SDC using the Thai-MDRD4 equation and the Thai-eGFR equation had the highest prediction error. Figure 2 shows the percent prediction errors. The majority of predicted SDC were underpredicted. If we divided the patients into two groups according to serum creatinine levels, the CG equation, the CKD-EPI
Table 1 Baseline Characteristics Of Patients Included In The Study (n = 124)
Baseline Characteristics Mean ± SD Or
Number (%)
Range
Female 62 (50.0%)
Age (year) 59.2 ± 13.8 22.0–88.0
Actual body weight (kg) 54.7 ± 11.1 34.0–85.0 Body mass index (kg/m2) 21.6 ± 3.6 14.6–30.4
Body surface area (m2) 1.55 ± 0.18 1.15–2.02 <1.73 m2 102 (82.3%)
≥1.73 m2 22 (17.7%)
Serum albumin (g/dL) 3.78 ± 0.58 2.40–4.70
Serum creatinine (mg/dL) 0.95 ± 0.27 0.40–1.80 eGFR* (mL/min/1.73 m2) 80.3 ± 21.0 34. 6–127.5
≥90.0 40 (32.3%)
60.0–89.9 56 (45.2%) 30.0–59.9 28 (22.6%)
Digoxin daily dose (mcg/kg/ day)
2.54 ± 0.86 1.04–6.94
62.5 mcg/day 4 (3.2%) 125 mcg/day 109 (87.9%) 250 mcg/day 11 (8.9%)
Serum digoxin concentration (mcg/L)
1.12 ± 0.34 0.51–1.99
≥0.50–1.00 52 (41.9%) >1.00–1.50 53 (42.7%) >1.50–2.00 19 (15.3%)
Indications of digoxin
Atrialfibrillation 67 (54.0%) Heart failure 31 (25.0%) Heart failure with atrial
fibrillation
24 (19.4%)
Pulmonary hypertension 2 (1.61%) Underlying diseases
Diabetes mellitus 15 (12.1%) Ischemic heart disease 16 (12.9%) Cerebrovascular disease 15 (12.1%) Valvular heart disease 74 (59.7%)
Note:*eGFR calculated from the CKD-EPI equation.
International Journal of General Medicine downloaded from https://www.dovepress.com/ by 118.70.13.36 on 22-Aug-2020
equation, and the Re-MDRD4 equation were better fit for the group with serum creatinine ≥0.9 mg/dL to predict SDC with minimal prediction errors as compared to the measured values (Table 6). However, in the group
that had serum creatinine less than 0.9 mg/dL only the CG equation could be used for prediction.
Discussion
Renal function was a key parameter for prediction of serum digoxin concentration in the Konishi’s and
Table 2 Comparison Of Creatinine Clearance And Adjusted eGFR For Body Surface Area (n = 124)
Equations for
Estimated Renal
Function
Mean ± SD Range p-Valuea
Creatinine clearance (mL/min)
CG 63.39 ± 23.68 25.53–131.40 Reference eGFR (mL/min)
Adjusted CKD-EPI 70.21 ± 20.19 28.63–124.35 <0.001 Adjusted Re-MDRD4 67.66 ± 20.86 28.28–123.51 <0.001 Adjusted Thai-MDRD4 76.39 ± 23.56 31.92–139.45 <0.001 Adjusted Thai-eGFR 71.90 ± 21.29 33.11–139.67 <0.001
Note:a
using pairedt-test.
Abbreviations: CG, Cockcroft-Gault; CKD-EPI, Chronic Kidney Disease-Epidemiology Collaboration; eGFR, Estimated glomerularfiltration rate; MDRD4, Modification of Diet in Renal Disease.
Table 3Predicted Serum Digoxin Concentration Using The Konishi’s Model (n = 124)
Equations For Estimated Renal Function Predicted SDC (mcg/L), Mean ± SD
All Patients (n = 124) p-Valuea HF Patients (n = 55) p-Valuea
Measured values 1.12 ± 0.34 Reference 1.13 ± 0.35 Reference
Predicted values
CG 0.87 ± 0.33 <0.001 0.76 ± 0.25 <0.001
Adjusted CKD-EPI 0.78 ± 0.27 <0.001 0.69 ± 0.22 <0.001
Adjusted Re-MDRD4 0.80 ± 0.27 <0.001 0.71 ± 0.24 <0.001
Adjusted Thai-MDRD4 0.73 ± 0.25 <0.001 0.65 ± 0.22 <0.001
Adjusted Thai-eGFR 0.76 ± 0.24 <0.001 0.67 ± 0.21 <0.001
Note:ausing pairedt-test.
Abbreviations: CG, Cockcroft-Gault; CKD-EPI, Chronic Kidney Disease-Epidemiology Collaboration; eGFR, estimated glomerularfiltration rate; HF, heart failure; MDRD4, Modification of Diet in Renal Disease; SDC, serum digoxin concentration.
Table 4Predicted Digoxin Clearance And Serum Digoxin Concentration Using The Sheiner’s Model (n = 124)
Equations For Estimated Renal Function
Predicted Cldigoxin(L/day), Mean
± SD
p-Valuea Predicted SDC (mcg/L), Mean
± SD
p-Valuea
Measured/estimated values 92.92 ± 40.41 Reference 1.12 ± 0.34 Reference
Predicted values
CG 91.04 ± 27.78 0.604 1.10 ± 0.36 0.669
Adjusted CKD-EPI 94.98 ± 26.69 0.548 1.08 ± 0.42 0.374
Adjusted Re-MDRD4 95.18 ± 25.01 0.520 1.03 ± 0.33 0.036
Adjusted Thai-MDRD4 103.49 ± 27.10 0.004 0.95 ± 0.30 <0.001
Adjusted Thai-eGFR 99.17 ± 25.54 0.081 0.99 ± 0.31 <0.001
Note:a
using pairedt-test.
Abbreviations:CG, Cockcroft-Gault; CKD-EPI, Chronic Kidney Disease-Epidemiology Collaboration; Cl, clearance; eGFR, estimated glomerularfiltration rate; MDRD4, Modification of Diet in Renal Disease; SDC, serum digoxin concentration.
Table 5 Predictive Performance Of The Studied Equations To Estimated Serum Digoxin Concentration Using The Sheiner’s Model (n = 124)
Equations For Estimated Renal Function
ME (mcg/L), Mean ± SD
MAE (mcg/L), Mean ± SD
CG 0.02 ± 0.45 0.36 ± 0.38
Adjusted CKD-EPI 0.04 ± 0.51 0.37 ± 0.29 Adjusted Re-MDRD4 0.08 ± 0.43 0.35 ± 0.26 Adjusted Thai-MDRD4 0.16 ± 0.42 0.36 ± 0.26 Adjusted Thai-eGFR 0.13 ± 0.42 0.34 ± 0.27
Abbreviations: CG, Cockcroft-Gault; CKD-EPI, Chronic Kidney Disease-Epidemiology Collaboration; eGFR, estimated glomerular filtration rate; MAE, mean absolute prediction errors; MDRD4, Modification of Diet in Renal Disease; ME, mean prediction error.
International Journal of General Medicine downloaded from https://www.dovepress.com/ by 118.70.13.36 on 22-Aug-2020
Sheiner’s model.7,12 Both models recommended using creatinine clearance estimated from the CG equation. The CG equation was developed from the study of creatinine excretion in patients with an average weight of 72 kg and stable renal function.1 While the studied
eGFRs were developed from the clearance of exogenous
filtration markers such as 125I-iothalamate and 99 mTc-DTPA.5,15,16 The Re-MDRD4 equation was developed from patients with chronic kidney disease,16therefore, it may be notfit for patients with normal renal function.15
A
B
C
D
E
-2.00-1.50 -1.00 -0.50 0.00 0.50 1.00 1.50
0 0.5 1 1.5 2 2.5
G
C
_
_)
L/
g
c
m(
E
M
Measured SDC (mcg/L) -2.00
-1.50 -1.00 -0.50 0.00 0.50 1.00 1.50
0 0.5 1 1.5 2 2.5
ME (mcg/L)__CKD
-EPI
Measured SDC (mcg/L)
-2.00 -1.50 -1.00 -0.50 0.00 0.50 1.00 1.50
0 0.5 1 1.5 2 2.5
e
R
_
_)
L/
g
c
m(
E
M-M
D
R
D
4
Measured SDC (mcg/L) -2.00
-1.50 -1.00 -0.50 0.00 0.50 1.00 1.50
0 0.5 1 1.5 2 2.5
ME (mcg/L)__Thai
-MDRD4
Measured SDC (mcg/L)
-2.00 -1.50 -1.00 -0.50 0.00 0.50 1.00 1.50
0 0.5 1 1.5 2 2.5
R
F
G
e
i
a
h
T
_
_)
L/
g
c
m(
E
M
Measured SDC (mcg/L)
Figure 1Modified Bland–Altman plot between the measured SDC and the mean prediction error (ME) using the Sheiner’s model. (A) CG equation, (B) adjusted CKD-EPI equation, (C) adjusted Re-MDRD4 equation, (D) adjusted Thai-MDRD4 equation, and (E) adjusted ThaieGFR equation.
Note:A dashed line shows 25% prediction error.
Abbreviations:CG, Cockcroft–Gault; CKD-EPI, Chronic Kidney Disease-Epidemiology Collaboration; eGFR, estimated glomerularfiltration rate; MDRD4, Modification of Diet in Renal Disease; ME, mean prediction error; SDC, serum digoxin concentration.
International Journal of General Medicine downloaded from https://www.dovepress.com/ by 118.70.13.36 on 22-Aug-2020
The CKD-EPI equation was developed from patients with or without chronic kidney disease, so that it was more accurate than the Re-MDRD4 equation to predict renal function, especially in those patients with GFR > 60 mL/min/1.73 m2.15 Thus, the CKD-EPI equation became accepted among healthcare providers and used
for classification and staging of chronic kidney disease.17However, the Re-MDRD4 equation and CKD-EPI equation were reported to overestimate the renal function as compared with the CG equation.3,18 Similar to our study, the studied eGFR, adjusted for body sur-face area, were significantly overestimated as compared with the CrCl estimated by the CG equation. The Thai-MDRD4 equation and Thai-eGFR equation were pro-posed for use in Thai population with chronic kidney disease. To our knowledge, both equations had not been studied for drug dosage adjustment. This study revealed that the Thai-MDRD4 equation and Thai-eGFR equation should not be used for prediction of SDC with the Konishi’s and the Sheiner’s model.
Our study found that the Konishi’s model signifi -cantly underpredicted SDC by approximately 1.3-fold as compared to the measured SDC (mean error of 0.25 ± 0.44 mcg/L) when the CG equation was used for prediction. The Konishi’s model was developed for pre-dicting SDC in patients with stable heart failure. Patients with acute illness were excluded from the model.12 Our study, on the other hand, did include patients with both stable and unstable heart failure con-ditions. We also included patients who had been taking digoxin for treatment of atrialfibrillation and pulmonary hypertension into the study. The subgroup analysis of our results in patients with stable heart failure (n = 38) continued to find the underpredicted SDC (measured SDC 1.17 ± 0.14 vs predicted SDC by using CG equa-tion 0.76 ± 0.26 mcg/L, p < 0.001). In contrast, the recent study of Jiratham-Opas et al who found that using the CG equation by Konishi’s model was better in predicting SDC in Thai patients. This study reported
A
B
0 5 10 15 20 25 30 35 400 to 10% >10 to 25% >25 to 50% >50%
st
n
ei
t
a
P
%
% Overpredicted
CG_ABW CKD-EPI Re-MDRD4 Thai MDRD4 Thai eGFR
0 5 10 15 20 25 30 35 40
0 to 10% >10 to 25% >25 to 50% >50%
st
n
ei
t
a
P
%
% Underpredicted
CG_ABW CKD-EPI Re-MDRD4 Thai MDRD4 Thai eGFR
Figure 2Distribution of percent predicted SDC errors with the use of Sheiner’s model (n = 124). (A) % overpredicted SDC and (B) % underpredicted SDC.
Note:% prediction error = [(measured SDC–predicted SDC)/measured SDC] x 100
Abbreviations: CG, Cockcroft–Gault; CKD-EPI, Chronic Kidney Disease-Epidemiology Collaboration; eGFR, estimated glomerularfiltration rate; MDRD4, Modification of Diet in Renal Disease; SDC, serum digoxin concentration.
Table 6Predicted Serum Digoxin Concentration Divided By Serum Creatinine Using The Sheiner’s Model (n = 124)
Equations For Estimated Renal Function
Scr < 0.9 mg/dL (n = 56) Scr≥0.9 mg/dL (n = 68)
Predicted SDC (mcg/L), Mean ± SD
p-Valuea Predicted SDC (mcg/L),
Mean ± SD
p-Valuea
Measured values 1.10 ± 0.34 Reference 1.14 ± 0.35 Reference
Predicted values
CG 1.00 ± 0.29 0.138 1.18 ± 0.41 0.421
Adjusted CKD-EPI 0.94 ± 0.27 0.011 1.17 ± 0.48 0.604
Adjusted Re-MDRD4 0.94 ± 0.26 0.008 1.12 ± 0.36 0.713
Adjusted Thai-MDRD4 0.85 ± 0.24 <0.001 1.03 ± 0.33 0.039
Adjusted Thai-eGFR 0.94 ± 0.27 0.011 1.03 ± 0.33 0.031
Note:ausing pairedt-test.
Abbreviations:CG, Cockcroft–Gault; CKD-EPI, Chronic Kidney Disease-Epidemiology Collaboration; eGFR, estimated glomerularfiltration rate; MDRD4, Modification of Diet in Renal Disease; Scr, serum creatinine; SDC, serum digoxin concentration.
International Journal of General Medicine downloaded from https://www.dovepress.com/ by 118.70.13.36 on 22-Aug-2020
the sensitivity and specificity of Konishi’s model to be 72.7% and 80.6%, respectively. The Konishi’s model was appropriate to predict SDC, especially in patients with reduced ejection fraction heart failure (correlation coefficient of 0.80). However, 63.2% of the measured SDC in that study was subtherapeutic (< 0.5 mcg/L),13 that was not included in our study.
The Sheiner’s model, on the other hand, was found to be more suitable to predict SDC in our study. The CrCl esti-mated by the CG equation was the bestfit to predict SDC since it showed the minimum prediction error. Our result was similar to the study of Vazquez–Hernandez et al who found the predicted SDC using the CG and the Re-MDRD4 equa-tion with the Sheiner’s model had a deviation of more than 15% in patients with heart failure.19 Besides the CrCl, the adjusted CKD-EPI equation for body surface area could be used for prediction of SDC, especially in those patients with serum creatinine ≥0.9 mg/dL. The Re-MDRD4 equation could also be used for prediction if serum creatinine was
≥0.9 mg/dL. However, it was not recommended if serum creatinine < 0.9 mg/dL. Serum creatinine generation could be reduced in the setting of low muscle mass,20,21therefore it could overpredict renal function. If CrCl increases, SDC may decrease. This could explain ourfinding of underprediction of SDC in patients with serum creatinine < 0.9 mg/dL.
The CrCl estimated by the CG equation is commonly recommended for drug dosage adjustment.22 The eGFR, especially estimated by the CKD-EPI equation, usually reports in clinical setting for classifying chronic kidney disease and staging of renal function. The eGFR presents in the unit of mL/min/1.73 m2whereas the CrCl presents in mL/min. The use of the adjusted CKD-EPI equation for body surface area (change to mL/min) had a great rate of concordance with the CG equation reported by Khanal et al23 and Okparavero et al.24 Similar to our study, the CKD-EPI with adjustment for body surface area was appropriate for prediction of SDC, especially in the patients with serum creatinine≥0.9 mg/dL.
There were some limitations in this study which may affect the results. The study was performed retrospec-tively; therefore, the compliance to digoxin therapy could not be verified. The results could be applied to patients who had serum digoxin concentration within the therapeu-tic range of 0.5–2.0 mcg/L. Finally, even though we did not obtain the trough SDC (before the next dose), the median time of blood drawn was 23 hrs (ranging from 8 to 24 hrs). Therefore, we believe that the time difference could have little effect on SDC in our study.
Conclusion
The CrCl estimated by the CG equation continues to be the key parameter for predicting SDC with the Sheiner’s pharmacokinetic model. The adjusted CKD-EPI equation for body surface area can also be used for the prediction of SDC, especially in patients with serum creatinine ≥0.9 mg/dL. However, the CKD-EPI equation should be used with caution when predicting serum digoxin concentration when serum creatinine <0.9 mg/dL. The MDRD4 equation and the Thai-eGFR equation should not be used for prediction of serum digoxin concentration.
Acknowledgments
This study was funded by a research grant of the Faculty of Pharmaceutical Sciences, Prince of Songkla University, Thailand. The authors would like to thank Ms Arnurai Jitsurong and other technicians for acquisition of data and Ms Maria Suzanne Mullet for reviewing the manuscript.
Disclosure
The author reports no conflicts of interest in this work.
References
1. Cockcroft DW, Gault MH. Prediction of creatinine clearance from serum creatinine.Nephron.1976;16(1):31–41. doi:10.1159/000180580 2. Hudson JQ, Nyman HA. Use of estimated glomerularfiltration rate for drug dosing in the chronic kidney disease patient.Curr Opin Nephrol Hypertens.2011;20(5):482–491. doi:10.1097/MNH.0b013e328348c11f 3. Nyman HA, Dowling TC, Hudson JQ, Peter WL, Joy MS, Nolin TD.
Comparative evaluation of the Cockcroft-Gault Equation and the Modification of Diet in Renal Disease (MDRD) study equation for drug dosing: an opinion of the Nephrology Practice and Research Network of the American College of Clinical Pharmacy.Pharmacotherapy.2011;31 (11):1130–1144. doi:10.1592/phco.31.11.1130
4. Park EJ, Wu K, Mi Z, et al. A systematic comparison of cockcroft-gault and modification of diet in renal disease equations for classification of kidney dysfunction and dosage adjustment. Ann Pharmacother.2012;46(9):1174–1187. doi:10.1345/aph.1Q757 5. Praditpornsilpa K, Townamchai N, Chaiwatanarat T, et al. The need
for robust validation for MDRD-based glomerularfiltration rate esti-mation in various CKD populations.Nephrol Dial Transplant.2011;26 (9):2780–2785. doi:10.1093/ndt/gfq815
6. Hudson JQ, Nolin TD. Pragmatic use of kidney function estimates for drug dosing: the tide is turning.Adv Chronic Kidney Dis. 2018;25 (1):14–20. doi:10.1053/j.ackd.2017.10.003
7. Winter M. Digoxin. In: Winter M, editor. Basic Clinical Pharmacokinetics. 5th ed. Philadelphia: Lippincott Williams and Wilkins;2010:198–239.
8. January CT, Wann LS, Calkins H, et al. 2019 AHA/ACC/HRS Focused Update of the 2014 AHA/ACC/HRS guideline for the management of patients with atrial fibrillation: a report of the American College of Cardiology/American Heart Association Task Force on Clinical Practice Guidelines and the Heart Rhythm Society.J Am Coll Cardiol.2019;74:104–132.
International Journal of General Medicine downloaded from https://www.dovepress.com/ by 118.70.13.36 on 22-Aug-2020
9. Yancy CW, Jessup M, Bozkurt B, et al. 2013 ACCF/AHA guideline for the management of heart failure: a report of the American College of Cardiology Foundation/American Heart Association Task Force on practice guidelines. Circulation. 2013;128(16):e240–327. doi:10.11 61/CIR.0b013e31829e8776
10. Digitalis Investigation G. The effect of digoxin on mortality and morbidity in patients with heart failure.N Engl J Med.1997;336 (8):525–533. doi:10.1056/NEJM199702203360801
11. Lopes RD, Rordorf R, De Ferrari GM, et al. Digoxin and mortality in patients with atrial fibrillation. J Am Coll Cardiol. 2018;71 (10):1063–1074. doi:10.1016/j.jacc.2017.12.060
12. Konishi H, Shimizu S, Chiba M, Minouchi T, Koida M, Yamaji A. Predictive performance of serum digoxin concentration in patients with congestive heart failure by a hyperbolic model based on creati-nine clearance. J Clin Pharm Ther. 2002;27(4):257–265. doi:10. 1046/j.1365-2710.2002.00418.x
13. Jiratham-Opas J, Kanjanavanit R, Wongcharoen W, et al. Can available mathematical models predict serum digoxin levels in Thai patients? J Clin Pharm Ther. 2018;43(3):377–384. doi.org/ 10.1111/jcpt.12667
14. Gheorghiade M, Adams KF Jr., Colucci WS. Digoxin in the management of cardiovascular disorders. Circulation. 2004;109 (24):2959–2964. doi:10.1161/01.CIR.0000132482.95686.87 15. Levey AS, Stevens LA, Schmid CH, et al. A new equation
to estimate glomerularfiltration rate.Ann Intern Med.2009 ;150-(9):604–612. doi:10.7326/0003-4819-150-9-200905050-00006 16. Levey AS, Bosch JP, Lewis JB, Greene T, Rogers N, Roth D. A more
accurate method to estimate glomerularfiltration rate from serum creatinine: a new prediction equation. Modification of Diet in Renal Disease Study Group. Ann Intern Med. 1999;130(6):461–470. doi:10.7326/0003-4819-130-6-199903160-00002
17. Kidney Disease: improving Global Outcomes (KDIGO) CKD Work Group. KDIGO 2012 clinical practice guideline for the evaluation and management of chronic kidney disease.Kidney Int.2013;3(1):5–14. 18. Michels WM, Grootendorst DC, Verduijn M, Elliott EG, Dekker FW,
Krediet RT. Performance of the Cockcroft-Gault, MDRD, and new CKD-EPI formulas in relation to GFR, age, and body size.Clin J Am Soc Nephrol.2010;5(6):1003–1009. doi:10.2215/CJN.06870909 19. Vazquez-Hernandez M, Bouzas L, Tutor JC. Glomerular filtration
rate estimation using the Cockcroft-Gault and modification of diet in renal disease formulas for digoxin dose adjustment in patients with heart failure. Ups J Med Sci. 2009;114(3):154–159. doi:10.1080/ 03009730903191853
20. Smythe M, Hoffman J, Kizy K, Dmuchowski C. Estimating creati-nine clearance in elderly patients with low serum creaticreati-nine concentrations.Am J Hosp Pharm.1994;51(2):198–204.
21. Thongprayoon C, Cheungpasitporn W, Kashani K. Serum creatinine level, a surrogate of muscle mass, predicts mortality in critically ill patients. J Thorac Dis. 2016;8(5):E305–311. doi: 10.21037/ jtd.2016.03.62
22. McConachie SM, Hanni CM, Raub JN, Kucemba M, Wilhelm SM. National assessment of renal estimation for drug dosing among pharmacists.J Am Coll Clin Pharm.2018;2(3):204–213. doi:10.1002/ jac5.1057
23. Khanal A, Peterson GM, Jose MD, Castelino RL. Comparison of equations for dosing of medications in renal impairment.Nephrology. 2017;22(6):470–477. doi: 10.1111/nep.12834
24. Okparavero AA, Tighiouart H, Krishnasami Z, et al. Use of glomer-ular filtration rate estimating equations for drug dosing in HIV-positive patients.Antivir Ther. 2013;18(6):793–802. doi:10.38 51/IMP2676
International Journal of General Medicine
Dove
press
Publish your work in this journal
The International Journal of General Medicine is an international, peer-reviewed open-access journal that focuses on general and internal medicine, pathogenesis, epidemiology, diagnosis, moni-toring and treatment protocols. The journal is characterized by the rapid reporting of reviews, original research and clinical studies
across all disease areas. The manuscript management system is completely online and includes a very quick and fair peer-review system, which is all easy to use. Visit http://www.dovepress.com/ testimonials.php to read real quotes from published authors.
Submit your manuscript here:https://www.dovepress.com/international-journal-of-general-medicine-journal
International Journal of General Medicine downloaded from https://www.dovepress.com/ by 118.70.13.36 on 22-Aug-2020