CONSIDERATIONS IN ELECTRICITY PRICING:
THE CASE OF EGYPT
BY
ALAA A SARHAN
DEPARTMENT OF ECONOMICS UNIVERSITY COLLEGE LONDON
THESIS SUBMITTED FOR THE DEGREE OF DOCTOR OF PHILOSOPHY
ABSTRACT
This thesis analyses the issue of electricity pricing in the residential sector of Egypt and shows that the upsurge in consumption that took place since the mid Seventies in this particular sector was mainly due to the tariff policies of the government which did not reflect the true economic costs of supply.
Since residential consumers have not been getting cor rect signa 1 s to gu ide consumpt i on dec is ions so far, an a 1 ternat i ve tar iff structure is necessary to prevent the futu re loss of economi c eff i c i ency and assoc i ated soc i a 1 welfare. However, although such a tariff structure will have to satisfy the criterion of economic efficiency, in that it would have to reflect the associated marginal costs, there are other objectives that have to guide electricity tariff
policies, especially in developing countries. The most
the Egyptian government in the last few years, the tariff structures have been unable to raise enough revenue to cover deficits and thus have jeopardized the financial viability and autonomy of the electricity sector.
The last part of this thesis examines several
ACKNOWLEDGMENTS
I would like to express my most sincere gratitude and appreciation to my supervisor, Dr A Markandya, for his encouragement, constructive criticism and useful suggestions throughout this research.
Thanks are also extended to Professor 0 Pearce for his kind guidance and support.
I am also most grateful for the hospitable environment provided by Professor R Blundell.
6
TABLE OF CONTENTS
ABSTRACT . 2
ACKNOWLEDGMENTS TABLE OF CONTENTS
• • • • • 4
• • . . . 6
LIST OF TABLES LIST OF FIGURES
CHAPTER ONE: ENERGY USE AND EFFICIENCY IN EGYPT WITH SPECIFIC REFERENCE TO ELECTRICITY
1. Introduction
. . .
. . .
.
.
.
.
.
. .
2. Impact of oil on the Egyptian economy2.1. Value added
2.2. International trade 2.3. Government finances . .
3. Energy profile of Egypt
. . .
.
.
.
. . . .
3.1. Energy production in Egypt3.2. Primary energy consumption . . . . 3.2.1. Aggregate and per capita consumption. 3.2.2. Domestic consumption by energy type 3.2.3. Demand for fossil fuel by
electricity sector
3.3. Energy consumption vs economic growth
4. Electricity in Egypt . . • . . .
4.1. Electricity supply . . . . . . .
4.2. Demand for electricity
4.3. Electricity and economic development
in Egypt . . . .
1 1
16
20
22
23 27
29
30
30
32 32
38
41
45
49
50
53
4.4. Price and income elasticities of electricity
demand . . . . . . . . 64
4.4.1. Comments on the estimation results 74
4.4.2. Estimation after deletion of price 76
5. Economic efficiency of energy: special reference to electricity
6. Summary and conclusions
APPENDIX Al: TABLES (Al.1) AND (Al.2)
.
.
. .
. . . .
77 8891
CHAPTER TWO: ELECTRICITY PRICING IN DEVELOPING COUNTRIES: ISSUES AND POLICIES
1. Introduction
2. SRMC and LRMC pricing, a review
2.1. Natural monopoly and marginal cost pricing 2.2. Development of literature
2.2.1. Short-run marginal cost 2.2.1. Long-run marginal cost 2.3. Equality of SRMC and LRMC in an
optimal system
. .
.
.
. . .
. . .
.
2.3.1. Conditions of optimality2.4. Efficiency pricing of electricity 2.4.1. Marginal cost and capital
indivisibility
95
97
97
98
99
100
101 103 105
107
2.4.2. Solutions to capital indivisibility. 108 2.4.3. Marginal cost and temporal
variations in costs 2.5. SRMC or LRMC, pros and cons
111
8
3. Electric power pricing in developing countries, an overview
.
. . . .
. .
.
.
.
·
·
. .
3.1- Objectives of electricity tariffs 3.1.1. First objective
3.1.2. Second objective
.
· ·
3.1.3. Third objective
·
· ·
3.2. Details of LRMC tariffs
.
· · · .
.
3.3. Methodology for the calculationof LRMC based tariffs
3.4. Electricity prices and considerations of equity and efficiency
4. Marginal cost estimates of electricity supply in Egypt
5. Summary and conclusions
.
. . .
.
APPENDIX A2: Electricity generation and
119
.
.
.
121122 123 127
·
.
.
130· . . . 131
· . . . 140
142 148
environmental costs
. .
. .
. . .
. . .
154CHAPTER THREE: THE STRUCTURE OF ELECTRICITY SUBSIDIES IN EGYPT
1. Introduction
2. Subsidies in Egypt 2.1. Preamble
2.2. Objectives of subsidy policies 2.3. Types of subsidies
2.4. Economic effects of subsidy policies 2.4.1. Effects on consumption pattern 2.4.2. Effects on production pattern
159
162 162
163
165
2.4.3. Effects on production techniques 171
2.4.4. Effects on government budget deficit 171
2.4.5. Effects on balance of payments
·
· ·
1722.4.6. Effects on income distribution
·
· ·
1733. Energy subsidies in Egypt
. .
. .
.
· . .
·
·
·
1753. 1 . Subsidies in the oil sector
·
· ·
1813.1.1. Financial subsidies
·
. . ·
1813.1.2. Economic implicit subsidies
·
·
·
1813.2. Subsidies structure in the
electricity sector
3.2.1. Industrial subsidy
3.2.2. Residential subsidy
4. Subsidies and electricity prices
·
.
.
.
. .
183
187
199
4.1. Two-step tariff
4.2. Direct subsidies for target groups
· 203
208
· 208
4.3. Extending the scope of public investments 210
4.4. Subsidies on the cost of equipment 211
5. Summary and conclusions
.
.
. . .
.
.
. . 213CHAPTER FOUR: ELECTRICITY TARIFFS IN EGYPT:
PAST AND PRESENT
1. Introduction
. . . .
.
. . . . .
· 2192. Electricity in Egypt: a historical note . . 221
3. Development of electricity consumption in Egypt . . 225
3.1. Consumption by sector · 225
3.2. Consumption by voltage level · 227
10
3.3.1. Consumption: quantity vs value 232
3.4. Consumption per capita and per customer 235
4. Residential electricity tariffs
. . . .
.
. .
· 239 4.1. Average electricity prices and cost4.2. Development of residential tariffs and expenditure
· 239
· . 241
4.3. International comparison . . . . 256
4.4. Electricity expenditure & household income . 260 5. Summary and conclusions
.
. .
.
. .
.
.
.
. . .
.
· 266CHAPTER FIVE: ALTERNATIVE PRICING SCENARIOS: WELFARE IMPLICATIONS
1. Introduction
.
. . . .
.
. . . . .
2. Electricity consumption and expenditure3. Price increase and welfare economics,
a theoretical note
.
. .
. . .
.
. . .
. .
4. Scenarios for alternative tariff structures 4.1. Type 1 scenarios
4.2. Type 2 scenarios
. . .
.
5. Efficiency pricing and welfare loss . . . . 5 . 1. Resu 1 ts . . . . 6. Efficiency and equity considerations
7. Summary and conclusions
.
.
. .
.
. . .
.
.
APPENDIX A5: TABLES (A5.1) - (A5.84)CHAPTER SIX: CONCLUSIONS REFERENCES . . . .
• • 271
• 272
• . 275 280
· 281
· 284 . . • . 284
• • • 291
· 295 . • 309 · • 311
LIST OF TABLES
CHAPTER ONE
1.1 GOP by economic activity in Egypt, at constant
prices (1975 - 1987/88) . . . 24
1.2 Growth of GOP by economic activity (1975 - 81/82, & 1982/83 - 1987/88)
1.3 Value added of economic sectors in the economy (1975 - 1987/88)
. .
.
. .
.
.
. .
. .
.
.
. . .
1.4 The oil sector in Egyptian foreign trade25
26
(1970, 75, 76, & 1979 - 1988) . . . . . 28
1.5 The oil sector & government revenue
(1977 - 80, 1985/86, & 1986/87) . . . . 1.6 Production of commercial energy in Egypt
(1975 - 1987)
.
. .
. . .
. . . . .
.
.
.
.
1.7 Total & PIC primary energy consumption(1975 - 1987/88) . . . .
1.8 Energy intensities for six developing countries
28
31
33
(1981, 83, 85, & 1987) . . . 36
1.9
1.10
1 .11
1.12
Consumption of commercial energy in Egypt (1975 - 1987) . . . • . Consumption of oil products by electricity sector in Egypt (1975, & 1977 - 1987)
Energy ratio & energy intensity in Egypt
(1975 - 1987/88) . . . .
Electricity generation in Egypt (1972 - 1988)
39
42
46
12
1.13 Installed capacity, maximum demand, & capacity
reserve margins in Egypt (1972 - 1988) . . . 52 1.14 Electricity consumption by major economic
sectors in Egypt (1974 - 1987/88) . . . 54
1.15 Total & PIC electricity consumption in Egypt
(1974 - 1988/89) . . . . . . 56
1. 16
1. 17
1.18 1.19
Electricity intensities for six developing countries (1983 - 1986) Electricity ratio & intensity in Egypt (1975 - 1987/88) . . . . . . . . .
Estimation results of the regression equations Estimation results of the regression equations after price deletion
.
.
.
.
.
.
. .
. .
1.20 Transmission efficiency of electricity supply59
61 67
68
in Egypt (1974 - 1988/89) . . . • . 83 1.21 Summary of inefficiencies in energy supply
CHAPTER TWO
Stages of LRMC tariffs
.
.
. .
.
. . .
.
Marginal fuel cost in Egypt2. 1
2.2
2.3 Marginal capacity cost in Egypt
2.4 Marginal cost of electricity supply in Egypt
85
141 145 . . 146
CHAPTER THREE
3.1 Structure of total subsidies in Egypt
(1982/83 - 1986/87) . . . 164
3.2 Summary of some economic effects of various
forms of subsidies introduced in Egypt . . . 176
3.3 Nominal & real prices of energy products
in Egypt (1978 - 1989) · . . . 179
3.4 Index for nominal & real prices of energy
products in Egypt (1978 - 1989) · . . . 180
3.5 Electricity subsidies in Egypt by sector
(1982/83 - 1986/87) · . • . 185
3.6 Sectoral shares in electricity subsidies
in Egypt (1982/83 - 1986/87)
.
. . . .
.
· . 1853.7 Electricity subsidy in Egypt by type of user
& voltage level (1982/83)
· .
.
.
. . .
· . 188 3.8 Electricity subsidy in Egypt by type of user& voltage level (1983/84)
· · · ·
1893.9 Electricity subsidy in Egypt by type of user
& voltage level (1984/85)
·
·
· · · ·
· · ·
190 3.10 Electricity subsidy in Egypt by type of user& voltage level (1985/86)
·
·
· ·
·
·
· ·
·
191 3.11 Electricity subsidy in Egypt by type of user& voltage level (1986/87)
·
·
·
·
·
·
· ·
·
192 3.12 Electricity subsidy in Egypt by voltage level(1982/83 - 1986/87)
.
.
. .
. · · ·
· ·
·
·
· ·
1933.13 Price, marginal cost & subsidy /unit of
3.14 Development of electricity subsidy /KWH by sector in Egypt (supplied by Oist Co's),
14
(1982/83 - 1986/87) . . . . 197
3.15 Electricity subsidy / urban & rural
household in Egypt (1981/82) . . . 202
CHAPTER FOUR
4.1 Annual electricity consumption in Egypt
by sector (1980/81 - 1988/89) . . . 226 4.2 Shares of electricity sales in Egypt
by voltage level (1980/81 - 1988/89)
4.3 Electricity supplied by dist co's to different sectors in Egypt (1980/81 - 1988/89)
4.4 Quantity & value of electricity supplied by dist co's to major sectors (1985/86 - 1988/89)
4.5 Total & PIC electricity consumption in Egypt (1980/81 - 1988/89)
. .
.
. . . .
.
.
.
· 228
· 230
233
236 4.6 Residential electricity consumption in Egypt (P/C
& per customer) (1980/81
-
1988/89). · · · ·
·
237 4.7 Average sale price & average cost ofelectricity in Egypt ( 1975
-
1986/87)·
·
· · ·
240 4.8 Residential electricity tariff in Egypt (1975)·
242 4.9 Residential electricity tariff in Egypt (1980)·
243 4.10 Residential electricity tariff rates &expenditure in Egypt ( 1982
-
1984)· · ·
·
·
2454.11 Monthly residential electricity tariff rates &
4.12 Electricity consumption in residential sector & corresponding number of customers /consumption
block in Egypt (1986/87 - 1988/89)
4.13 Marginal electricity tariffs in Egypt,
. 253
Pakistan, Turkey & Nepal (1987) . . . 257 4.14 Annual electricity & kerosene expenditure
per urban & rural HH in Egypt (1981/82) . . . . 261
CHAPTER FIVE
5.1 Electricity consumption in residential sector & corresponding number of customers /consumption
5.2
5.3
5.4
5.5
5.6
block in Egypt (1986/87 - 1988/89) . . . 273
Tariff structures of type scenarios
Tariff structures of type 2 scenarios . . .
Electricity consumption in urban & rural HHs
in Egypt (1988/89) . . . .
Total welfare loss in urban HHs
Total welfare los$ in rural HHs
. .
.
.
.
.
· . 282
· . 285
286
292
LIST OF FIGURES
CHAPTER ONE
1.1
1 .2
1 .3
1.4
1.5
1 .0
1.7
1.8
Total & PIC trend in energy consumption in Egypt
(1975 - 1987) . . . .
PIC energy consumption in selected developing
countries (1981, 83, 85, & 1987) . . . . Energy & electricity intensity in Egypt
(1975 - 1987) . . . .
Energy intensities in developing countries
(1981, 83, 85, t 1987) . . . .
Total & PIC trend in electricity consumption in Egypt (1974 - 1988/89) . . . .
PIC electricity consumption in selected
developing countries (1983 - 1986)
Electricity intensities in selected
developing countries (1983 - 1986)
Growth of energy consumption PIC vs growth of GOP PIC (1975 - 1987) . . . .
CHAPTER THREE
3.1 Growth of real electricity subsidies in Egypt
16
35
37
47
48
58
60
63
80
(1982/83 - 1986/87) . . . 186
3.2 Real growth in sectoral subsidy / KWH
CHAPTER FOUR
4.1 Real residential electricity tariffs in Egypt
(1980, 82, 83, 85, & 1987) . . 252
4.2 Marginal electricity tariffs for Egypt,
Pakistan, Turkey & Nepal (1987) · . . . . 258
CHAPTER FIVE
5.1 Deadweight loss (flat-rate tariff)
.
.
·
2·775.2 Deadweight loss (progressive tariff)
. ·
·
·
2775.3 Change in consumption w. r. t. marginal cost
(urban HH, Sc 1 , T 1 , -0.2 P elasticity)
· · ·
·
297 5.4 Change in consumption w.r.t. marginal cost(urban HH, Sc 1 , T 1 , -0.5 P elasticity)
· · · ·
298 5.5 Change in consumption w.r.t. marginal cost(urban HH, Sc 1 , T 1 , -1.0 P elasticity)
·
· · ·
299 5.6 Change in consumption w.r.t. marginal cost( rura 1 HH, Sc 1 , T 1 , -0.2 P elasticity)
· ·
· ·
300 5.7 Change in consumption w.r.t. marginal cost(rura 1 HH, Sc 1 , T 1 , -0.5 P elasticity)
· · · ·
301 5.8 Change in consumption w.r.t. marginal cost(rura 1 HH, Sc 1 , T 1 , -1 .0 P elasticity)
· ·
· ·
302 5.9 Change in consumption w.r.t. marginal cost(urban HH, Sc 1 , T 2, -0.2 P elasticity)
·
·
· ·
303 5.10 Change in consumption w.r.t. marginal cost(urban HH, Sc 1 , T 2, -0.5 P elasticity)
·
· · ·
304 5.11 Change in consumption w.r.t. marginal cost18
5.12 Change in consumption w. r. t. marginal cost
(rural HH, Sc 1 , T 2, -0.2 P elasticity)
· ·
·
·
306 5.13 Change in consumption w.r.t. marginal cost(rural HH, Sc 1 , T 2, -0.5 P elasticity)
· ·
·
·
307 5.14 Change in consumption w.r.t. marginal cost20
1. Introduction:
In the 1970's, some dramatic and important changes were witnessed in Egypt which affected all aspects of the economy and conditioned, for a long time to come, the social and po 1 it i ca 1 env ironment with in wh i ch the economy has to be managed as well as for the development process to be brought about.
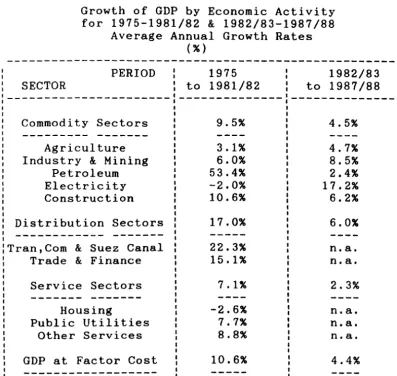
Through the introduction of the open-door economic policy of trade liberalization and private sector incentives, Egypt experienced a period of rapid and significant growth which was reflected in the overall growth rate of real GDP. From the onset of the open-door policy, as shown by Tables
(1.1) and (1.2), an average growth rate in real GDP of 10.6% per annum was realized throughout the period 1975 to 1981/82. However, such a significant rate of growth stands in marked contrast to the weak performance of the previous decade when only less than 3% per annum was achieved from 1966 to 1971 and 5.5% from 1971 to 1975 [62].
availability of foreign exchange resources in Egypt. Several
factors have neverthe 1 ess contri buted to the marked
improvements in the foreign exchange receipts during the second half of 1970's; the four principal factors being:
i) Rapid expansion of oil output especially after the recuperation of the Sinai oil fields in 1979 in addition to exporting significant quantities of crude oil and some refined oil products. This was coupled by massive oil price rises after the Egyptian-Israeli War in 1973 which spurred the proceeds from exports of oil in oil-exporting countries in general.
ii) The re-opening of the Suez Canal for international navigation in 1974 and the completion of a project intended to widen and deepen the waterway, has resulted in a rapid growth in the foreign receipts from its operations.
iii) Remittances of foreign exchange from Egyptians working abroad especially those in the neighbouring oil-rich Arab countries.
iv) The opening of the tourism sector which had grown into an active and promising source of foreign exchange.
22
and explain a great deal of the constraints and opportunities which were imposed upon and-affected the country's economic performance.
Therefore, the main objective of this chapter is to discuss the rapid changes that took place within the Egyptian economy since the mid-Seventies to date within the context of an overall energy profile of Egypt. A much greater attention will nonetheless be given to the electric power sector in Egypt. In the two sections to follow (i.e., sections 2 and 3), we will attempt to place energy in Egypt in its context within the overall economy. In the fourth section, however, the electricity sector will be studied extensively so as to get a much clearer insight into the sector under examination
in this thesis.
2. Impact of oil on the Egyptian economy:
2.1. Value added:
Tab 1 e (1. 1) shows the deve 1 opment of income in various sectors of the Egyptian economy in real terms during the period 1975 to 1987/88. The Table indicates that the contribution of the oil sector to value added has jumped from L.E. 149 million in 1975 to L.E. 1251 million in 1981/82 (at constant 1975 prices) representing an increase of over seven-fold in real terms. As shown in Table (1.2), however, the average growth rate of this sector from 1975 to 1981/82 was 53% which represents the highest growth rate by any sector during that same period. In terms of relative shares, the share of oil in total value added has increased from 2.9% in 1975 to become equal to that of the entire industrial sector in 1981/82 at 13.6% [Table (1.3)].
Nevertheless, as international prices of oil fell
sharply, the significant contribution of the oil sector in total value added has diminished throughout the eighties to become around L.E. 461 million in 1987/88 while its share has dropped to 4.3% [Tables (1.1) & (1.3)]. In fact, Table (1.2) indicates that the oil sector during the period 1982/83 to 1987/88 has achieved a very low average growth rate of 2.4% per annum.
'r'EAfl: 197~ SECTOF~
T.JlIIbl .. (1.1)
GOP by Econo"ic Activity at Constant 197~ Price.
197~ - 1987/68
(L.E. Million)
1976 1977 1978 1979 1980 .... 19E11/ 1962 .... 19·83 ....
19131 19EI2 1983 1984
198"'4 .... 198~.··· 1986 .... 1987 ....
1985 1986 1987 1988
---:---Cc ... c.di t y S .... =tOt-s: 2617 3095 3"'4"18 3~76 "I61~ "17'-=12 "1',"'15 '''1''136 "172':1 6026 "'1768 ~936 521~
---_._- ---:
Agt'-i .=ul t u ... 1·~60 161'i!' 1."213 1689 170f3 1,:-3"j!' 1";='55 1761) 1767 1.913 2091 2151 2217
I.)dus:+':t-'::I 8: Mi ni t"'';I: 668 921 950 975 111-1 115'1 1:2~5~~ 1273 1275 16::10 1609 1726 11356 F·"'~tt"-ol.'..JH : 1"19 4~;:~9 397 "163 1:<:86 1"1 I ' , 1251 9~~3 1171 1 E::;:: 5 "1"13 "134 461
Elec+.:ricity 69 70 70 69 69 5!5 60 65 79 ;~11 118 129 139
C-:.t',:s=t .. ·l.Jcti .:),... 2"'43 259 303 382 "'3;' 379 .:~26 "106 "136 517 ~08 "195 5"12
Oi:Jr.+':"" Sect'jlr"s 1036 1~~61 1"12'" 1650 2065 2295 26"'11 27~2 27':;r~i 3"'112 3263 :5"136 360-"1
---_ ... _-
---Tt-a,.", a: Suez Cat .. : 25E1 371 "'416 509 670 7"'47 1:1-"10 f.~65 837 999 t .... .a .. ,", .. .fit .. t-. .. ·91 ..
T.-.&d ... r:l: Fi "·,.nc ... 7'77 8E:9 1007 11-"11 1395 15"'19 1801 187(' 1959 2"'113 t ... t·, .. .ar .. t·,. -It ..
S.,.-.... i .=-=- Soeci:.:.,.-:,.;: 1209 13!:i9 1403 1315 1360 1522 1'793 177-4 1::)56 20~~O 167;' 1803 1921
---HO'.I:s:ing 209 206 207 19-"1 19-"1 160 175 1,.'0 169 :::~30 n . a . r', .. .a .. .. ... !t ..
Publ i.= Uti li+.:i e$ 19 19 20 20 20 1"'1 23 23 . ..:;"'. -... 30 n ... ,. ... -HI .. n .·a ..
Othet- S.t- .... i .:es 982 113"'1 1177 1101 11-"16 13 "1 F.; 159<~ 1582 166-"1 1321 t ) .. .at .. t', .. .a .. ..., ... !II ..
GOF' F .ac f:(:...- Cosf: 5062 ~71-"1 627!5 65"'13 80-"10 ;::;560 9179 ::i951 9379 11519 9709 10180 10739
---Source: CAPMAS [12J, GOP ~i9ur"'$ de~la~ ... d by ~PI ~.-O" ~h ... :s:a"e re~ ... renc ...
!'IJ
Table (1.2)
Growth of GDP by Economic Activity for 1975-1981/82 & 1982/83-1987/88
Average Annual Growth Rates
PERIOD SECTOR
(% )
1975 to 1981/82
: 1982/83
: to 1987/88
---,---Commodity Sectors
Agriculture Industry & Mining
Petroleum Electricity Construction
Distribution Sectors
Tran,Com & Suez Canal Trade & Finance Service Sectors
Housing
Public Utilities Other Services
GDP at Factor Cost
9.5% 3.1% 6.0% 53.4% -2.0% 10.6% 17.0% ---22.3% 15.1%
7 . 1"
-2.6% 7.7% 8.8% 10.6% ---4.5% 4.7% 8.5% 2.4% 17.2% 6.2% 6.0% n.a. n.a. 2.3% n.a. n.a. n.a. 4.4%
TJltbl .. (1.3)
VJltlu .. Add.d o~ Econo"ic Sectors i n the ECono"4 (Percentaq .. Sh~re o~ EcoMo~ic A c t i v i t i .. s i n GOP)
- 1975 - 1987/88
---
'r'ERR 1975 19761977 1978
SECTOR 19·79 1980 .... 1981
1981 .... 1982 1962 .... 1963 1983 .... 198"'1
:---:
Co""odit~Sectors 55.6r. 5"'1. 2;:~ 5~ .. 9~~ 5·~. 7;:~ 57 .. ~::~ !5~ .. 4~! 5 1. 7;:~ "19.6;:~ 50 •• ~;:~
---
---Ag,-i cuI t'.Jr .. 29 .. 0~~ 28 .. 3:-~ 27 .. !5:-:: 25. a;:~ 21. 2::~ :;:~O .. 3:'! 19. 1;:-~ 19. '7:';: l;:i .. ;3:';:
I nd.-,,,,,+':r-y ~ Mi r".i n9 17. 5;:-~ 16. 1;:~ 15 .. 1:-;: 1"'1. 9,~ 13 .. 9::~ 13 .. 5::! 13. 6;:-~ 1~. 2~{ 13 .. 6;~ P .. +.:rc.l ... " 2.9;:~ "1. o;:~ 6 .. 3:"! 7 .. 1::~ 16 .. 0;:;: 16.6;{ 13. 6;:~ 10. 3;:~ 12. 5::~ El.c-l:rici+':~ 1. "1;:~ 1 .. ·-:''''!.I .:;
..
1. 1;:~ 1.1r. (I .9;:-~ 0.6;:~ I) .. 7::~ 0.7:-;: o. 8~~(:ot",sf:r'.j,::i:i Cit" "1. s;-:: ~ .. 5~~ "1. 13;:~ 5 .. a;~ 5. "'I,~ .~ •• ~;:! "1. 6;:-~ .~ • !5r. ~ .. 6;~
[Ii :E:+,:,.~i b',Ji::i -::at) St6!t:: t..-.:.t··: 20 .. 5;;: 22 .. 1;~ ;;:~;~ .. 'r' (~ 25. 2;~ 2~~i _ 7:-;: :::~6 .. 8;~ 26 .. EI;~ 30. 6;:~ :29 .. 8;~
--- ---:
r ... !lfn, C., .... ~ s. Canal: 5.1r. IS .. 5;~ 6. IS:! 7 .. f:I~;! ~:I • ~::'i;;! ::i ... i'~! 9 .. ~~: .. ! 9.7r. 8. 9~~ Tr- .. d .. 1'.1: Fi nan.=e l~ .. Cf;:': 15 .. 6;:'~ 16 .. 1:-~ 17. 4;:~ 17. 4;:-~ lEi .. l;:~ 19. 6;:~ 21.0;:;: 20.9;:;!
S .. r .... i .=e Sel= i:Clt-s: 23.9:--:: 23_ 8;:~ 2;.2 .. ~~;: 20. 1;:! 16. 9,~ 1'(' .. a;:! 19 .. 5:-;: 19. a;:~ 19. a;:~
--.--- ----..
-.--H.jusinl3 4.1r. 3 .. 6:'-.! 3.3:-;: 3.0;::: ~:! .. ~::-.! 1. 9,~ 1. 9,~ 1. '~r. 1 • :3,~
P .... b1ic Uti 1 i t:i .. "" 0."'Ir. o. 3;:~ O.3;;! o. 3,~ o .. 3::-~ 0 .. 2;:~ O. 3~! 0.3r. O. 2;:~ Other- S . r .... i c .... 19.4r. 19 .. E:::;: If.I.I:t,~ 16. a;:~ 1"'1. 3,~ 1!5.7~ I? "'I;:-~ 17 .. 7~:! 17.7::;!
G[lf' ... -1: F ... =+':o:>r- Cos+.: 100.0r. 100. O,~ 100. O,~ 100. O;:~ 100. o;:-~ 100. o;:~ 100. o;:-~ 100.0;{ 100. O,~
---
----_._-_
... - ---_._.-_._---_.
---_. --.--- ._--- ------So:>urc~: c a l c u l a t . d ~ro" T.b1. Cl.1)
19:01"'1/ 19;35 1905 .... 1986 1986 .... 1987
1·:;.87 .. ··
198:3
---:
~i2 .. 3;:'~ "19. 1;:~16 .. 6~~ :21 .. !5:'~
10&:1 .. 6:-~ 16. 6~-~
15 .. 9r.! ..:w .. 6:-~
0 .. 7:-~ 1 .-.... .. ,.; ...
.~ • !'5;:-~ 5 .. 2:-;:
29 .. 6~~ 33 .. 6: .. !
8 .. .. I';' -, •• t' ... a ..
20.9::-': t·,. -HI .. 18. 1;:~ 17 .. 3~"'!
:2 .. Or'! ... .at ..
o .3~': nooa.
1!5. e;:-~ n • .a. 100. m~ 100.0:"':
---
---.-"'18. !5;:~
2 1. t:'~
17 .. O~~ 0:1 .. 3:"~
1 .. 3:-~
4. 9;:~
33 .. 8~~
,. .... .sa ..
t'I.-9I.
17. E':-~
t ... .a •
n • .a.
,. • • -iii •
100. O;:~
---4e .. 6;~
20 .. 6;:-~
17 .. 3:-~ "-1.3;:! 1.3;:! !'5. o,~
33 .. 6;~
t', .. -ill • ,.. .... !If •
17. 9~":
,.-
...
,.....
,.
...
100. O,~
---l\,)
extent, since the upsurge of its share in value added was almost entirely a price induced phenomenon.
2.2. International trade:
Table (1.4) shows the development of the trade balance of the oil sector (government share) in Egypt. From the table, total exports of the sector have jumped from US$ 309 million in 1975 to US$ 3441 million in 1981; an increase of over ten-fold. During the same period, however, total imports by the oil sector have increased from US$ 374 million to US$ 641 million, thus turning a deficit of US$ 65 million in 1975 to a surplus of US$ 2.8 billion in 1981. Since 1981, not only did the oil sector have to reduce its exports due to an over-supply worldwide, international prices of oil fell sharply as well. This is evident by the fall in the value of oil exports to US$ 1563 million in 1988 which in turn had led to a reduced surplus of US$ 1167 million in 1988. Such a fall in the proceeds of oil exports has affected the country's foreign exchange receipts which relied heavily upon exports of 0 i 1. I n fact, exports of oi 1 have const i tuted a major
share in Egypt's exports. The same Table shows that the share
of oil in total exports peaked at around 70~ in 1979,
,
,
YEAR 1970 1975 1976 1979 1980 1981 1982 1983 1984 1985 1986 1987 1988Table (1.4)
The Oil Sector in Egyptian Foreign Trade 1970, 1975, 1976, 1979-1988
(in million L.E. & million US$) Exports
L.E. US$ 31 124 252 1341 2145 2409 2242 2096 2189 2338 1665 634 1093 79 309 631 1915 3064 3441 3203 2994 3127 3340 2381 907 1563 Imports L.E. US$
44 110 150 374 130 325 179 254 291 411 453 641
528 746'
567 811 562 803 497 710 278 398 203 290 277 396
Balance :: % share: L. E. US$': in Xs :
---
,---,
-13 -26 122 1162 1854 1956 1714 1529 1627 1841 1387 431 816 -31 -65 306 1661 2653 2800 2457 2183 2324 2630 1983 616 1167,
,
n.a.
,
,
n. a. : n. a. '
71% 60% n.a. n.a. n.a. 65% 69% 65% 23% 29%
---28
NOTE: starting from 1980, the fiscal year has been changed to July. Thus, 1981 is actually 1980/81 and so forth
SOURCES:
1) Oil foreign trade data for 1970-1985 from EGPC [29]; data for 1986-88 from Central Bank of Egypt [16]. 2) BOP data for 1979 & 1980 from Pearce [62];
data for 1984-88 from Central Bank of Egypt [16].
Table (1.5)
The Oil Sector and Government Revenue 1977-1980 & 1985/86, 1986/87
(L.E. million)
Total
,
,
,
Total Share---
Government,
Petroleum in totalYEAR Revenue
,
,
Revenue Revenue,--- ---:---
---,
,
,
,
,
,
,
I,
I I I I,
,
1977 2775
,
,
337 12.1%1978 3306
,
,
406 12.3%1979 3684
,
,
904 24.5%1980 5346 I
,
1772 33.1%1985/86 15016
,
I 1343 8.9%1986/87 15230 I 759
4.9%
,
2.3. Government finances:
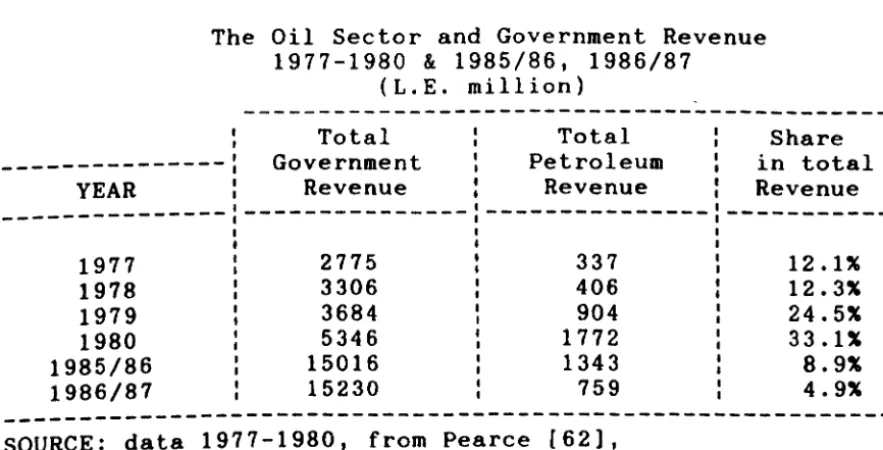
With respect to government finances, however, the oil sector has been responsible for a significant share in government revenues over a period of time. In fact, this particular type of revenue accrues in two ways. First, the government receives the transferred profits from the EGPC. Second 1 y , it rece i ves i nd i rect taxes, bus i ness taxes and returns in se 1 f-f i nanc i ng investment in the oi 1 industry [62]. Table (1.5) indicates that in 1977, the oi 1 sector realized a budgetary revenue of L.E. 337 million, i.e., representing 12~ of total government revenue. In 1980 the oil revenue increased to L.E. 1772 million to represent around one third of total government revenue. By 1986/87, however,
30
3. Energy profile of Egypt:
In the following, we will analyse the production and consumption of primary energy in Egypt in some deta;l.
3.1. Energy production in Egypt:
Pr; mary energy production in Egypt can be
classified into three main categories: oil, natural gas and hydroelectricity. During the period 1975 to 1987, aggregate energy production in Egypt as indicated in Table (1.6), has
increased by over 38 MTOE to reach 51 MTOE in 1987,
represent i ng an average growth rate of 13. 4~ per annum. Production of oil during that same period 1975-1987 has increased by around 35 MTOE representing an increase of over four-fold. Nonetheless, its relative share in total energy product i on has
above the 90~
been dec 1 in i ng gradua 11 y though rema in i ng mark. This dec1 ine in the share of oi 1
production in relative terms is due to the increased
Tab I e (1. 6)
Production of COI.ercial Energy in Egypt 1975 - 1987
(in OOO's TOE)
---: liquids G a s : Electricity : Total Production :
, - - - ______ 1 ______ - - - ______ 1 _____ - _______________ 1 ________________________ 1
, I , , ,
---: Quant Inc Share: Quant Inc Share: Quant Inc Share: Quant Inc Share: : YEAR :---:---:---'----____________________ :
" I I I
, - - - , I
1975 ' 11782 951 42 0.31 575 51 12399 1001
1976 16878 431 941 348 7291 21 683 191 41 17909 UI 1001 1977 24495 451 951 483 391 21 765 121 31 25743 441 1001 1978 25035 21 941 951 971 41 788 31 31 26774 41 1001
1979 25709 31 921 1437 511 SI 804 21 31 27951 41 1001 1980 28665 111 931 1443 01 SI 812 11 31 30921 111 1001 1981 29840 41 921 1747 2a SI 86.4 61 31 324S1 SI 1001 1982 33221 111 921 1947 111 51 886 31 21 36054 111 1001 1983 36451 101 931 1937 -11 51 888 01 21 39276 91 1001 1984 4188S 151 921 2540 311 61 889 01 21 4S314 151 1001 1985 45127 81 921 3340 311 71 696 -221 11 49164 81 1001 1986 ,41202 -91 901 3905 171 91 688 -11 21 45795 -71 1001 , 1987 : 46361 131 911 I 4041 41 81 516 -251 11 I S0924 111 1001
'---:---:---:---I I I I
: Average Annua 1 , , I
: Growth Rate 131 : 861 : -0.11 : 131
: 1975 - 1987 :
32
been increased dependence on thermal-electricity generation to mitigate for the shortfall in hydro-generation as well as to satisfy the increased demand for electricity.
3.2. Primary energy consumption:
With regard to the demand for energy in Egypt, we will first proceed by presenting an overall aggregated view of consumption patterns. Then we dis-aggregate consumption by energy type and finally we will shed the light on the largest consumer of energy in Egypt, that is the electricity sector.
3.2.1. Aggregate and per capita consumption:
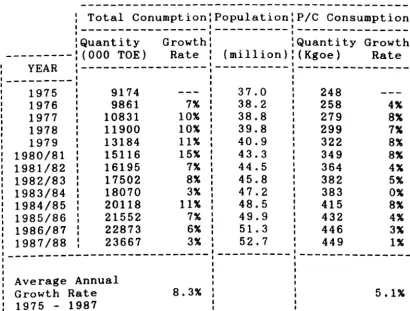
Table (1.7)1 shows that during the period 1975 to 1987, the aggregate primary energy consumption in Egypt has increased from around 9 MTOE to over 23 MTOE; that is, an increase of one- and half-folds, while the average growth rate during that period was 8.3% per annum.
With respect to per capita consumption, Table (1.7) also indicates that it has increased from 248 Kgoe in 1975 to 449 Kgoe in 1987, representing an increase of 81% during that period.
1The Table reports commercial energy only. Although,
traditional non-commercial energy sources (e.g., dung and
fire-wood) are used in many parts of Egypt in considerable quantities, there is no accurate assessment of this
---YEAR
---1975 1976 1977 1978 1979 1980/81 1981/82 1982/83 1983/84 1984/85 1985/86 1986/87 1987/88 1 1
Table (1. 7 )
Total & Per Capita Primary Energy Consumption in Egypt
1975 - 1987/88 (OOO's TOE) & (Kgoe)
---Total Conumption Population PIC Consumption
1 _ _ _ _ _ _ - - - ---
---I
'Quantity Growth Quantity Growth
(000 TOE) Rate (million) (Kgoe) Rate
---
------9174 37.0 248
9861 7% 38.2 258 4%
10831 10% 38.8 279 8%
11900 10% 39.8 299 7%
13184 11% 40.9 I 322 8%
15116 15% 43.3 I
349 8%
I
16195 7% 44.5 1
364 4%
I
17502 8% 45.8 I
382 5%
I
18070 3% 47.2 I
383 0%
I
20118 11% 48.5 I 415
8%
1
21552 7% I 49.9 I
432 4%
1
22873 6% 51.3 I
446 3%
1
23667 3% 52.7 I
449 1%
I
---
---:---I
I
Average Annual I
I
Growth Rate 8.3% 1
5.1%
I
1975
-
1987 II
34
Nonetheless, Figure (1.1) shows that the growth rate of
the per capita energy consumption which on average
increased by 5.1% per annum from 1975 to 1987/88 - was less than that achieved by total consumption. This is due to the high rates of population growth.
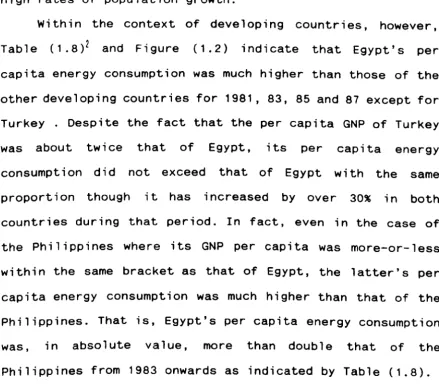
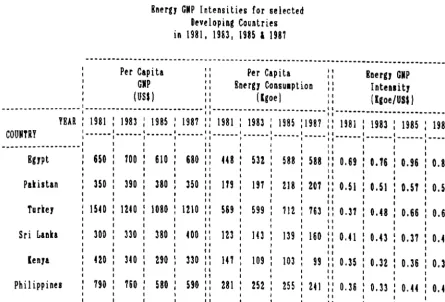
Within the context of developing countries, however,
Table (1.8)2 and Figure (1.2) indicate that Egypt's per
capita energy consumption was much higher than those of the other developing countries for 1981, 83, 85 and 87 except for Turkey . Despite the fact that the per capita GNP of Turkey
was about twice that of Egypt, its per capita energy
consumption did not exceed that of Egypt with the same proport i on though it has increased by over 30% in both countries during that period. In fact, even in the case of the Phi 1 ippines where its GNP per capita was more-or-less within the same bracket as that of Egypt, the latter's per capita energy consumption was much higher than that of the Philippines. That is, Egypt's per capita energy consumption
was, in absolute value, more than double that of the
Philippines from 1983 onwards as indicated by Table (1.8).
Total
&
Pie
trend in energy consumption
11 Egypt
2 6 0 . . . . - - - . .
250
240
230
220
210
o
200o
.-190
180
170
x
160
~
'U'
( 150
140
130
120
110 100
90+----~~~-~~~-~~--~~~
1975 1976 1977 1978 1979 1980 1981 1982 1983 1984 1985 1986 1987
'fear
Table (\.8)
EnergJ GNP Intensities for selected Developing Countries in 1981, 1983, 1985 l 1987
36
._---Per Capita :: Per Capita :: RoergJ GMP
GMP : : Eneru Consulption : : IntelllitJ
, (US, I : : (lgoe I : : (lgoe/US, I
---:---:
:---::---: COUNTRY YEAR: 1 • • • • • • 1 • • • • • • 1 • • • • • • 1 • • • • • • 11 • • • • • • 1 • • • • • • 1 • • • • • • 1 • • • • • 11 • • • • • • 1 • • • __ .1._ • • • • 1 • • • • • _ 1981 : 1983 : 1985 : 1987 :: 1981 : 1983 : 1985 :1981 :: 1981 : 1983 : 1985 : 1981
I • • • • • • • • • • • • • • • • • •
Egypt
Pakistan
Turley
Sri Lanka
lenJa
Philippines
I I I t I I I I I I
I I I I I I
I I I
650 700 610 680: 448 532 588 588 0.69: 0.16 0.96: 0.86
350 390 380 350
1540 1240 1080 1210
300 330 380 400
420 340 290 330
190 760 580 590
IT9 197
569 599
123 143
141 109
I I
218 207
712 763
139 160
103 99
281 252: 255 241
I I
0.51 0.51 0.51: 0.59
0.31 0.48 0.66 0.63
0,41 0.43 0.31 0.40
0.35 0.32 0.36 0.30
0.36 0.33 0.44 0.41
---SOURCB:
P
/C Energy Consumption in Selected
Oevelopilg Countries
8 0 0 . . . - - - ,
700
600
500
o
o
400~
'1..
300
200
100
o+---.---.---~
1981 1983 1985 1987
Yeor
o
Tur1<ey flSri
llllko X Kenya38
3.2.2. Domestic consumption by energy type:
The components of domest i c consumpt i on of primary energy in Egypt are: oil products, natural gas, coal and hydro-electricity3 as presented in Table (1.9). By examining the Table, we can clearly observe that oil products
represent a major share in the aggregate pri mary energy consumption in Egypt. Despite the fact that its consumption has increased from about 7.6 MTOE in 1975 to 18.3 MTOE in 1987, its share re 1 at i ve to the other energy sources has declined from 83% to around 78% during the same period. This relative decl ine in the oi 1 share is largely due to the
increased utilization of natural gas whose domest i c
product i on started in 1975 though in sma 11 Quant it i es as shown in the Table. However, since the mid 1970's natural gas ut i 1 ; zat i on has begun to assume a much greater ; mportance within domestic energy consumption in Egypt. In fact, it has substituted oil products in domestic uses especially in the
household sector in addition to substituting coal in
industry. Moreover, it has been increasingly relied upon in thermal-electricity generation as we shall discuss later. In
3The consumption figures for natural gas and
hydro-electricity are equal to those for production in Table (1.6). This is an over-simplistic proposition since in practice distribution and transmission losses are usually encountered in the consumption of natural gas and
electricity respectively. However, this simplified
assumption will be ignored since we are only using those figures for illustrative and comparative purposes only. Nevertheless, the issue of transmission losses in
Table (1.9)
ConBulption of COllercial Energy in Egypt
1975 - 1981
(in ODD's TOEI
---: Liquids : Gas : Solids : Electricity :Total Consulption: :---:---:---:---:---: ---: Quant Grow Share: Quant Grow Share: Quant Grow Share: Quant Grow Share: Quant Grow Share: : Year '---'---:--- __________ t _________________ : _________________ :
I ,
1915 1634 1916 8239
1917 8929
1918 9643
1919 10141 1980 12389
I 1981 12834
1982 13835 1983 14660
1984 16033
1985 16186 1986 : 11549
1981 : 18343
831 81 841
81 821
81 811 III 811 151 821
41 791 81 791
61 811 :
801 : 181 :
111 :
181 :
91
51
51
51
42
348 7291
483 391 951 911 1431 511 1443 01 1141 211
1941 111
1931 -11 2540 311 3340 311
3905 In
4041 41
01 :
41:
41'as
III 101 III III III 131 151 In :111 :
923
592 -361 658 III 518 -Zll ZOZ -611
411 1331
150 591 835 111
585 -301 656 121 129 111 730 01
761 41
101 61 6S 41 ZI 3S 51 51 3S 31 31 31 31 515 683 191 165 121
188 3l
804 21
812 11 864 61 886 3l 888 01
889 01
696 -221
688 -11
516 -251
,
61 9114 -- 1001 : 11 9861 11 IDOl : 11 10831 101 IDOl : 11 11900 101 1001 t61 13184 III 1001 51 15116 lSI 1001 51 1&195 11 1001 51 11502 81 IDOl 51 180TO 31 1001 41 20118 III 1001 31 21552 11 1001 31 22813 61 IDOl 21 23667 31 1001
--- --- --- ---
---Average Annual , Growth ia te
: 1915 - 1987
,
I
81:
,
,
861 :
,
81:
I
,
-0.11 : 81
40
abstract terms, its consumption has increased from 42000 TOE in 1975 to 4 MTOE in 1987 representing a striking increase of almost one hundred-fold during that period. In relative
terms, however, its share in tota 1 domest i c energy
consumption has risen from 0.5% in 1975 to around 17% in 1987 to be ranked second to oil products with respect to relative shares in total consumption.
The third component of primary energy consumption is coal which is primarily used in the iron and steel industry in Egypt. Its consumption is therefore positively related to the state of the iron and steel industry while negatively related to its substitution by natural gas. From Table (1.9) the consumption of coal has declined from around 1 MTOE in 1975 to around 0.7 MTOE in 1987; a drop of almost 30~. In relative terms its share in total consumption has also declined from around 10~ in 1975 to 3.2~ in 1987.
With regard to the final component of primary energy consumption, i.e., hydro-electricity, we need to elaborate more on the declining trend it exhibits in Table (1.9). Hydroelectricity as a source of primary energy in Egypt has decreased from 6.3% of all energy consumed in 1975 to 2.2% in 1987 despite the fact that its contribution remained more-or-less the same throughout that period. In fact, not only has hydropower reached its maximum capacity, further investment
in it will not make any significant contribution to
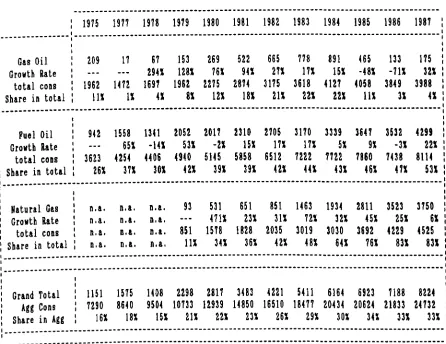
3.2.3. Demand for fossil fuel by the electricity sector:
While the potential of hydropower to expand its maximum capacity has become virtually nonexistent, the demand for electricity in Egypt, as will be discussed later, has been increasing quite dramatically in the last two decades or so. Therefore, the shortfall in hydropower has meant an increased reliance on thermal generation, i.e., oil products and natural gas in order to meet the increasing trend in electricity consumption in Egypt.
In fact, a significant proportion of the demand for primary energy originates in the electric power sector. As previously mentioned, there is a strong positive relationship existing between the demand for oil products and natural gas on the one hand and the rapidly increasing demand for electricity in Egypt on the other. Table (1.10) presents the data for the consumption of oil products and natural gas by the electricity sector in Egypt. The Table indicates that the
electricity sector alone has accounted for 16~ of the
aggregate consumption of gas oil, fuel oil and natural gas in 1975 which increased to 33~ in 1987. With respect to gas oil,
however, its consumption by the electricity sector has
,
1,
I
Table (1.10)
Consulption of Petroieul Products by the Rlectricity Sector in Egypt
1915 , 1971-1981 (OOO's let ric tonnes)
42
---1975 1977 1978 1919 1980 1981 1982 1983 1984 1985 1986 1981 I I
---:---: I
,
Gas Oil I
209 17 61 153 269 522 665 178 891 465 133 115
,
1 1
Growth Rate 1 2941 1281 761 941 271 111 151 -481 -711 321 : 1
total cons 1
1962 1472 1691 1962 2215 2814 3115 3618 4127 4058 3849 3988
,
1 1
Share in total 1 III 11 41 81 121 181 211 221 221 111 31 41:
1 1
' ______ ---______ 1 '
1
1 1
1 1
1 Fuel Oil 1 942 1558 1341 2052 2011 2310 2105 3110 3339 3641 3532 4299
1 1
Growth Rate I 651
-In
531 -21 151 111 111 51 91 -31 2211
total CaDS 1 3623 4254 4406 4940 5145 5858 6512 7222 7122 7860 1438 8114
1 1
1 Share in total 1 261 371 301 421 391 391 421 HI 431 461 411 531
1 1
'
______---1
1 1
1 1
I Natural Gas I n.a. n.a. n.a. 93 531 651 851 1463 1934 2811 3523 3150
1 1
1 Growth Rate 1 n.8. n.a. n.a. 4111 231 311 721 321 451 251 61
1 1
1 total cons 1 n.a. D.a. n.a. 851 1518 1828 2035 3019 3030 3692 4229 4525
1
1 1 1
1 Share in total I n.a. n.a. n.a. 111 341 361 421 481 641 161 831 831 1
I
1
1 ______
-1
' ______
---1
1 1
1 Grand Total 1151 1575 1408 2298 2811 3483 4221 5411 6164 6923 1188 8224 1
1 Agg Cons 1290 8640 9504 10733 12939 14850 16510 18417 20434 20624 21833 24732 1
1 Share in Agg 1 161 181 151 211 221 231 261 291 30X 341 331 331
1 1
'
______---1
---SOURCRS:
I) Pearce-Vhitlan-Peida Report 1621.
2) BGPC Annual Reports 129].
3) CDR Annual Reports 1161.
increased from 26% in 1975 to 53% of the total consumption of fuel oil in Egypt in 1987. Similarly, the share of natural gas in electricity consumption has increased from only 11% in 19794 to a striking 83% of total natural gas consumption in Egypt in 1987.
However, such an outcome has important implications with respect to the efficiencies of thermal-generation which involve losses in transforming primary energy (oil and natural gas) into secondary energy (electricity). In fact,
the electricity authorities in Egypt (EEA) have been
effortlessly trying to make improvements in the rates of fuel consumpt i on of thermal gene rat i on and hence the thermal efficiency has gradually increased from around 25% in 1976 to over 31% in 1987 [25]. Therefore, policy-makers or indeed any group respons i b 1 e for mak i ng investment deci s ions in the
power sector, also have to acknowledge the very high
efficiency rates of hydro-generation as opposed to those of thermal efficiency. In 1987, the average efficiency of the High Dam as well as the Aswan Dam I had, in fact, reached 83%, while it reached 91% for that of the Aswan Dam II [25]. Besides thermal generation inefficiencies, however, the ever increasing reliance on fossil fuels for electricity generation limits the volume of oil available for exports and hence affects the countr i es f; nances and forei gn exchange earnings. In fact, generating electricity by using hydro-power makes a great deal of savings in terms of fuel that
44
would have been used in thermal electricity generation. For instance, hydro-generation made fuel savings in 1985, to the valueS of around L.E. 53 million which dropped6 in 1987 to L.E. 41 million [25]. Furthermore, the increased utilization of oil and natural gas by the electric power sector, places pressures on the dep 1 etab 1 e i ndi genous energy resources. Finally, the dramatic increase in using oil and natural gas in generating electricity spawns yet further problems to the environment. This is demonstrated by the fact that thermal power stations emit greenhouse gases in the form of mainly CO2 and S02' The 1 atter can have a damag i ng effect on the env ironment in terms of health bi 11 s at the nat i ona 1 1 eve 1 and the former contributes to environmental problems at the global level such as global warming and sea level rise.7
Since the bulk of the ever increasing consumption of fossil fuel is brought about by electricity generating, we are deemed to believe that the most effective method to curb this massive demand for oil and natural gas is by controlling the growth of the electricity industry in Egypt; that is, unless the hydroelectricity potential is increased or an alternative non-thermal base is developed as a source for electricity generation such as nuclear energy.
5That is, calculated by using the subsidized domestic prices at which fuel is sold to the electricity sector.
6Ma inly due to an improvement in fuel consumption rates (thermal efficiency).
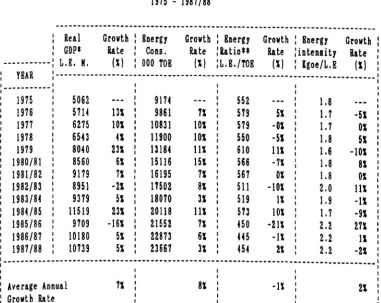
3.3. Energy consumption vs economic growth:
In the following, we will address the issue in which energy is and has been used in Egypt. Table (1.11)
indicates that in 1975 a domestic consumption of 9.2 MTOE was needed to sustain a GOP of L.E. 5062 million. The comparable figures for 1987 were 23.7 MTOE and L.E. 10739 million (at
1975 prices). The GOP/energy ratio8 was L.E. 552 in 1975.
Since then, the ratio has declined steadily from its 1975
level ending up at L.E. 454 in 1987 as shown in Table (1.11).
Such a decline in the GOP/energy ratio which was around 18%
during that period may suggest a declining efficiency with which energy is utilized. However, the same observations can be made on examining the energy GOP intensities9 which are also presented in Table (1.11) as well as Figure (1.3). The Table shows an increasing trend from 1.8 Kgoe/L.E. in 1975 to
2.2 Kgoe/L.E. in 1987; an increase of over 22%. In fact, this increase in the energy intensity (and hence the decline in the GOP/energy ratio) suggests a decline in energy efficiency which is characteristic of a developing country in the
process of industrialization [41 ] . Table ( 1 .8) 10 ,
nonethe 1 ess, presents energy i ntens it i es for another five
80efined as the value of GOP at constant prices per tonne of oil equivalent domestically consumed.
9That is, the ratio of domestic energy consumption to GOP at constant prices.
10GNP figures were used as a proxy for GOP since data on the
I I I I I I I I
Table (1.11)
Energy Ratio and Energy Intensity in Egypt
1915 - 1981/88
---Real Growth : Energy Growth : Energy Growth : Energy Growth GDP* Rate I
Cons. Rate :RatioU Rate : intensity Rate
I
____ MOO_MOO: L.E. K. (X) : 000 TOE (X) :L.&./TOE (X) : Igoe/L.&
(X) YEAR ---
---1915 5062 9114 552 1.8
1916 51H 13X 9861 11 519 5X 1.1 -51
1911 6215 lOX 10831 lOX 519 -01 1.1 01 1918 6543 41 11900 101 550 -51 1.8 51 1979 8040 231 13184 111 610 111 1.6 -101 1980/81 8560 61 15116 151 566 -71 1.8
ax
1981/82 9119 71 16195 71 561 01 1.8 01 1982/83 8951 -21 11502 81 511 -101 2.0 111 1983/84 9319 51 18010 31 519 11 1.9 -11 1984/85 11519 231 I 20118 111513 101 1.1 -9X
I
1985/86 9709 -16X I 21552 71
450 -211 2.2 271
I
1986/81 10180 51 I 22813 6X
445
-n
2.2 11I
1981/88 10139 5X I 23661 3X
454 21 2.2 -21
I I I
1 ______ - - - _________________________________ 1
I
I I I I
I I I I
: Average Annual 11 I
81 I
-11 I
2S
I I I
: Growth Rate
---* GDP at constant 1915 prices
** is defined as the value of real GDP dOlestically consuled per tonne of oil equivalent
SOURCES: 1) Real GDP fro. Table (1.1)
2) Aggregate energy consulption fro. Table (1.1)
o
o
...
x
~
'U
(
Energy
&
Electricity Intensity in Egypt
1975 - 1987
180 ...---~
170
160
150
140
130
120
110
100
1975 1976 1977 1978 1979 1980 1981 1982 1983 1984 1985 1986 19B7
Year
48
Energy Intensities in developing
counlrBs
0.9
0.8
(4
VI
0.7
J
\
4)
o
{lI 0.6~
0.5
0.4
0.3 4---,---r----~
1981 1983 1985 1987
Year
fl
Sri
llllko X KenyaI
I
j , ,
developing countries. 11 From the Table, it is clear that the
countries - except for Kenya and Sri Lanka - exhibit an
increasing trend in energy intensity. However, the same Table indicates that Egypt's energy intensity was the highest amongst the other developing countries to the extent that it was even higher than that of Turkey whose per capita GNP is the highest within that group. In fact, Egypt's energy intensity has increased by around 25%, that is, from 0.69
Kgoe/US$ in 1981 to 0.86 Kgoe/US$ in 1987. The trend of energy intensities is also depicted in Figure (1.4).
4. Electricity in Egypt:
This section discusses the electricity industry in Egypt with respect to its supply and demand. We will attempt to analyse the sectoral use of electricity consumption and then we will proceed to discuss the issues involved in economic growth coupled with electricity consumption. We will also try to estimate the price and income elasticities of electricity consumption. Finally we deal with electricity intensity within the context of other developing countries.
11 The GNP figures in this Table are converted into US$ by using the official exchange rates. However, there is reason to believe that those official exchange rates are not realistic since most of the developing countries over-value their currencies. Moreover, there is usually
multiple official exchange rates in addition to the realistic unofficial rate. Hence, one must be very
cautious in interpreting the figures for the per capita GNP and consequently the intensities. However, the Table gives an insight on the varying intensities amongst
50
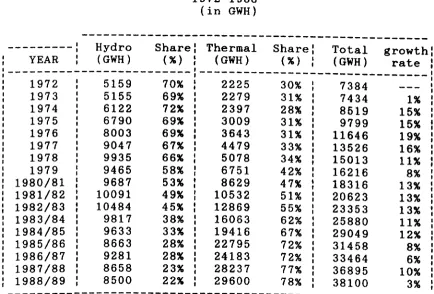
4.1. Electricity supply:
In Egypt, electricity is supplied by both hydro-and thermal-generation. Table (1.12) shows the relative contribution of each source in total electricity generation during the period 1972 to 1988. In addition to the Table, in our previous analysis of energy supply in Egypt in section 3.1 and Table (1.6), we were able to illustrate that the contribution of hydroelectricity had increased only until the early 1980's then it declined afterwards as it reached its maximum capacity. The same observation could be arrived at by
examining Table (1.12) where it indicates that
hydroelectricity generation has increased from some 5000 GWH in 1972 to a peak of almost 10500 GWH in 1982, after which it
began to decline to reach 8500 GWH in 1988.
Thermal-generation, on the other hand, has exhibited a steep increase during the same period. In fact, it supplied 2225 GWH in 1972 which increased substantially to reach 29600 GWH in 1988. In relative terms, however, the share of hydropower peaked in 1974 at 72~ of total generation, declining afterwards to assume equal importance with thermal-generation in 1981, but yet again dwindling further to reach only 22~ in 1988.
Table (1.12)
Electricity Generation in Egypt 1972-1988
(in GWH)
---• Hydro Share Thermal Share: Total growth
---.
YEAR • • (GWH) (%) (GWH) (%) • • (GWH) rate
---
---1972 5159 70% 2225 30% 7384
1973 5155 69% 2279 31% 7434 1%
1974 6122 72% 2397 28% 8619 15%
1975 6790 69% 3009 31% 9799 15%
1976 8003 69% 3643 31% 11646 19%
1977 9047 67% 4479 33% 13526 16%
1978 9935 66% 5078 34% 15013 11%
1979 9465 58% 6751 42% 16216 8%
1980/81 9687 53% 8629 47% 18316 13%
1981/82 10091 49% 10532 51% 20623 13%
1982/83 10484 45% 12869 55% 23353 13%
1983/84 9817 38% 16063 62% 25880 11%
1984/85 9633 33% 19416 67% 29049 12%
1985/86 8663 28% 22795 72% 31458 8%
1986/87 9281 28% 24183 72% 33464 6%
1987/88 8658 23% 28237 77% 36895 10%
1988/89 8500 22% 29600 78% 38100 3%
52
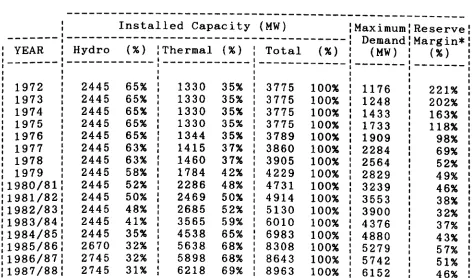
Table (1.13)
Installed Capacity, Maximum Demand
& Capacity Reserve Margins 1972
-
1987/88---Installed Capacity (MW) 'Maximum Reserve
---
---
Demand Margin*YEAR Hydro (% ) Thermal (% ) Total (%) (MW) (% ) ---
---
--- ------1972 2445 65% 1330 35% 3775 100% 1176 221%
1973 2445 65% 1330 35% 3775 100% 1248 202%
1974 2445 65% 1330 35% 3775 100% 1433 163%
1975 2445 65% 1330 35% 3775 100% 1733 118%
1976 2445 65% 1344 35% 3789 100% 1909 98%
1977 2445 63%
,
1415 37% 3860 100% 2284 69%1978 2445 63% 1460 37%
,
3905 100% 2564 52%I 1979 2445 58% 1784 42% 4229 100% 2829 49%
1980/81 2445 52% 2286 48% 4731 100% 3239 46%
1981/82 2445 50% 2469 50% 4914 100% 3553 38%
1982/83 2445 48% 2685 52% 5130 100% 3900 32%
1983/84 2445 41% 3565 59% 6010 100% 4376 37%
1984/85 2445 35% 4538 65% 6983 100% 4880 43%
1985/86 2670 32% 5638 68% 8308 100% 5279 57%
1986/87 2745 32% 5898 68% 8643 100% 5742 51%
1987/88 2745 31% 6218 69% 8963 100% 6152 46%