Experimental analysis of static and dynamic properties
of the check valves
Pavel Dokoupil1,*, Daniel Himr2, and Vladimír Habán2
1Institute of Applied Mechanics Brno, Ltd., Resslova 972/3, 602 00 Brno, Czech Republic
2Brno University of Technology, Faculty of Mechanical Engineering, Victor Kaplan Department of Fluid Engineering, Technická 2, 616 69, Brno, Czech Republic
Abstract. The check valves play an important role in safety and reliability of many technologies using liquid or gas flow. Check valves are elements of the hydraulic system enabling the one-way flow without a significant pressure loss and preventing the reverse flow. The ideal check valve should have an acceptable pressure loss and, when closed, there should be no undesirable dynamic phenomena like water hammer or slam. The static properties describe energy losses of the check valve, and the producers provide them as a standard. The static properties can be defined either in an experimental way or using the CFD analysis. The dynamic properties of the check valve express a relation between the maximum reverse velocity and water column deceleration. Unfortunately, the definition of dynamic properties can be obtained only experimentally, and for small pipe diameters. It is very demanding, time consuming and expensive to define the dynamic characteristic so it is why the producers do not offer it as a standard. The article deals with static and dynamic properties of different check valves with different closing principles. There was built a testing hydraulic circuit with the pipe diameter DN 100, that enables the simulation of check valve slam during the flow reversing. The attention was paid to the definition of flow deceleration, which is rather problematic and usually defined in a different way for each lab.
1 Introduction
From the safety and reliability point of view, the check valve systems play an important role in all types of hydro and air technologies. Currently, they are the most widely used types of check valves used on piping systems demanding high safety and reliability of check valves. The pressure pulsations occur when the water flows, even in case of stationary flow. Pulsations will be significant in case of regulation or failure of the pump or the turbine. Very strong pressure pulsations can occur especially in case of a failure or the pump shutdown. It is caused by a delayed closure of the check valve, which leads to a significant hydraulic slam.
In fact, it is not possible to design a check-valve working without slams and pressure losses. But it is possible to design it in the way of getting weak slams and acceptable pressure losses. The velocity and efficiency (check-ins, inspections, repairs) are other important requirements on check valves. It means that the check valve should be designed in a way to support the possibility of repair the damaged parts without removing them out of the piping. Numeric modelling (CFD) of flow rate and slam has a significant impact on the valve design, especially in terms of time and
money. But, it is impossible to verify the numeric modelling
without the experimental static and dynamic properties of the check valves.
The definition of the static properties is quite frequent, even in case of large diameter. On the other hand, it is impossible to define the dynamic properties of large diameters due to safety, cost and technical reasons. That is why it is necessary to measure it on a model and then transfer it on bigger dimensions.
The producers of the check valves, together with research centres in both Europe and USA, study the area of the check valve dynamics. In Europe, it happened i.e. at TU Delft, Holland [8]. In the US, the research took place at the University of Utah together with VAL-MATIC Co [2, 7]. The dynamic behaviour of the check valve (called the check valve slam effect) will occur only when the pump is switched off. Consequently, it is impossible to eliminate it but only reduce it on to the acceptable value. The probability of the ‘check valve slam’ phenomenon is given by the project arrangement of the pumping station and the displacement system.
2 Description
There were five basic model check valves produced to pass the hydraulic tests. They work in different physical principles of closing. All the check valves have a diameter DN100. The tested designs (see Table. 1) can be divided, according to the way of closing, in two key categories. First, the classic check valves (combined valve A41 and C23) with a flat disc rotating around the pin. Second, the check valves (Axial, BZVand Top-entry) with a spring lock.
Table 1. Tested check valves
Valve type Test coding
Butterfly (swing) C23
Butterfly (tilted-disc, tilting) A41
Silent (lift) Axial
Nozzle (non-slam check valve) BZV
Nozzle (non-slam check valve) Top-entry
Combined valve enables to place two different types of plates C23 and A41 into the inner body. To make it happen, there were additional pieces made related to the type A41. The valve C23 has two handles to place additional load and set opening and closing torque of the valve.
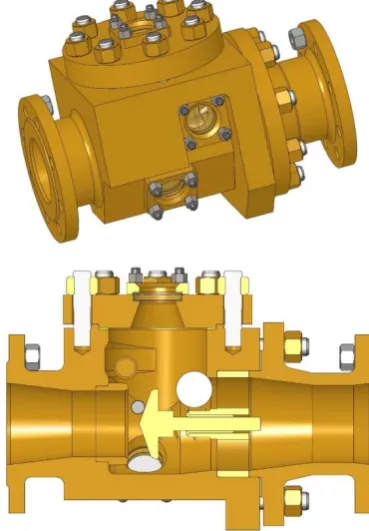
Fig. 1. Combined valve
Fig. 2. Combined valve C23
Fig. 3. Combined valve A41
Axial check valve includes the closing element (spring) meeting the Russian Standards OTT-87/99 that define the minimum closing pressure (pressure loss) of the check valves used in nuclear power plants.
Fig. 4. Axial check valve
Axial check valve - BZV is based on the axial check valve. In case of BZV the flow parts were hydraulically optimized to reduce energy loss but keep the same dynamic properties as in the axial check valve. It results the BZV has a lower pressure loss than the axial check valve.
Fig. 5. Axial check valve – Top-entry
3
Test track
A testing circuit was built to measure the static and dynamic properties of check valves. The system enables to reverse the flow. See the scheme in Fig. 6. The Suction tank of 6 m3 feeds the pump which pushes water in the pulse piping DN100 through the tested valve into the Small tank of 2.5 m3. Then the water flows back into to the Suction tank via the return pipes, which could be closed by a butterfly valve. The Small tank can be pressured by a compressor and depressurized by an air-valve. The tested check valve is placed on the flat part of the 6m long return pipes. A dynamometer controls the pump velocity, revolutions and the torque (Mk). The induction flow meter measures the steady flow (Q) and the pressure (p_1 to p_6) is measured by six absolute pressure sensors installed directly to pipe wall. The water temperature (tw)was measured by a platinum thermometer Pt100 in the supply pipes. The distance of the pressure sensors from the tested check valve (measured from the closer flange) is the following: p_1 = 2400 mm, p_2 = 1300 mm, p_3 = 190 mm, p_4 = 190 mm, p_5 = 1180 mm, p_6 = 2160 mm. The flow meter and pressure sensors p_1 to p_3 were placed in front of the tested check valve, and the pressure sensors p_4 to p_6 behind the tested check valve.
Fig. 6. Testing circuit scheme [6]
Fig. 7. Picture of the Testing circuit
4
Measurements and evaluations
4.1 Static properties
of pressure measuring points). There were the same pressure sensors used.
The measurement and evaluation were carried out according to the Standard CSN EN 1267 [1]. The pressure loss of the check valve was defined by equation (1).
Δpv = p3 – p5 (1)
u = (4·Q)/(π·Di2) (2)
The resulting pressure losses (Δpv) were compared between each other according to the mean water flow, which is defined by equation (1). The reference diameter Di = 0.1 m was set to determine the mean water flow of the tested check valve.
Fig. 8. Axial check valve – Top-entry
Fig. 9. Combined check valve C23
4.2 Dynamic properties
In case of the dynamic properties, the water flow rate was set in combination of pump revolutions and the butterfly valve. The water level in the Small tank was set with the compressor. The water pump stopped quickly when the water level stabilized. The velocity was set according to the time constant of the dynamometer. The quick reverse of the flow happened due to the quick pump shutdown, which caused the negative flow and consecutive pressure pulsations.
To evaluate the dynamic properties correctly, it is necessary to define the water flow during transition process. The calculation was made in accordance with the Standard IEC-41 using records of the valves
p_3 and p_1 (pressure-time method, Gibson’s Method). The course of flow is shown on the Fig. 10 in blue.
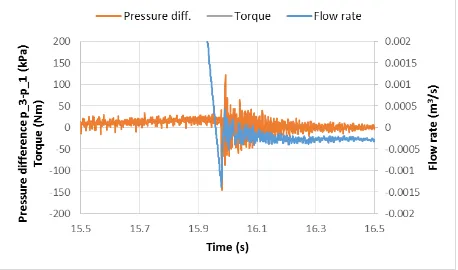
Then the flow deceleration was defined. There were two points to achieve it: the moment of maximum negative flow rate through valve and the moment when the pump shaft had a zero torque, see Fig. 10 and 11.
Fig. 10. Pressure difference, torque and calculated flow rate during transition
Fig. 11. Pressure difference and calculated flow rate during transition – detail
The following was to re-calculate the flows to mean velocities and posting them in dynamic properties. The maximum reverse velocity is shown depending on the average deceleration. Checking the sound velocity in pipes at all measuring points was done according to the theoretical pressure increase during total slam and pressure increase at p_4 pressure meter, see Fig. 6. The sound velocity oscillated between 1100 to 1400 m/s.
The dynamic measurements, in comparison with the static one, is not included into the normative documents. All authors do measure and evaluate it in a different way (see 2 to 5).
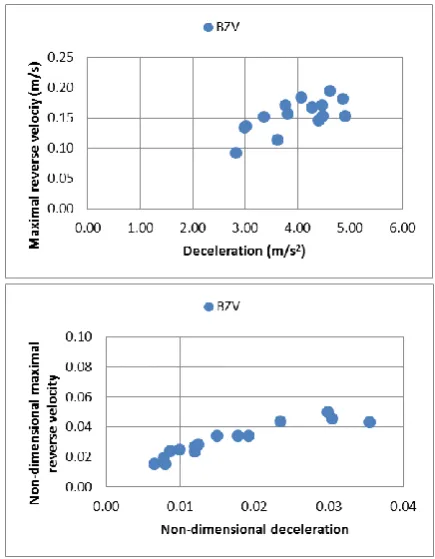
The dynamic properties shows the dependency between the flow deceleration dv/dt and the maximum reverse flow velocity vr. Each point of the dynamic measurement shows one point of the dynamic properties representing the maximum reverse velocity as a media velocity gradient function:
In case the BZV are geometrically similar, the dynamic property can be shown in dimensionless quantities. In a simplified form, according to [4], we can say the following:
vr/v0 = f [(Di/v02)·(dv/dt)] (4)
The question is, how to define the flow rate deceleration dv/dt. [3] uses the period when the flow rate reaches zero value from the steady state with no other comments. [5] defines the period from the moment when the pressure behind the valve starts to increase up to the moment, when it reaches its maximum. The velocity difference is equal to the sum of steady flow rate v0 and the maximum reverse velocity vr. The deceleration definition dv/dt is important to compare the dynamic properties of different authors correctly. To define dv/dt there were two clearly identified points applied: the moment when the torque of dynamometer is zero and the moment when the closing element reaches the valve seat.
5 Measurement results
The static properties of five tested check valves are shown in Fig. 12. The static properties of the valve C23 was defined for the load of 0-3 kg (the number after the dash), thus it has a different pressure loss (according to load) at low flow rate. When the valve is fully opened, the losses do not depend on load.
Another interesting point is that the BZV axial check valve properties is nearly the same as the A41 combined valve.
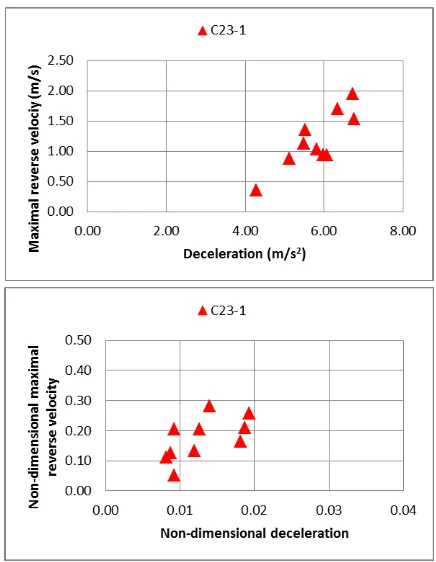
The dynamic properties are shown in Figures 13 to 19. The dynamic properties of the C23 valve was defined for the load of 1 to 3 kg.
The ideal check valve should have a minimum pressure loss and should not cause pressure and mechanical slams. In general, we can say that the lower pressure loss, the worse dynamic properties, and vice-versa. In technical practice is considered, that the check valve should not overcome the pressure loss of approximately Δpv = 20 to 25 kPa at water flow rate u = 4 to 5 m/s. The Fig. 12 proves that BZV, A41 and C23 valves (load 0-2 kg) meet the criteria. The Top entry valve achieved the best pressure loss. The Axial check valve the worse (without optimized flow profile), as expected.
The axial valve, Top-entry and C23 valve with adequate load prove the best characteristics from the dynamics point of view. Top-entry is the best from the static and dynamic properties point of view. The C23 with 2 kg load is the best choice for operations requiring check valve (not axial valve). The C23 has a good pressure loss (value) at steady flow and surprisingly good dynamic behaviour.
The A41 combined valve, considered non-slam by the producer, does not prove the dynamic properties as expected.
It is necessary to add, that the check valves did not behave consistently during testing and that is why the measured points have a lager scatter than the axial valves. The deviations were random and cannot be
explained by system properties neither by impurities in system.
Fig. 12. Static properties – pressure loss dependence on mean water flow
Fig. 14. Dynamic properties – reverse velocity dependence on system deceleration
Fig. 15. Dynamic properties – reverse velocity dependence on system deceleration
Fig. 16. Dynamic properties – reverse velocity dependence on system deceleration
Fig. 18. Dynamic properties – reverse velocity dependence on system deceleration
Fig. 19. Dynamic properties – reverse velocity dependence on system deceleration
An anomaly was detected at the C23 valve during the dynamic measurements at 2 kg load. Based on that, the C23 valve was re-tested in dynamic way.
Fig. 20. Dynamic property of the C23 combined valve
The maximum reverse velocity depending on load was expected to decrease monotonously.
6
Conclusions
The article describes static and dynamic measurements of check valves of different designs. For this purpose, a testing circuit was built which, in addition to measuring the pressure loss at steady flow, also allows the dynamic tests. Various flow decelerations were achieved by controlled pump braking. The experiments were carried out in cooperation with MSA, a.s., which supplied the check valves.
Experiments confirmed that the check valves and the axial check valve can have similar static properties if the flow cross section is suitably designed. Dynamic behaviour is generally better in case of the axial valves. However, the check valve with a suitably selected load can also close (itself) quickly enough, so that it does not have a large water slam and still retains a low-pressure loss at steady flow.
During the testing, the impact of impurities on the check valve mechanisms was not assessed
.
They may cause, after a certain time, a friction increase, and thus to slow the valve respond to the flow reverse and deteriorate its dynamic properties. However, it has been observed that the check valves, that were stored for some time and re-installed back, behaved differently during the first tests than later. This mainly concerned the axial valves and these first tests were excluded from the analysis. The check valve measurement deviations are not so easy to explain, so all the assessed points were left in the charts. It is possible that the valve design itself allows a certain ambiguity of the disc position (floats in the flow), so every valve closing is unique.This work has been supported by Technology Agency of the Czech Republic under the project Innovative research of check valves for extreme operating conditions in energetics TH01011352.
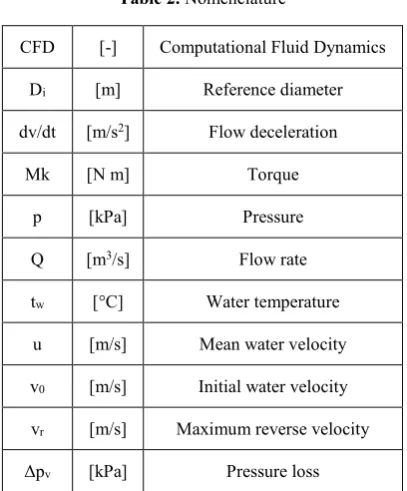
Table 2. Nomenclature
CFD [-] Computational Fluid Dynamics
Di [m] Reference diameter
dv/dt [m/s2] Flow deceleration
Mk [N m] Torque
p [kPa] Pressure
Q [m3/s] Flow rate
tw [°C] Water temperature
u [m/s] Mean water velocity
v0 [m/s] Initial water velocity
vr [m/s] Maximum reverse velocity
Δpv [kPa] Pressure loss
References
1. ČSN EN 1267. Industrial valves – test of flow resistance using water as test fluid. Praha: ÚNMZ, (2012)
2. Val-Matic valve and manufacturing corp. Design and Selection Criteria of Check Valves (Elmhurst: Val-Matic valve and manufacturing corp.) p 26 (2011)
3. J. V. Ballun, A methodology for predicting check valve slam Journal AWWA 99 3 pp 60–65 (2007) 4. A. R. D. Thorley, Fluid Transients in Pipeline
Systems (Hadley Wood: D&L George Ltd.) (1991) 5. W. Rahmeyer, Dynamic flow testing of check
valves Nuclear industry check valve group (St. Petersburg, Florida) pp 9 (1996)
6. D. Himr, V. Habán, M. Hudec,
Experimental investigation of check valve behaviour during the pump trip. In Journal of Physics: Conference Series. Journal of Physics: Conference Series. Institute of Physics Publishing. s. 1-5. ISSN: 1742-6588 (2017)
7. W. Rahmeyer, Dynamic flow testing of check valves. Nuclear industry check valve group, Winter meeting, St. Petersburg, Florida (1996)
![Fig. 6. Testing circuit scheme [6]](https://thumb-us.123doks.com/thumbv2/123dok_us/8002996.1329514/3.595.309.548.60.564/fig-testing-circuit-scheme.webp)