Clinical Ophthalmology
Dove
press
O r i g i n a l r e s e a r C h
open access to scientific and medical research
Open access Full Text article
evaluation of actual retinal images produced
by misaligned aspheric intraocular lenses
in a model eye
Takashi Fujikado1
Makoto saika2
1Department of applied Visual science,
Osaka University graduate school of Medicine, Osaka, Japan; 2research and
Development Department of Topcon Corporation, Tokyo, Japan
Purpose: To examine the effect of misalignment (decentration and tilt) of intraocular lenses (IOLs) on retinal image quality using a water-immersed model eye with corneal spherical aberration adjusted to the values found in normal human eyes (spherical aberration 0.25 µm; pupil diameter 6 mm).
Methods: Three types of IOL holders were prepared. The first was without decentration or
tilt, the second had a decentration of 0.5 mm, and the third had a tilt of 5.0°. One spherical IOL and three aspherical IOLs, each with a power of +20 D, were set in the holders and their optical properties (wave front aberration, defocused modulation transfer function, defocused point spread function, and Landolt ring simulations) were compared.
Results: Coma aberrations generated by misaligned IOLs were related to the spherical
aber-ration corrective power of the IOLs. Landolt ring simulations show that the depth of focus increased as spherical aberration increased and that the retinal image quality was degraded by increases in coma aberration.
Conclusion: Coma aberration was generated by IOLs with a large degree of spherical aberration correction, leading to reduced retinal image quality when the IOL was misaligned. This sug-gests that, in a clinical setting, the quality of vision might be improved by reducing the degree of coma aberration using IOLs that retain, or minimally correct, spherical aberration.
Keywords: coma aberration, decentration, misalignment, spherical aberration, tilt
Introduction
The human eye is prone to a number of monochromatic aberrations, including spherical, coma, astigmatism, field-curvature, and image-distortion aberrations, all of which are principally generated in the cornea and the crystalline lens.1,2 The most common aber-ration (spherical aberaber-ration) occurs when light waves which are parallel to the optic axis but at different distances from the optic axis fail to converge to the same point, producing a circular blurred image.3 In contrast, coma aberrations occur when light waves focus either side of the plane producing a “tear-drop”-shaped image. Removal of the crystalline lens followed by insertion of an intraocular lens (IOL) during cataract surgery provides an opportunity to modify the spherical aberration of the eye, thereby improving visual function.4–6 To do this, aspherical IOLs have been designed that either: 1) nullify the spherical aberration of the whole eye, thereby focusing an image at the plane of focus with good contrast; 2) reduce the spherical aberration of the whole eye to approximately 0.1 µm (pupil diameter 6 mm; a value typically found in healthy young people); or 3) decrease the spherical aberration of the IOL to approximately zero, thereby retaining the spherical aberration of the cornea.7–9
Correspondence: Takashi Fujikado Department of applied Visual science, Osaka University graduate school of Medicine, 2-2 Yamadaoka, suita, Osaka 565-0871, Japan
Tel +81 6 6879 3941 Fax +81 6 6879 3948
email [email protected]
Journal name: Clinical Ophthalmology Article Designation: Original Research Year: 2014
Volume: 8
Running head verso: Fujikado and Saika Running head recto: Intraocular lens misalignment DOI: http://dx.doi.org/10.2147/OPTH.S72053
Clinical Ophthalmology downloaded from https://www.dovepress.com/ by 118.70.13.36 on 21-Aug-2020
For personal use only.
This article was published in the following Dove Press journal: Clinical Ophthalmology
28 November 2014
Dovepress
Fujikado and saika
Numerous studies have reported the misalignment of IOLs in postoperative eyes.10–13 In these studies, average levels of decentration and tilt were 0.30±0.16 mm and 2.62°±1.14°, respectively.4 Given that misalignments can lead to a reduction in visual performance for some, but not all IOLs, it is important to assess the impact of misalignment on the quality of the retinal image for indi-vidual lenses.10,12,14,15 Marcos et al investigated the optical performance of eyes and found that the optical quality with aspherical IOLs was better but tolerance to defocus was lower.16 The theoretical effect of decentration of aspheri-cal IOLs (spheriaspheri-cal aberration -0.287 µm) was reported by Wang and Koch.17 However, in these studies, they evaluated only one type of aspherical IOL. The purpose of the present study was therefore to create a model eye with aligned or misaligned spherical and aspherical IOLs in order to measure the optical properties (wave front aberration, modulation transfer function [MTF], point spread function [PSF], and retinal image) of IOLs with various degrees of spherical aberration correction.
Methods
Model eye
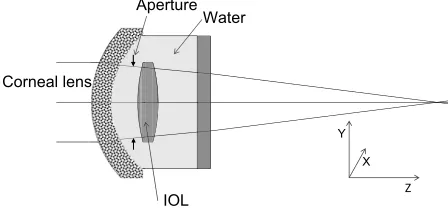
The lens for the cornea of the model eye was made from Optical glass S-BSL 7 (OHARA INC., Kanagawa, Japan) with a power of 40 D and a spherical aberration of 0.25 µm (the corneal spherical aberration of a typical human eye). IOLs were fixed in a model-eye holder and immersed in water. The aperture was set in front of the IOL, and the diameter needed to produce an image of the pupil with a diameter of 6 mm on the cornea was determined (Figure 1). Three types of IOL holder were prepared. The first was without misalignment, the second was decentered downwards by 0.5 mm along the Y-axis, and the third was rotated clockwise to produce a tilt of 5.0° around the X-axis. These values were selected to reflect the misalignments reported by clinical studies.18
Wave front aberration measurements
Wave front aberration measurements were performed with a front-open Hartmann–Shack (HS) aberrometer code-veloped by Topcon (Tokyo, Japan) and Aston University ( Birmingham, UK).19 The model eye was fixed to the aber-rometer using a specially designed holder, and the axes of both instruments were aligned. The high-order wave front aberration of the model eye was expanded to the sixth order of Zernike polynomials with a 6 mm diameter. Third- and fourth-order aberrations of Zernike terms were also investigated. In order to obtain a clear PSF for each IOL, measurements were performed three times without removing the IOLs, and the best PSF for each IOL was used for analysis. The Zernike polynomial is an orthogonal function defined within a unit circle with a radius of 1. The Zernike coefficients were expressed according to the ANSI X80.28-2004 standard.
Measurement of MTF and PsF
Defocused MTF and PSF measurements were performed using a Matrix-Plus (UNIPULSE Corp., Tokyo, Japan) in which the fundus had been detached from the model eye. The Matric-Plus is a piece of lens-testing equipment that mea-sures the MTF, describing the optical performance of lenses and optical systems; it is accredited by the United Kingdom Accreditation Service. The distance between the pinhole and the model eye was fixed at 50 cm (2 D). The position of the pinhole corresponds to the position of object. The PSF was measured while moving the photodetector. The photodetector corresponds to the fundus. The MTF is calculated by taking the Fourier transform of the PSF. The best image surface was set at a position where the MTF value with 30 lines/mm became maximal, and the ±1.5 D defocus measurement was performed at a 0.15 D (0.05 mm) step. Because the intensity of the PSF varied considerably depending on the aberration or the defocus status, the exposure time for the PSF image was adjusted so the intensity at the center was approximately constant.
landolt ring simulations
Simulated Landolt rings were obtained using software devel-oped in-house. From the third- and fourth-order Zernike coefficients, the position of the best image surface with the highest Strehl ratio was obtained. The Zernike defocus term (Z20) corresponding to ±0.5 D from the focused position was used to obtain the defocused image of the Landolt ring.
iOls
Four types of three-piece acrylic IOLs were examined, each with a power of +20 D. The first of these IOLs (A) was
Water
IOL Corneal lens
Z
X Y
Aperture
s
Figure 1 Model eye and optical path diagram of an iOl without misalignment. Abbreviation: iOl, intraocular lens.
Clinical Ophthalmology downloaded from https://www.dovepress.com/ by 118.70.13.36 on 21-Aug-2020
Dovepress intraocular lens misalignment
spherical, whereas IOLs B, C, and D were aspherical. The corrected values of spherical aberration were -0.27 µm for IOL B (corneal aberration fully corrected on average), -0.17 µm for IOL C (whole eye aberration similar to that found in young subjects [0.1 µm]), and -0.04 µm for IOL D (IOL spherical aberration value approximately 0). Each IOL was fixed in three different types of holder, and wave front aber-ration, defocused MTF, and defocused PSF were measured sequentially. IOLs were then refixed in the holders, and measurements were repeated three times. The median value for each IOL was used for analysis. Landolt ring simula-tions were performed based on the high-order aberrasimula-tions measured by the Hartmann–Shack aberrometer.
Results
Visual quality for iOls without
misalignment
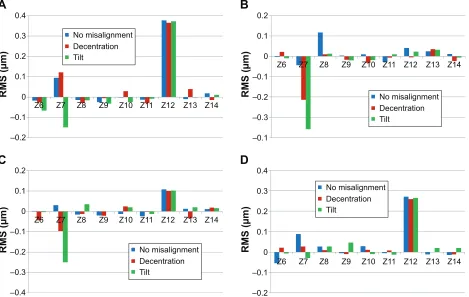
Wave front aberration measurements show that spherical aberrations for IOLs A, B, C, and D were 0.36, 0.05, 0.11, and 0.28 µm, respectively (Figure 2, IOLs A, B, C, and D). These values are consistent with a corneal
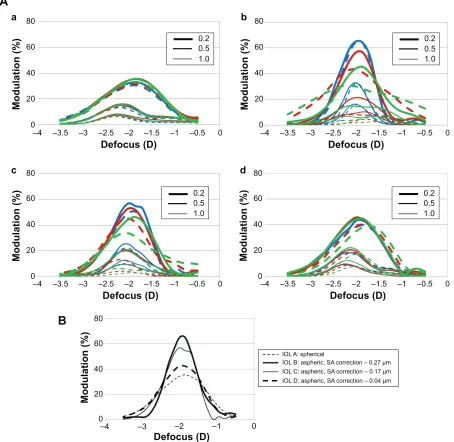
spherical aberration of 0.25 µm. Peak MTF values increased concomitantly with a decrease in spherical aberration (Figure 3A, IOLs A, B, C, and D). The vertical and hori-zontal MTF values were nearly equal, which suggests coma aberration was not induced.
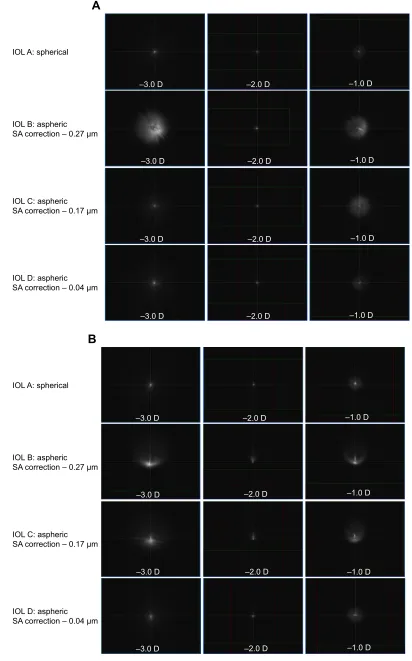
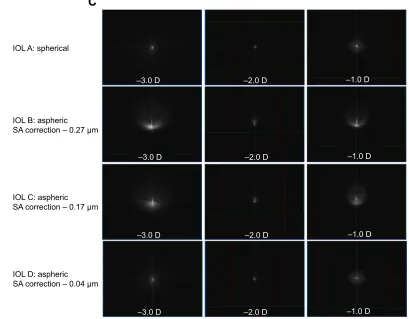
When the degree of spherical aberration correction was zero or small (ie, the spherical aberration in the eye was large), a small point image was observed (Figure 4A, IOLs A and D). The size of the point image did not change even when defocus was added, which suggests the depth of focus for these IOLs was large. In contrast, the image point for IOLs with a high degree of aberration correction enlarged, and the tail became narrower, when defocus was added (Figure 4A, IOLs B and C).
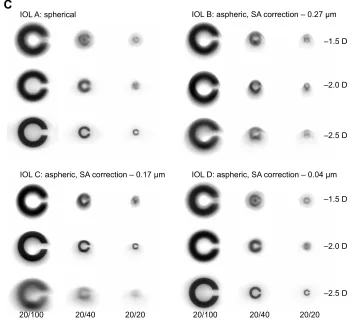
Landolt ring simulations show that the depth of focus increased when the degree of spherical aberration correction was zero or small (Figure 5A, IOLs A and D). However, images produced by IOLs with a high degree of spheri-cal aberration correction were clear at the plane of focus. These results are consistent with the observed MTF values (Figure 5A, IOLs B and C).
A
RMS (µm)
C
RMS (µm)
B
RMS (µm)
0.4 0.2
0.1
0
–0.1
–0.2
–0.3
–0.1
D
RMS (µm)
0.4
0.3
0.2
0.1
0
–0.1
–0.2 0.3
0.2
0.1
0
Z6 Z7 Z8 Z9 Z10 Z11 Z12 Z13 Z14
Z6 Z7 Z8 Z9 Z10 Z11 Z12 Z13 Z14
Z6 Z7 Z8 Z9 Z10 Z11 Z12 Z13 Z14
Z6 Z7 Z8 Z9 Z10 Z11 Z12 Z13 Z14
–0.1
–0.2
0.2
0.1
0
–0.1
–0.2
–0.3
–0.4
No misalignment Decentration Tilt
No misalignment Decentration Tilt
No misalignment Decentration Tilt
No misalignment Decentration Tilt
Figure 2 high-order aberrations for iOls in a water-immersed model eye (pupil diameter 6 mm).
Notes: (A) iOl a: spherical iOl. (B) iOl B: aspheric iOl, sa correction -0.27 µm. (C) iOl C: aspheric iOl, sa correction -0.17 µm. (D) iOl D: aspheric iOl, sa
correction -0.04 µm. The Z coefficients are expressed as single indexes according to the ISO 24157: 2008. Z7 represents vertical coma aberration, and Z12 represents
spherical aberration. Whole eye spherical aberration is the sum of the spherical aberration of the cornea and the spherical aberration of the iOl.
Abbreviations: iOl, intraocular lens; isO, international Organization for standardization; rMs, root mean square; sa, spherical aberration; Z, Zernike.
Clinical Ophthalmology downloaded from https://www.dovepress.com/ by 118.70.13.36 on 21-Aug-2020
Dovepress
Fujikado and saika
Modulation (%
)
a
A
b
c d
80
60 0.20.5
1.0
0.2 0.5 1.0
0.2 0.5 1.0 0.2 0.5 1.0 40
20
0
Modulation (%
)
80
60
40
20
0
Modulation (%
)
80
60
40
20
0
Modulation (%
)
80
60
40
20
0
–4 –3.5 –3 –2.5 –2 –1.5 –1 –0.5 0
Defocus (D)
–4 –3.5 –3 –2.5 –2 –1.5 –1 –0.5 0
Defocus (D)
–4 –3.5 –3 –2.5 –2 –1.5 –1 –0.5 0
Defocus (D)
–4 –3.5 –3 –2.5 –2 –1.5 –1 –0.5 0
Defocus (D)
Modulation (%
)
Defocus (D)
80
IOL A: spherical
IOL B: aspheric, SA correction – 0.27 µm IOL C: aspheric, SA correction – 0.17 µm IOL D: aspheric, SA correction – 0.04 µm
60
40
20
0
–4 –3 –2 –1 0
B
Figure 3 Defocused MTF for iOls in water-immersed model eyes (pupil diameter 6 mm).
Notes: (A) Without misalignment (blue line), with a decentration of 0.5 mm (red line), with a tilt of 0.5° (green line), and with MTF values at spatial frequencies corresponding to decimal visual acuities ranging from 0.2 to 1.0. (a) iOl a: spherical iOl. (b) iOl B: aspheric iOl, sa correction -0.27 µm. (c) iOl C: aspheric iOl, sa correction -0.17 µm. (d) iOl D: aspheric iOl, sa correction -0.04 µm. (B) Without misalignment and with visual acuity of 0.2. The solid line represents the vertical MTF value and the dotted
line represents the horizontal MTF value. The object surface was fixed at the 2 D position for measurement.
Abbreviations: iOl, intraocular lens; MTF, modulation transfer function; sa, spherical aberration.
Visual quality with misaligned iOls
Wave front aberration measurements for decentered or tilted IOLs show that the degree of spherical aberration was similar to that observed for IOLs without misalignment (Figure 2, IOLs A, B, C, and D). However, vertical coma aberrations for decentered IOLs (0.12, –0.21, –0.10, and 0.03 µm for IOLs A, B, C, and D, respectively) and tilted IOLs (-0.15, -0.36, -0.25, and -0.03 µm for IOLs A, B, C, and D, respectively) were proportional to the spherical aberration corrective power of the lens. Vertical coma
aberrations with tilted IOLs were larger than those observed with decentered IOLs.
For IOLs that induced a high level of vertical coma aberration, defocused MTF values decreased for both decen-tered and tilted IOLs, whereas the differences between verti-cal and horizontal MTF values increased (Figure 3A, IOLs B and C). Characteristic vertical coma aberrations showing an upward tail were observed at the defocused plane of -2.0 D and at -1.0 D (Figure 4B, IOLs B and C and Figure 4C, IOLs B and C). At the plane of focus, Landolt ring images
Clinical Ophthalmology downloaded from https://www.dovepress.com/ by 118.70.13.36 on 21-Aug-2020
Dovepress intraocular lens misalignment
IOL A: spherical
A
–3.0 D –2.0 D –1.0 D
–3.0 D –2.0 D –1.0 D
–3.0 D –2.0 D –1.0 D
–3.0 D –2.0 D –1.0 D
IOL B: aspheric SA correction – 0.27 µm
IOL C: aspheric SA correction – 0.17 µm
IOL D: aspheric SA correction – 0.04 µm
IOL A: spherical
IOL B: aspheric SA correction – 0.27 µm
IOL C: aspheric SA correction – 0.17 µm
IOL D: aspheric SA correction – 0.04 µm
B
–3.0 D –2.0 D –1.0 D
–3.0 D –2.0 D –1.0 D
–3.0 D –2.0 D –1.0 D
–3.0 D –2.0 D –1.0 D
Figure 4(Continued)
Clinical Ophthalmology downloaded from https://www.dovepress.com/ by 118.70.13.36 on 21-Aug-2020
Dovepress
Fujikado and saika
IOL A: spherical
C
IOL B: aspheric SA correction – 0.27 µm
IOL C: aspheric SA correction – 0.17 µm
IOL D: aspheric SA correction – 0.04 µm
–3.0 D –2.0 D –1.0 D
–3.0 D –2.0 D –1.0 D
–3.0 D –2.0 D –1.0 D
–3.0 D –2.0 D –1.0 D
Figure 4 Defocused PsF images for iOls in a water-immersed model eye (pupil diameter 6 mm).
Notes: (A) Without misalignment; (B) with a decentration of 0.5 mm; and (C) with a tilt of 0.5°. The plane of focus was set at -2.0 D, and PsFs were measured at -3.0, -2.0, and -1.0 D. Due to the fact that image intensity varied depending on the degree of aberration or defocus, exposure time was adjusted to equalize the central intensities.
Abbreviations: iOl, intraocular lens; PsF, point spread function; sa, spherical aberration.
produced by decentered IOLs with a high spherical aber-ration corrective power were clear even in the presence of vertical coma aberration, whereas vertical coma aberration led to blurred images at the plane of defocus (Figure 5B, IOLs B and C). For the same IOLs without decentration but with tilt, blurring due to vertical coma aberrations was large at the plane of focus and even larger at the plane of defocus (Figure 5C, IOLs B and C).
For misaligned IOLs with little or no spherical aberra-tion correcaberra-tion, levels of vertical coma aberraaberra-tion were low (Figure 2, IOLs A and D); defocused PSF (Figure 4B and C, IOLs A and D) and Landolt ring simulations (Figure 5B and C, IOLs A and D) were not significantly affected by defocus; and the depths of focus were high.
Discussion
The relationship between depth of focus and MTF has been studied by Marcos et al.16,20 In their 1999 paper,20 they nor-malized the peak position of defocused MTF and defined the depth of focus as the range with values of 60% of the peak
value or higher. However, in their 2005 paper,16 they did not refer to the specific numerical values as a depth of focus, but instead qualitatively described the depth of focus based on the shapes of graphs and retinal simulation images. Based on the results of vertical MTF corresponding to decimal visual acuity of 0.2 without misalignment (Figure 3B) and based on the results of Landolt ring simulation, our current study has also indicated that the depth of focus increased with the increase of the residual value of spherical aberration. In the absence of misalignment, our results also showed that the difference between vertical and horizontal MTFs for each lens (a measure of coma aberration) was small, irre-spective of the degree of spherical aberration (Figure 3A). In contrast, the differences between vertical and horizontal MTFs for misaligned lenses increased with the spherical aberration corrective power of the lens (Figure 3A). These observations are consistent with our wave front aberration measurements (Figure 2), and with theoretical calculations that form the basis of lens-aberration theory.21 The latter states that, when the misalignment of a lens is small, the
Clinical Ophthalmology downloaded from https://www.dovepress.com/ by 118.70.13.36 on 21-Aug-2020
Dovepress intraocular lens misalignment
IOL A: spherical
A
IOL B: aspheric, SA correction – 0.27 µm
–1.5 D
–2.0 D
–2.5 D
–1.5 D
–2.0 D
–2.5 D
20/100 20/40 20/20 20/100 20/40 20/20 IOL C: aspheric, SA correction – 0.17 µm IOL D: aspheric, SA correction – 0.04 µm
IOL A: spherical IOL B: aspheric, SA correction – 0.27 µm
IOL C: aspheric, SA correction – 0.17 µm IOL D: aspheric, SA correction –0.04 µm –1.5 D
–2.0 D
–2.5 D
–1.5 D
–2.0 D
–2.5 D
20/100 20/40 20/20 20/100 20/40 20/20
B
Figure 5(Continued)
Clinical Ophthalmology downloaded from https://www.dovepress.com/ by 118.70.13.36 on 21-Aug-2020
Dovepress
Fujikado and saika
Figure 5 landolt ring simulations corresponding to iOls in a water-immersed model eye (pupil diameter 6 mm).
Notes: (A) Without misalignment; (B) with a decentration of 0.5 mm; and (C) with a tilt of 0.5°. The position of the best image surface where the strehl ratio was highest was set at -2.0 D. The defocused image was calculated by inserting the Zernike defocus term (Z20) corresponding to ±0.5 D from the best-image position.
Abbreviations: iOl, intraocular lens; sa, spherical aberration.
IOL A: spherical
C
IOL B: aspheric, SA correction – 0.27 µm
–1.5 D
–2.0 D
–2.5 D
–1.5 D
–2.0 D
–2.5 D
20/100 20/40 20/20 20/100 20/40 20/20 IOL C: aspheric, SA correction – 0.17 µm IOL D: aspheric, SA correction – 0.04 µm
degree of spherical aberration is independent of the misalign-ment, whereas the degree of coma aberration is proportional both to the degree of IOL misalignment and to the level of spherical aberration.
In our study, the IOLs with low spherical correction power (ie, high levels of spherical aberration in the eye) had the lowest peak MTF values and the broadest tails (Figure 3A). The point of focus was shifted depending on the spatial frequency. These observations support those from previous studies, which suggest that the influence on visual outcome is large for IOLs with corrected spheri-cal aberration.10,17 However, although PSF measurements showed little difference between IOLs in the quality of the image at the plane of focus, at the plane of defocus the image focus spread as the spherical aberration corrective power increased (Figure 4A-C). Similar results were obtained from Landolt ring simulations (Figure 5A–C). Here, the image at the plane of focus was sharpest for IOLs with a high degree of spherical aberration correction (IOLs B and C) but images degraded with defocus and misalignment. In contrast, IOLs with little or no corrective power (IOLs
A and D) produced an image that was slightly blurred at the plane of focus but was hardly affected by defocus or misalignment. These results are supported by lens aberration theory.21 However, since the cornea itself has a coma aberra-tion that increases with age,18,22 further studies are necessary to evaluate the effects of IOL misalignment on retinal image in eyes with coma aberration in the cornea.
The levels of decentration and tilt selected for this study were based on typical IOL misalignments observed in clini-cal practice (average decentration of 0.30±0.16 mm and tilt of 2.62°±1.14°).10 However, because decentration and tilt are two-dimensional vectors, some studies have reported misalignments, not only in terms of magnitude, but also in terms of direction.23,24 The directionality of misalignment was not investigated in the present study.
Conclusion
The present study investigated the actual retinal images gen-erated by misaligned spherical and aspherical IOLs using a custom-built model eye. We found that, for IOLs that correct spherical aberration, IOL misalignment was associated with
Clinical Ophthalmology downloaded from https://www.dovepress.com/ by 118.70.13.36 on 21-Aug-2020
Clinical Ophthalmology
Publish your work in this journal
Submit your manuscript here: http://www.dovepress.com/clinical-ophthalmology-journal Clinical Ophthalmology is an international, peer-reviewed journal covering all subspecialties within ophthalmology. Key topics include: Optometry; Visual science; Pharmacology and drug therapy in eye diseases; Basic Sciences; Primary and Secondary eye care; Patient Safety and Quality of Care Improvements. This journal is indexed on
PubMed Central and CAS, and is the official journal of The Society of Clinical Ophthalmology (SCO). The manuscript management system is completely online and includes a very quick and fair peer-review system, which is all easy to use. Visit http://www.dovepress.com/ testimonials.php to read real quotes from published authors. Dovepress
Dove
press
intraocular lens misalignment
degraded retinal images due to increased coma aberration, and that coma aberrations were related to the degree of spherical aberration correction by the IOL. This suggests that, in clinical practice, the quality of vision can potentially be improved by reducing the risk of coma aberration using IOLs that retain, or have little effect on, the spherical aber-ration of the eye.
Disclosure
The authors report no conflicts of interest in this work.
References
1. Millodot M, Sivak J. Contribution of the cornea and lens to the spherical aberration of the eye. Vision Res. 1979;19:685–687.
2. Artal P, Guirao A. Contributions of the cornea and the lens to the aber-rations of the human eye. Opt Lett. 1998;23:1713–1715.
3. Howland HC, Howland B. A subjective method for the measurement of monochromatic aberrations of the eye. J Opt Soc Am. 1977;67: 1508–1518.
4. Denoyer A, Le Lez ML, Majzoub S, Pisella PJ. Quality of vision after cataract surgery after Tecnis Z9000 intraocular lens implantation: effect of contrast sensitivity and wavefront aberration improvements on the quality of daily vision. J Cataract Refract Surg. 2007;33:210–216. 5. Sandoval HP, Fernández de Castro LE, Vroman DT, Solomon KD.
Comparison of visual outcomes, photopic contrast sensitivity, wave-front analysis, and patient satisfaction following cataract extraction and IOL implantation: aspheric vs spherical acrylic lenses. Eye (Lond). 2008;22:1469–1475.
6. Caporossi A, Martone G, Casprini F, Rapisarda L. Prospective ran-domized study of clinical performance of 3 aspheric and 2 spherical intraocular lenses in 250 eyes. J Refract Surg. 2007;23:639–648. 7. Holladay JT, Piers PA, Koranyi G, van der Mooren M, Norrby NE.
A new intraocular lens design to reduce spherical aberration of pseu-dophakic eyes. J Refract Surg. 2002;18:683–691.
8. Lu CW, Smith G. The aspherizing of intra-ocular lenses. Ophthalmic Physiol Opt. 1990;10:54–66.
9. Atchison DA. Design of aspheric intraocular lenses. Ophthalmic Physiol Opt. 1991;11:137–146.
10. Eppig T, Scholz K, Löffler A, Messner A, Langenbucher A. Effect of decentration and tilt on the image quality of aspheric intraocular lens designs in a model eye. J Cataract Refract Surg. 2009; 35:1091–1100.
11. Crnej A, Hirnschall N, Nishi Y, et al. Impact of intraocular lens haptic design and orientation on decentration and tilt. J Cataract Refract Surg. 2011;37:1768–1774.
12. Baumeister M, Bühren J, Kohnen T. Tilt and decentration of spherical and aspheric intraocular lenses: effect on higher-order aberrations. J Cataract Refract Surg. 2009;35:1006–1012.
13. Mutlu FM, Erdurman C, Sobaci G, Bayraktar MZ. Comparison of tilt and decentration of 1-piece and 3-piece hydrophobic acrylic intraocular lenses. J Cataract Refract Surg. 2005;31:343–347.
14. Tabernero J, Piers P, Benito A, Redondo M, Artal P. Predicting the optical performance of eyes implanted with IOLs to correct spherical aberration. Invest Ophthalmol Vis Sci. 2006;47:4651–4658.
15. Altmann GE, Nichamin LD, Lane SS, Pepose JS. Optical performance of 3 intraocular lens designs in the presence of decentration. J Cataract Refract Surg. 2005;31:574–585.
16. Marcos S, Barbero S, Jiménez-Alfaro I. Optical quality and depth-of-field of eyes implanted with spherical and aspheric intraocular lenses. J Refract Surg. 2005;21:223–235.
17. Wang L, Koch DD. Effect of decentration of wavefront-corrected intraocular lenses on the higher-order aberrations of the eye. Arch Ophthalmol. 2005;123:1226–1230.
18. Applegate RA, Donnelly WJ 3rd, Marsack JD, Koenig DE, Pesudovs K. Three-dimensional relationship between high-order root-mean-square wavefront error, pupil diameter, and aging. J Opt Soc Am A Opt Image Sci Vis. 2007;24:578–587.
19. Thibos LN, Applegate RA, Schwiegerling JT, Webb R; VSIA Standards Taskforce Members. Vision science and its applications. Standards for reporting the optical aberrations of eyes. J Refract Surg. 2002;18(5):S652–S660.
20. Marcos S, Moreno E, Navarro R. The depth-of-field of the human eye from objective and subjective measurements. Vision Res. 1999; 39:2039–2049.
21. Asano T. Theory and Practice of Lens Engineering. Tokyo: Optical Engineering and Technology Association; 1984:162–167. Japanese. 22. Wang L, Dai E, Koch DD, Nathoo A. Optical aberrations of the human
anterior cornea. J Cataract Refract Surg. 2003;29:1514–1521. 23. Rosales P, De Castro A, Jiménez-Alfaro I, Marcos S. Intraocular lens
alignment from purkinje and Scheimpflug imaging. Clin Exp Optom. 2010;93:400–408.
24. Mester U, Dillinger P, Anterist N. Impact of a modified optic design on visual function: clinical comparative study. J Cataract Refract Surg. 2003;29:652–660.
Clinical Ophthalmology downloaded from https://www.dovepress.com/ by 118.70.13.36 on 21-Aug-2020