Benefits of Using Lode Angle Dependent Fracture Models to Predict
Ballistic Limits of Armor Steel
Christian C. Roth1,*, Teresa Fras2, Norbert Faderl2, and Dirk Mohr1,3
1Department of Mechanical and Process Engineering, ETH Zurich, Switzerland
2French-German Research Institute of Saint-Louis (ISL), 5 rue du Général Cassagnou, 68301 Saint-Louis,
3Impact and Crashworthiness Lab, Department of Mechanical Engineering, Massachusetts Institute of Technology, Cambridge MA, USA
Abstract.Ductile fracture experiments are carried out at different stress states, strain rates and temperatures on a range of flat Mars 300 steel specimens to calibrate both a plasticity and a fracture model. To predict the onset of fracture a stress state and strain rate-dependent Hosford–Coulomb fracture initiation model is used. Single material impact experiments are performed on targets of homogenous and perforated Mars 300 plates by accelerating cylindrical Mars 300 impactors in a single-stage gas gun. It is shown that the chosen modeling approach allows accurate modeling of the plastic response as well as the fracture patterns.
1 Introduction
Armor steels are a family of steel grades specially designed for ballistic protection. They are characterized by exceptionally high strength, hardness and moderate ductility which are often required to mitigate ballistic and explosive threats. The present conference paper is an abridged version of [1], which is concerned with an armor steel known under the trade name Mars 300 featuring a minimum yield strength of 1300 MPa and a minimum hardness of 580 HB. It is used as homogenous plate in protective shields against kinetic energy projectiles or shape charges, as a part of light armors for ground vehicles and helicopters or heavy armors for MBT protection. As perforated plate it is used as add-on armor against the impact of small-caliber projectiles by decreasing their perforation capability.
In order to understand the mechanisms occurring in a material under high-velocity loading, as well as to be able to perform numerical studies, especially for virtual prototyping, a thorough understanding of the material’s plasticity and fracture properties is required. Recent research on ductile fracture has clearly demonstrated the importance of the effect of the Lode parameter. For example conventional fracture models (e.g. Johnson Cook) cannot explain the drop in ductility for biaxial tension stress states (0.33<η<0.667), while Lode angle dependent theories such as the Hosford-Coulomb fracture initiation model (Mohr and Marcadet, 2015) can fully explain this phenomenon. In the present work, a non-associated Hill’48 plasticity model is used in conjunction with the strain rate dependent Hosford Coulomb model to closely analyze the loading effects and fracture patterns during impact events in Mars 300 plates.
2 Material Characterization
2.1 Material and specimens
The thinnest available homogenous Mars 300 material (6 mm thick) is reduced to a thickness 1mm by grinding under permanent cooling to prevent any changes of the microstructure. Five different types of specimen (Fig. 1) are extracted by wire electric discharge machining from the grinded sheets. Uniaxial tension (UT) specimens, notched tensile specimens (NT10), mini-punch (PU) to be subjected to equi-biaxial loading, shear (SH) specimens featuring a single gage section and strip specimens for plane strain tension bending (VB) experiments.
Fig. 1. Specimen geometries for material characterization.
2.2 Experimental techniques
displacement control on a 100 kN hydraulic universal testing machine while the experiments at high strain rates are performed on a split-Hopkinson bar system equipped with a load inversion device [2]. Prior to testing a random speckle pattern is applied to the specimens. The relative displacement of two points on the respective upper and lower specimen shoulders (see blue dots in Fig. 1) is measured in all experiments by means of digital image correlation (VIC2D, Correlated Solutions), with a 5 MP camera at low strain rates and with a Photron SA-Z high speed camera at intermediate and high strain rates.
For the experiments on the SH specimens an additional 12 MP camera used to accurately (pixel edge length of 3.1 µm) measure the strain in the gage sections.
The bending and mini-punch fracture experiments are both performed at an actuator speed of 2 mm/min using specially designed devices, which are mounted onto the universal testing machine [XX]. Subsequently, to have direct access to the strain fields of test, stereo digital image correlation (3D DIC) is used.
2.3 Experimental results
Following standard equations, the true stress as well as the logarithmic axial and width strain are extracted from each of the three experiments per direction (0°, 45°, 90°), using virtual extensometers of length 4.5 mm (see also red dots in Fig. 1). Fig. 2a shows the true stress – true axial strain curves for the orientations 0°, 45° and 90° with respect to the material’s rolling direction. The Lankford coefficients, determined from the slope of the logarithmic width strain versus longitudinal strain under the assumption of incompressibility also show a direction dependence: r0=0.90, r45=0.94 and r90=0.92. The Mars300 yields at about 1380 MPa and exhibits a pronounced strain hardening up to its ultimate strength of approximately 2400 MPa.
Figure 2b shows representative force-displacement curves from the experiments with the NT10 specimens for different strain rates. A positive strain rate hardening effect is observed. Additionally, the local axial strain measurements, determined from a 0.6mm long virtual extensometer (see red dots in Fig. 1) are shown. It is remarkable that irrespective of the loading speed we measure a local axial strain of at the onset of fracture. The results from the temperature experiments reveal only a slight decrease in the maximum force of approximately 3% for the test at 120 °C (as compared to room temperature) and an almost unchanged displacement to fracture.
Results from the mini-punch (PU), bending (VB) and shear (SH) fracture experiments are shown in Fig. 3. Both force displacement as well as the effective strain according to
2 2
3 2
II II I I ε ε ε
ε
ε= + + (1)
are shown. The latter will be used for the calibration of the fracture model as described in the following section.
(a) (b)
Fig. 2. Experimental results: (a) true stress vs. logarithmic strain curves, (b) force/local axial strain-displacement curves at three loading speeds, (c) force/local axial strain-displacement curves at three temperatures.
For the mini-punch (equi-biaxial tension) an effective
strain of is determined, while the bending
experiment yields an effective strain of for plane strain tension and the shear test result is
.
Fig. 3. Results from the mini-punch, bending and shear fracture experiments.
3. Fracture model
The strain rate dependent Hosford-Coulomb fracture initiation model (Roth and Mohr, 2014) is used to describe the onset of fracture. It defines the equivalent plastic strain to failure for proportional loading as a function of the stress triaxiality and the Lode angle parameter θ ̅∈[-1,1],
σ
σ
−
= 3/2
2 3 ) ( 2 3 3 arccos 2 1 J J π
θ . (3)
This damage indicator framework predicts the onset of fracture once the condition
0
1
[ , , ]
f p pr f pd
εε
ε η θ ε
=
∫
(4)is met. At its heart lies the denominator
(
)
a(
)
na a a n pr f f f c f f f f f f c b 1 3 1 1 3 1 3 2 2 1 1 2 ) ( ) ( ) ( 2 1 ... ... ) 1 ( ] , [ − + + + − + − + − + = η θ η ε (5)
with the Lode angle parameter dependent trigonometric functions
−
= (1 )
6 cos 3 2 ] [ 1 θ π θ
f , = (3+ ) 6 cos 3 2 ] [ 2 θ π θ f ,
=− (1+ ) 6 cos 3 2 ] [ 3 θ π θ
f (6)
while the parameter a (the Hosford exponent, 1≤a≤2) controls the influence of the Lode angle parameter, b(γ)
incorporates the rate effect in the overall magnitude of strain as ≥ + < = 0 0 0 0 0 ln
1 ε ε
ε ε γ ε ε p p p for b for b
b (7)
and c controls the influence of the stress triaxiality.
While the strains to fracture from the fracture experiments are readily available, a hybrid approach need to be performed to access the loading paths to fracture for the NT10s. Numerical simulations are performed of all notched tension (Fig. 4) and shear experiments (Fig. 3) using the finite element software Abaqus/Explicit along with a strain rate and temperature-dependent plasticity model (Roth and Mohr, 2014). Fig. 4 shows the results in form of force/local axial strain – displacement plots as well as contour plots of 1/8 of the specimen. The contour plots reveal that while the surface strain remains almost constant at the location of the virtual extensometer (denoted by black dot) irrespective of the loading speed, the equivalent plastic strain in the specimen center increases significantly with a higher loading rate. The loading paths are then extracted from the critical element at the specimen center. Figure 5 shows the loading paths for all experiments performed in terms of the equivalent plastic strain-stress triaxiality (Fig. 5a) and equivalent plastic strain-Lode angle parameter (Fig. 5b).
The slow cases are shown in solid black lines and the intermediate and fast cases are plotted with solid red and blue lines respectively. For all plots, the onset of fracture, as predicted by the calibrated rate-dependent Hosford-Coulomb fracture model, is denoted by solid dots. With the fracture parameters given in Table 1, a good fit of the identified loading paths is obtained; the exception is the fracture strain of the slow NT10 test, which is slightly underestimated. Figure 6 shows the influence of the strain rate on the fracture locus for a three-dimensional representation and the fracture loci for the strain rates of =
0.001 /s (black W-shaped curve), =1 /s (red), and =100 /s (blue).
Fig. 4. Results from the numerical simulation of the NT10 experiments at different loading speeds.
(a) (b)
Fig. 5. Plots of the loading paths to fracture for the performed experiments with prediction of the calibrated model (solid dots): (a) triaxiality – and (b) Lode angle parameter - equivalent plastic strain.
Table 1. Fracture model parameters.
a b c
γ
n
1.349 0.3254 0.0755 0.0494 0.1
Fig. 6. Calibrated Hosford-Coulomb model for Mars 300 at three representative strain rates: (a) 3D representation.
4.1 Experimental techniques
All impact experiments are conducted at room temperature using a high-pressure single-stage gas gun. Helium is used as the propellant which results in a maximum admissible pressure of 80 bar and a peak performance of approximately 450 m/s (± 10 m/s) measured by a double-laser light barrier. Each impact is monitored by three high speed cameras which allow for observations from different angles: for the side view a Shimadzu HPV1, for the top view a SensiCam short-time camera and the impact location from a yaw angle of 45° to the projectile trajectory a HSFC Pro camera.
(a) (b)
Fig. 7. Components for the impact experiments: (a) Mars 300 impactor in a sabot and (b) close-up of the hole pattern in the perforated Mars 300 plate (front face).
Cylindrical impactors with a length of 30 mm and a diameter of 5 mm, resulting in a mass of 4.7 g, are wire EDM cut from homogenous Mars 300 plates with an initial thickness of 6 mm (Fig. 7a).
4.2 Experimental results
A total of 15 impact experiments are carried out in perforated Mars 300 plates (Fig. 7b) of the size 200 x 200 mm at impact speeds ranging from 400 m/s to 450 m/s. Overall, three representative impact cases are identified and analyzed with regard to the impact position and the damage pattern (Fig. 8): In case A, the projectile hits the target plate perpendicular to its surface with a velocity of v = 420±8 m/s in the center between three holes. A single plug is formed and ejected from the plate (Fig. 9). The measured residual velocity of the projectile after exiting the plate is v = 215±10 m/s. In case B, the cylinder strikes
the target plate between two holes with a velocity of v = 420±8 m/s at a slightly inclined trajectory. All four holes around the impact location are affected by the event. In contrast to case A, the cylinder causes ejection of a single, yet larger piece of debris, with a twofold damage mechanism (Fig. 9). While the material between the two holes directly below the cylinder’s impact location fails due to shear loading, the material between the other two holes is bent, with the debris acting as a cantilever beam. Upon exiting the plate, the residual velocity of the impactor is measured to v = 230±10 m/s.
Fig. 8. Impact positions and damage patterns of the three representative impact cases in the perforated plates – experimental and numerical comparison.
In case C, the cylinder hits the target plate on the edge of a hole with an initial velocity of v = 450±10 m/s. This asymmetric impact leads to a deviation of the cylinder’s trajectory through the hole (Fig. 8). No plate debris is ejected and only very local plastic deformation is observed on the impacted face of the plate close to the hole, while the back of the plate remains almost unaltered. Upon impact, the cylinder’s tip is eroded asymmetrically. Due to the contact with the inner hole edges, it is bent sequentially into an S-shape (Fig. 9). Upon exiting its velocity is reduced to v = 320±10 m/s .
4.3 Finite element analysis of impact tests
TO_SURFACE, is chosen which allows for element erosion.
Fig. 9. Strikers and debris of the three representative impact cases – experimental and numerical comparison. The white arrow indicates the side of the ejected debris that was directly underneath the striker.
Fig. 10. Case B: two stage debris formation. Cross-section cuts are taken from section marked by a white line.
Figure 10 shows the contour plots of the crack formation for case B. Shearing is induced between the plate part compressed dynamically by the moving striker and a part, which is stable. As the contact between the target and the impactor is not symmetrical, shear bands initiate at different time steps. 7 µs after the impact, the trace of a forming shear band is already visible (Fig. 10).
The first crack starts on the back side of the plate 0.5 µs later and at 11 µs it is fully formed, asymmetrically separating the first ligament. At the same time, a second crack initiates on the back side of the plate in the second ligament, fully breaking it 2 µs later. The formed debris has a free end, while the opposite side is still attached to the plate. As the cylinder continues to push this free end, the debris behaves similarly to a bent cantilever beam. This complex state leads to the formation of two additional shear bands in the narrowest part of the plate – they can be clearly observed at 31 µs. These cracks, causing the final plate perforation, start from front side of the plate. 4µs later, the material debris is fully separated from the plate.
Features and dimensions of the ejected debris observed in the simulation correspond to the experimentally observed ones (Fig. 9). the length (9.1 mm) and width of the section directly pushed by the cylinder (5.6 mm) as well as the opposite end (4.2 mm) are in accordance with the experimental measurements (8.95 mm, 5.7 mm and 4.18 mm).
(a)
(b) (c)
(d) (e)
Fig. 11. Case B: two stage debris formation. Evolution of the loading histories at (a) selected locations, (b-c) at initial fracture side, (d-e) at secondary fracture side. Solid turquoise line denotes fracture locus for a strain rate of 1000 /s .
shows the complexity of the loading scenario. Both sides are exposed to a wide range of triaxialities (mainly in the shear-tension regime) and moreover, the whole of the Lode parameter range is covered. This holds especially true for the second “bend” crack.
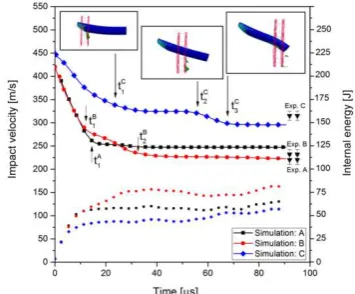
Figure 12 shows the time evolution of the internal energy of the target (dominated by its plastic strain energy]). The three curves show the correlation between the increase of the strain energy and the decrease of the striker’s velocity, affected by the localized deformation and fracture of the target plate. The highest increase of the internal plate energy is calculated for the impact case B, when the largest plate debris is pushed by the striker out from the plate. In case C, the projectile only deforms the edge of the impacted hole and consequently the energy absorption in the plate is the lowest.
Fig. 12. Changes in the striker’s velocity and the plate’s internal energy calculated numerically for three impact cases.
(a)
(b) (c)
Fig. 13. Impact scenario with hemispherical impactor in homogenous plate. (a) as seen by the high speed camera, (b) non-associated Hill’48 with rate dependent Hosford Coulomb fracture model, (c) Johnson-Cook model.
5 Comparison with Lode parameter
independent fracture model
To gain deeper insight into the effect of the Lode angle parameter, a simulation of an impact with a hemispherical striker into a 3 mm thick homogenous plate was simulated with the aforementioned model and a calibrated Johnson-Cook model.
It can be observed that the model from section 3 accurately predicts the fracture pattern and the plate deformation, while the Lode parameter independent model does not capture the fracture pattern. In addition he underlying hardening over predicts the deformation of the plate.
6 Conclusions
An experimental and numerical investigation on the material and impact properties of a strength and high-hardness armor steel (Mars 300) is carried out. A detailed description of the plastic behavior of the armor steel at different stress states, strain rates and temperatures is possible with a quadratic plasticity model with a combined Swift–Voce strain hardening law and a Johnson–Cook type of rate and temperature-dependency. In addition to that it is shown that in conjunction with the strain rate- and stress state-dependent dependent Hosford–Coulomb fracture initiation model it is possible to accurately describe impact scenarios and the fracture patterns in both homogenous as well as perforated plates using different impactors.
References
1. C.C. Roth and D. Mohr, Effect of Strain Rate on Ductile Fracture Initiation in Advanced High Strength Steel Sheets: Experiments and Modeling. International Journal of Plasticity 56 19–44 (2014)
2. C.C. Roth and D. Mohr, Ductile fracture experiments with locally proportional loading histories. International Journal of Plasticity 79 328-54 (2016) 3. D. Mohr and S. J. Marcadet,
Micromechanically-motivated Phenomenological Hosford-Coulomb Model for Predicting Ductile Fracture Initiation at Low Stress Triaxialites, International Journal of Solids and Structures, 67-68, 40-55 (2015)
4. G.R. Johnson and W.H. Cook, Fracture
characteristics of three metals subjected to various strains, strain rates, temperatures and pressures.
Engineering Fracture Mechanics 21: p. 31-48 (1985) 5. T Fras, L Colard, E Lach, A Rusinek, B Reck, Thick