SAE INDIA Velammal Collegiate Club, Velammal Engineering College, Chennai, India on 20 March 2015
Facility Layout Selection for the Blood
Inventory Using PROMETHEE II Method
S. Godwin Barnabas
1,
I.Ambroseedward
2, T. Ragunath
3Assistant Professor, Department Mechanical Engineering Velammal College of Engineering and Technology, Madurai,
Tamil Nadu, India
Assistant Professor, Department Mechanical Engineering Velammal College of Engineering and Technology, Madurai,
Tamil Nadu, India
P.G. Scholar, Department Mechanical Engineering Velammal College of Engineering and Technology, Madurai, Tamil
Nadu, India
ABSTRACT: Blood Inventory Management has attracted significant interest from the Operations Research profession during the last fifteen years. This paper aims to minimize the overall demand for the blood in the region is by prioritizing the collection centre’s as per their shortages, wastages, issue delays and outages by comparing the results of analytical hierarchy process (AHP) with PROMETHEE II method
KEYWORDS: Analytic Hierarchy Process, PROMETHEE II
I. INTRODUCTION
The location selection decision may be required due to various reasons, like change in production capacity, addition or deletion of product line, change in distribution cost orchange in customer demand. Wrong selection of location may result in inadequate qualified workforce, unavailability of raw materials, in sufficient transportation facility, increased operating expenses or even disastrous effect on the organization due to political and societal interference. It is also observed that the selection procedure involves several objectives and it is often necessary to make compromise among the possible conflicting criteria. For these reasons, multi-criteria decision- making(MCDM) is found to be an effective approach to solve the location selection problems. In this paper, the overall demand for the blood in the region is reduced by prioritizing the collection centre’s as per their shortages,
wastages, issue delays and outages by comparing the results of analytical hierarchy process (AHP) with
PROMETHEE II method the preference ranking organization method for enrichment evaluation (PROMETHEE II) is employed to obtain the best choice from a finite setoff alternative facilitylocations. While applying the
PROMETHEE IImethod to solve a real time facilitylocationselection problem [1], it is observed that this
method proves its applicability and potentiality to solve such types of decision-making problems with
multiple conflicting criteria and alternatives. PROMETHEE II method is compared with the Analytic Hierarchy Process (AHP) to prioritize the 4 blood collection centers in a zone.
II.LITERATURE REVIEW
SAE INDIA Velammal Collegiate Club, Velammal Engineering College, Chennai, India on 20 March 2015
Jennings was the first researcher to understand the true importance of this distinction.Cohen and Pierskalla [2] in
1975 attempted to use simple equations to set optimal inventory levels. Their analysis uses many variables,
such as rates of demand, the return of unused assigned blood back into available inventory, and thus the effects
of cross matching. Using simulation, they determine an optimal inventory level based on all
significantvariables and they also analyze various ordering policies, issuing policies, and cross matching policies
while viewing the supply of blood from a regional perspective. [3] proposed a solution approach
to facility location selection problems while integrating analytical and multicriteria decision-making models.
Houshyar andWhite [4] developed a mathematical model andheuristics approach that assigns N machines to Nequal-sized locations on a given site such that thetotal adjacency flow between the machines ismaximized. The proposed model is based on a 0-1 integer programming formulation which mayproduce an optimal, but infeasible
solution,followed by the heuristic which begins with the 0-1 integer solution and generates a
feasiblesolution . Owen and Daskin [ 5] provided anover view of the methodologies that have
beendeveloped for solving facility location selectionproblems.Chu [6] presented a fuzzy
TOPSIS(technique for order preference by similarity toideal solution) method-based approach for the plant
location selection problems. The ratings andweights assigned by the decision makers are first normalized
into a comparable scale. [7] reviewed in details the contributions to the current state-of-the-art relatedto
continuous location models, network locationmodels, mixed-integer programming models and their
applications to location selection decision.Yong [8] proposed a new fuzzy TOPSIS methodwhich deals with
the selection of plant locationdecision-making problems in linguisticenvironment. [9] presented aTOPSIS methodology
to find the supportivecenters with the minimum number and maximum quality of locations in military logistic
systems. Onut and Soner [10] employed a fuzzy TOPSIS based methodology to solve the solid waste
transshipment site selection problem, where thecriteria weights are estimated using
analytichierarchy process (AHP).Amiri et al. [11] applied TOPSIS methodalong with heuristics based on fuzzy goalprogramming to select the best location. Thefacility location selection problem is solved inthree stages, i.e. (a) finding the least number of distribution centers, (b) locating them in the bestpossible location, and (c) finding
the minimum cost of locating the facilities. Although the facility location selection problems have already
been solved using different MCDM techniques, thispaper makes a maiden attempt to implementanother appropriate MCDM approach, i.e.PROMETHEE II method to tackle this complexlocation selection decision-making problem
III.BLOOD DISTRIBUTION SCHEDULES
During the course of a day the Blood Bank receives a random number of transfusion requests for each blood type,
each request for a random number of; units. Once a request for a patient is received, the appropriate umber
of units of that type is removed from free inventory and upon successful cross matching they are placed
on reserve inventory for this particular patient. Any of those units that are not transfused are returned
back to free inventory. We will define demand to be the number of units requested, and usage to be the number
of units transfused. Any units which are not used within their 2l-day lifetime are considered outdated and are
discarded from inventory.The problem of managing blood supplies can be examined at two levels: the
individual hospital level, or the regional level.
At the hospital level, the objective is to determine decision rules to be used by the Hospital Blood Bank's management for the daily operations of the Blood Bank. Such decisions would involve quantities to collect or order from the Regional Blood Center, units to issuefrom inventory against transfusion requests, portion of fresh units to be frozen so that their lifetimes are extended, and development of computer information systems to provide accurate and timely
information and thus assist with the management of the Blood Bank's inventory management. At the
regional level, the objective of a Regional Blood Center is to determine achievable targets of performance
within a region, and to set up collection and distribution schedules that will achieve these
SAE INDIA Velammal Collegiate Club, Velammal Engineering College, Chennai, India on 20 March 2015
IV.CURRENT BLOOD SITUATION
The current trends in supply and demand of blood in the United States present a major problem that needs to
be addressed. The growth rate of supply is significantly smaller than the growth indemand. Although total
supply ofblood (as an aggregate statistic) exceeds total demand in the US, the disparity between growth rates
suggests that major shortage situations are imminent. Understanding thereasons for these growth trends
should help identify how to address impending shortages. The mismatchof supply and demand as well as
the shrinking gap between available supply and demand is a realistic cause for concernin the future.
V. METHEDOLOGY
A. The Analytic Hierarchy Process (AHP)
The Analytic Hierarchy Process (AHP) is a structured technique for dealing with complex decisions. Rather
than prescribing a "correct" decision, the AHP helps the decision makers find the one that best suits their
needsand their understanding of the problem. The AHP provides a comprehensive and rational framework
forstructuring a decision problem, for representing and quantifying its elements, for relating those elements to overall goals, and for evaluating alternative solutions. Once the hierarchy is built, the decision makers
systematically evaluate its various elements by comparing them to one another two at a time. In making the
comparisons, the decision makers can use concrete data about the elements, . It is the essence of the AHP
that human judgments, and not just the underlying information, can be used in performing the evaluations.
The outages, shortages for the four collection centre’s has been tabulated as follows
Collection centre1 details;
Collection center 2 details
Demand makingcriteria’s No ofunit/week
Demand making criteria’s No of unit/week
Outages 95
Outages 100
Shortages 165
Shortages 175
Issued delay 70
Issued delay 65
Wastages 100
Wastages 165
Collection center 2 details
Collection center 4 details;
Demand making criteria’s No of unit/week Demand makingcriteria’s No ofunit/week
Outages 110
Outages 90
Shortages 220
Shortages 205
Issued delay 80
Issued delay 85
Wastages 100
Wastages 165
SAE INDIA Velammal Collegiate Club, Velammal Engineering College, Chennai, India on 20 March 2015
alternatives.The AHP converts these evaluations tonumerical values that can be processed andcompared over the entire range of the problem.
STEPS INVOLVED IN AHP
The AHP converts these evaluations to numerical values that can beprocessed and compared over the
entire range of the problem. A numerical weight or priority is derived for each element of the hierarchy,
allowing diverse and often incommensurable elements to becompared to one another in a rational and
consistent way. This capability distinguishes the AHP from other decision making techniques. In the final step
of the process, numerical priorities are calculated for each of the decision alternatives. These numbersrepresent the alternatives' relative ability to achieve the decision goal, so they allow a straightforward consideration of the various courses of action. Scoring of the equipmentsThe values of the previous matrix are obtained by the earlier method, now by using the formula we are going to obtain the weightage for the each issue.
Whereas, r - rating factor; W - weightage factor The different priority levels reflect the hierarchical relationship between the targets in the objective function where they are arranged in order of decreasing priority (P1>P2>Pm)
S.No. Demand makingcriteria’s No ofunit/week
1 Outages 385
2 Shortages 765
3 Issued delay 300
4 Wastages 525
These are the data’s of the blood demands in the 4 hospitalsin a region for 8 types of blood types
now in order to find the priority among these criteria’s the pair wise comparison is madeagainst each of the
criteria’sfrom these values the inconsistency ratios are obtained .now the scoring of the of the each of the
criteria’sis obtained as follows
Here the rating factor is obtained by the inconsistency ratios (IR) averages of the each of these criteria’s such
as outages, shortages, issuedelays,wastages .the weightage factor is obtained by making pair wise comparison
is made for each of the criteria’s with one another. From the priorities obtained the goal programming is
SAE INDIA Velammal Collegiate Club, Velammal Engineering College, Chennai, India on 20 March 2015
Results of AHP
Ranking Demand criteria Priority Priority values
1. Issue delay P3 0.273
2. Wastages P4 0.255
3. Shortages P2 0.248
4. Outages P1 0.218
The decreasing priority is of the form P3>P4>P2>P1, the priorities obtained from the AHP results are compared with the PROMETHEE IImethod.
PROMETHEE II method
Preference function based outranking method is a special type of MCDM tool that can provide a
ranking ordering of the decision options. The PROMETHEE (preference ranking organization method for
enrichment evaluation) method was developed by Brans and Vincke in 1985 [11]. The PROMETHEE I method
can provide the partial ordering of thedecision alternatives, whereas, PROMETHEE II method can derive
the full ranking of the alternatives. Inthis paper, the PROMETHEE II method is employed to obtain thefull
ranking of the alternative locations fora given industrial application.The procedural steps as involved in
PROMETHEE II method are enlisted as below [11, 12]
Step 1: Normalize the decision matrix using the following equation:
Ri j= [ Xij- min (xij) ] / [ max (xij) – min (xij) ]
(i=1,2,…..n, j=1,2….m)
where Xij is the performance measure of ithalternative with respect to jth criterion.For non-beneficial criteria, Eqn. (1) can be rewritten as follows
Ri j= [min (xij) -Xij] / [ max (xij) – min (xij) ]
Step 2: Calculate the evaluative differences of ith alternative with respect to other alternatives.
This step involves the calculation of differences in criteria values between different alternatives pairwise.
Step 3: Calculate the preference function, Pj(i,i′).There are mainly six types of generalized preference
functions as proposed by Brans and Mareschal [12,13]. However, in real time applications, it may be difficult
for the decision maker to specify whichspecific form of preferencefunction is suitable for each criterion and
SAE INDIA Velammal Collegiate Club, Velammal Engineering College, Chennai, India on 20 March 2015
Pj(i’i)=0 if Rij≤Rij
Pj(i,i)=(Rij-Rij) if Rij>Rij
Step 4: Calculate the aggregated preference function taking into account the criteria weights.Aggregated
preference functionwhere wjis the relative importance (weight) of jthcriterion.
Π ( i, j' ) = [ ∑Wi ×Pj( i, j')] / ∑ Wj
Step 5: Determine the leaving and entering outranking flows as follows
Leaving (or positive) flow for ithalternative.
Ф (j) = [1/ (n-1)]* ∑ π (i, j')
Entering (or negative) flow for ith alternative,
Ф (i) = [1/ (n-1)]* ∑ π (i, j')
,where n is the number of alternatives.Here, each alternative faces (n–1) number of other alternatives.
The leaving flow expresses how much an alternative dominates the other alternatives, while the entering
flowdenotes how much an alternative is dominated by the other alternatives. Based on these outranking
flows, the PROMETHEE I method can provide a partial preorder of the alternatives, whereas, the
PROMETHEE II method can givethe complete preorder by using a net flow, though it loses much information
of preference relations.
Step 6: Calculate the net outranking flow for each alternative.
Ф (i)= Ф+ (i)- Ф- (i)
Step 7: Determine the ranking of all the considered alternatives depending onthe values of ϕ (i).The
higher value of ϕ (i), the better is the alternative. Thus, the best alternative is the one having the highest ϕ
(i) value.The PROMETHEE method is an interactive multi-criteria decision-making approach designed to
handle quantitative as well as qualitative criteria with discrete alternatives. The PROMETHEEmethod has
significant advantages over the other MCDM approaches.
VI. ILLUSTRATIVE EXAMPLE
Rao [1] employed the graph theory andmatrix approach (GTMA) for selection of the bestfacility
location for a given industrial application.The same example is considered hereto demonstratethe
applicability and effectiveness of PROMETHEEII method as a MCDM tool. This example takes intoaccount
SAE INDIA Velammal Collegiate Club, Velammal Engineering College, Chennai, India on 20 March 2015
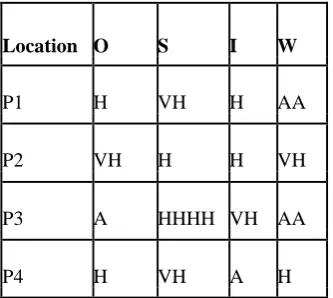
information regarding different location selection criteria are given in Table 1. Allthesecriteria, except the
cost of labor, are expressedsubjectively in linguistic terms. The objective valuesfor these criteria are assigned
from an 11-point scale,as given in Table 2. The fuzzy judgments average(A), aboveaverage (AA), high (H)
and very high(VH), shown in Table 1, are considered equivalent togood, very good etc. with respect to different criteria.The 4 selection criteria as considered here to affectthe location selection decision are closeness to emergency areas (CM), closeness to other blood bank (CR), low transportation cost (LT), maximum patient coverage (MC).
Table 1 Information for facility location alternatives[1]
Location O S I W
P1 H VH H AA
P2 VH H H VH
P3 A HHHH VH AA
P4 H VH A H
using the 11-point scale, as given in Table 2. The transformed objective data, as given in Table 3, are then normalized using Eqn. (1) or (2) and are given in Table 4. Rao [1] determined the criteria weights for the considered criteria as wO = 0.194, wS = 0.387, wI = 0.1518, wW = 0.265, using AHP method and the same criteria weights are used here for PROMETHEE II method-based analysis. Where wO, wS, wI, wW are the weightages for outages, shortages, issue delay, and wastages
Table 2 11-Point Fuzzy Scale
Linguistic term Crisp score
Exceptionally low 0.045
Extremely low 0.135
Very low 0.255
Low 0.335
Below average 0.410
Average 0.500
Above average 0.590
High 0.665
Very high 0.745
Extremely high 0.865
SAE INDIA Velammal Collegiate Club, Velammal Engineering College, Chennai, India on 20 March 2015
Table 3 Normalized decision matrix
Location CM CR LT MCC
P1 0.6735 1 0 0
P2 1 0 0 1
P3 0 0 1 0
P4 0.6735 1 0 0
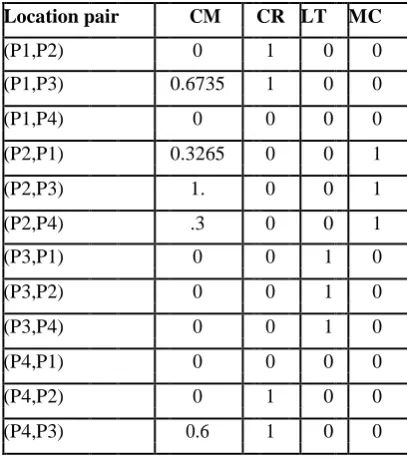
Now, the preference functions are calculated for all thepairs of alternatives, using Eqns. (3) and (4),
and are given in Table 5. Table 6 exhibits the aggregated preference function values for all the paired
alternatives, as calculated using Eqn. (5). The leaving and the entering flows for different location
alternatives are now computed using Eqns. (6) and (7) respectively, and are shownin Table 7.
Table 4 Preference functions for all the pairs of Alternatives
Location pair CM CR LT MC
(P1,P2) 0 1 0 0
(P1,P3) 0.6735 1 0 0
(P1,P4) 0 0 0 0
(P2,P1) 0.3265 0 0 1
(P2,P3) 1. 0 0 1
(P2,P4) .3 0 0 1
(P3,P1) 0 0 1 0
(P3,P2) 0 0 1 0
(P3,P4) 0 0 1 0
(P4,P1) 0 0 0 0
(P4,P2) 0 1 0 0
(P4,P3) 0.6 1 0 0
Table 5 Aggregated preference function
Location P1 P2 P3 P4
P1 - 0.387 0.518 0
P2 0.329 - 0.46 0.329
P3 0.1521 0.15211 - 0..1521
0 0.387 0,.518 -
SAE INDIA Velammal Collegiate Club, Velammal Engineering College, Chennai, India on 20 March 2015
Table 6 Leaving and entering flows for different
Location Leaving low Entering flow
P1 0.30166 0.160
P2 0.372 0.308
P3 0.152 0.498
P4 0.301 0.160
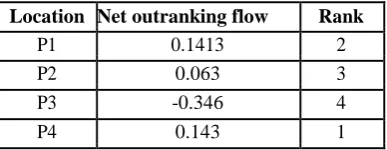
Table 7 Net outranking flow values for different
Location Net outranking flow Rank
P1 0.1413 2
P2 0.063 3
P3 -0.346 4
P4 0.143 1
The priorities of the collection centers are as followsP4>P1>P2>P3,The net outranking flow values for different alternative locations and their relativerankings are given in Table 8. Now, the alternative locations are arranged in descending order according to their net outranking flow values. The best choice of location for the given blood inventoryis location 2, which exactly matches with theobservations derived. While solving this problemusing graph theory and matrix approach. This proves the applicability and potentiality of the PROMETHEE II method for solving complexdecision-making problems in prioritizing the collection centre.
VII.CONCLUSION
The comparison of AHP- PROMETHEE II in the blood inventory has paved the way to minimize the demand for the blood requirement in the hospitals in a particular region by prioritizing shortages, outages, issue delay, and wastages in the 4 collection centers. The above said methodology is to minimize the overall deviations for blood demandregion or location by prioritizing the collection centers as per their shortages, outages, issue delay,and wastages in the collection centers. In future theoptimal blood inventory can be developed by using the dynamic programming model, markov chain and regression model etc.
REFERENCES
1.Jennings, 1968, “An Analysis of Hospital Blood Banks Whole Blood Inventory Control Policies Transfusion”, 8(6):335-342.
2.Cohen andPierskella, 1975, “Management Policies for a Regional Blood Bank Transfusion”, 11(1):58-67.
3.Randhawa S.U and West T.M., 1995, “An Integrated Approach to Facility Location Problem”, Computers and Industrial Engineering, 29,
261-265..Houshyar A, and White B, 1997, “Comparison of Solution Procedure to the Facility Location Problem”, Computers and IndustrialEngineering, 32,
77-87..Owen S.H, and Daskin M.S, 1998, “Strategic Facility Location: A Review”, European Journal of Operational Research, 111, 423-447.
6.Chu T.C, 2002, “Selecting Plant Location via a Fuzzy TOPSIS Approach”, International Journal of Advanced Manufacturing
Technology, 20, 859-864.
7.Klose A and Drexl A, 2005, “Facility Location Models for Distribution System Design”, European Journal of Operational Research, 162, 4-29.
8.Yong D, 2006, “Plant Location Selection Based on Fuzzy TOPSIS”, International Journal of Advanced Manufacturing Technology,
28, 839-844.
9.Farahani R.Z and Asgari N, 2007,“Combination of MCDM and Covering Techniques in a Hierarchical Model for Facility Location:A case study”,
European Journal of Operational Research, 176, 1839-1858.
10.Onut S and Soner S, 2008, “Transshipment Site Selection using the AHP and TOPSIS Approaches under FuzzyEnvironment”,Waste Management, 28, 1552-1559.