ABSTRACT
OWEN, MADISON EVERETT. Impact of Retail Attributes on Store Choice,
Customer Satisfaction and Customer Loyalty for Premium Denim. (Under the direction of Dr. Marguerite Moore.)
The purpose of the research was to determine the impact of retail attributes on shopping behaviors for the premium denim customer. Specifically, the study examined the influence of retail attributes on store choice, customer satisfaction and customer loyalty in the context of premium denim shopping.
This study used a quantitative research design; a questionnaire was distributed to shoppers in an upscale department store retail environment in order to collect data. The questionnaire included four sections: initial screening questions focused on premium denim buying behavior, retail attribute importance, store choice behaviors, satisfaction and loyalty measures and demographic information. The methodology design was designed to target premium denim shoppers in a retail environment in order to gain immediate judgments. A convenience sample of premium denim shoppers by a store intercept technique was used for the study. The sample consisted of 101 female respondents and was collected in an upscale department store in Raleigh, North Carolina.
matrices using a varimax method were used to identify three retail attribute factors (Service, Environmental, and Brands/Promotions), four store choice factors (Traditional Department Stores, Boutiques, Online Department Stores/Boutiques, and Upscale Department Stores), and two Satisfaction and Loyalty factors. The path analysis found potential relationships and evaluated the model fit, resulting in a best-fitting model with seven significant paths.
Results suggest the Service factor (including sales associates, customer service and store credit cards) and the Brands/Promotions factor (including favorite premium denim brands and the offering of promotions/sales) to be the most influential on store choice (Upscale Department, Boutique and Online Department/Boutique) for the premium denim shopper. Additionally, the following factors had significant relationships: customer
satisfaction to customer loyalty, the Environmental factor (store environment, merchandising of premium denim, and easy shopping environment) to customer satisfaction, and the
Impact of Retail Attributes on Store Choice, Customer Satisfaction and Customer Loyalty for Premium Denim
by
Madison Everett Owen
A thesis submitted to the Graduate Faculty of North Carolina State University
in partial fulfillment of the requirements for the degree of
Master of Science
Textiles
Raleigh, North Carolina 2011
APPROVED BY:
Dr. Marguerite Moore Dr. Nancy Cassill
Chair of Advisory Committee Committee Member
Dr. Tim Clapp Dr. Lori Rothenberg
ii BIOGRAPHY
Madison Everett Owen was born in Winston-Salem, North Carolina on September
29, 1987. She is the daughter of Mike and Elette Owen, and has one older sister, Ashlin. In
May 2005, she graduated from Davie County High School in Mocksville, North Carolina.
Upon graduation, she continued her education at North Carolina State University in the
College of Textiles. While at North Carolina State, Madison was a member of the North
Carolina State Dance Company for two years. In May 2009, she graduated Magna Cum
Laude with a Bachelor of Science in Textile and Apparel Management, with a
concentration in Fashion Development and Product Management.
In August of 2009, Madison began graduate school and granted a graduate
assistantship funded by North Carolina State University. She interned at Saks Fifth Avenue
in the summer of 2010 under the marketing director. During the course of her graduate
career, Madison was a teaching assistant and received the 2010 Outstanding Teaching
Assistant Award. Additionally, she served as a student delegate for the 2010 Doing
Business Internationally trip to Mexico City, Mexico. Her last semester Madison was the
Textile Apparel Technology and Management Career Management Coordinator, where she
helped develop an internship program for undergraduate students. She plans to complete
iii ACKNOWLEDGEMENTS
First, I would like to thank my advisory committee for their guidance and support
during the course of my graduate career. Particularly, I wish to thank Dr. Moore for being a
constant source of motivation and light. I cannot imagine my graduate career without Dr.
Moore and am thankful for her unwavering support. Dr. Moore’s role as an advisor, chair
of my advisory committee, professor, and mentor encouraged and uplifted me. I am also
very thankful to Dr. Cassill for providing strong vision and dedication, as well as
challenging me and believing in my abilities. Additionally, I would like to thank Dr. Clapp
for being the source of encouragement and inspiration to attend graduate school and serving
as a member on my committee. I am also thankful to Dr. Rothenberg for contributing her
expertise and serving as a member on my committee. I would like to thank my parents for
unconditionally loving me, believing in me and supporting my dreams. I am thankful to my
mom for being a source of comfort, unending love, security and laughter. I am thankful to
my dad for his love, support, wise advice and for inspiring me to work hard. I would like to
thank my sister, Ashlin, for being my best friend, being more patient than I could ever be,
and for having the kindest heart of anyone I know. Lastly, I am thankful to Austin for
providing emotional support, encouraging me to be the best person I can be, and for making
iv TABLE OF CONTENTS
LIST OF TABLES... vi
LIST OF FIGURES... vii
CHAPTER 1... 1
INTRODUCTION... 1
Purpose of Research... 1
Significance of Study... 2
CHAPTER II... 3
LITERATURE REVIEW... 3
Premium Denim... 3
Retail Attributes... 7
Customer Satisfaction and Loyalty... 9
CHAPTER 3... 12
RESEARCH METHODOLOGY... 12
Research Design... 12
Population and Sample... 13
Data Collection... 13
Questionnaire... 14
Analysis... 16
Preliminary Analysis... 16
Path Analysis... 17
CHAPTER 4... 18
RESULTS... 18
Sample Characteristics... 18
Shopping Behaviors... 20
Principal Components Analysis, Factor Analysis and Reliability... 22
Retail Attributes... 23
Store Choice... 25
Satisfaction and Loyalty... 27
Normality... 30
Path Analysis... 30
CHAPTER 5... 38
CONCLUSIONS, IMPLICATIONS, LIMITATIONS, FUTURE RESEARCH... 38
Conclusions and Implications... 38
Statistical Conclusions... 38
Research Questions... 41
v
REFERENCES... 49
APPENDIX... 53
Appendix A... 54
vi LIST OF TABLES
Table 1 Retail Attributes and the Corresponding Sources………15
Table 2 Gender of Questionnaire Respondents……….19
Table 3 Ethnicity of Questionnaire Respondents………..19
Table 4 Age in Years of Questionnaire Respondents………...……19
Table 5 Retail Buying Behavior in Percentage………...……..21
Table 6 Retail Buying Behavior Means………...…….22
Table 7 Retail Attribute Means and Standard Deviation………..………24
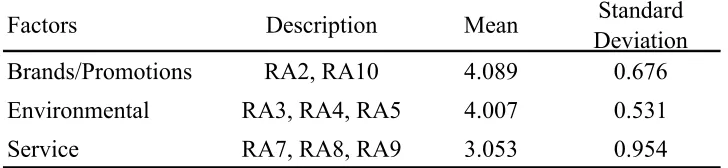
Table 8 Retail Attribute Factor Means and Standard Deviation………..…….25
Table 9 Store Choice Means and Standard Deviation………..……26
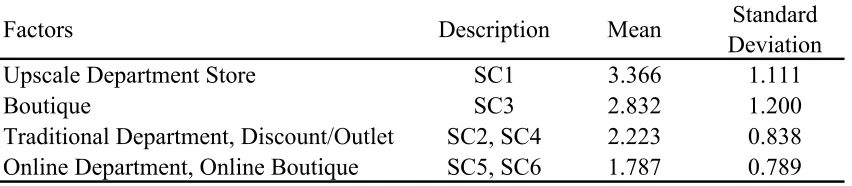
Table 10 Store Choice Factor Means and Standard Deviation………..….26
Table 11 Satisfaction and Loyalty Means and Standard Deviation………..…..27
Table 12 Satisfaction and Loyalty Factor Means and Standard Deviation…………...28
Table 13 Retail Attributes, Store Choice, and Satisfaction/Loyalty Eigenvalues of Principal Components Analysis………...29
Table 14 Model Fit Criteria for Saturated Path and Final Path Model………...…34
Table 15 Regression Weights, Covariances, Variances, and Squared Multiple Correlations for Saturated Path Model………..…..35
vii LIST OF FIGURES
Figure 1 Impact of Retail Attributes on Store Choice, Customer Satisfaction and
1 CHAPTER 1
INTRODUCTION
Denim has been a wardrobe staple in consumer closets for many years and continues
to thrive in today’s economy. According to Cotton Incorporated’s Lifestyle Monitor, 96
percent of consumers own denim jeans—with seven pairs being the average amount owned
(Cotton Incorporated Lifestyle Monitor, June 2009). The denim market encompasses many
different types, styles, prices, and brands of denim. Premium denim is a relatively new
concept, beginning within the last ten years, and paves the way for the denim market in terms
of fit, style, color and finish.
How do retailers attract customers to purchase premium denim? What type of
attributes can a retailer offer to the premium denim customers? Are certain stores more
frequented when purchasing premium denim? Do satisfied premium denim customers
become loyal customers? All of these questions were answered in this research study.
Purpose of Research
The purpose of this study is to determine the retail attributes influence on premium
denim customers in regards to store choice, how this influences satisfaction and if
satisfaction leads to repeat purchase behavior/customer loyalty. Drawing upon the marketing
2 attributes on purchasing behavior, the drivers of premium denim purchasing are identified
and evaluated.
Research Questions
RQ1: What retail attributes (brands offered, merchandising of product, ease of shopping,
customer services, retailer image, store credit card, sales associates, overall store
environment, and promotions/sales) are most important to premium denim
customers?
RQ2: How do the retail attributes influence store choice when shopping for premium
denim?
RQ3: How do the retail attributes and store choice influence customer satisfaction and
customer loyalty for premium denim customers?
Significance of Study
This study is significant because it offers an in-depth look at what retail
characteristics are important to premium denim customers and how this influences store
choice, customer satisfaction and loyalty. From this research, retailers who sell premium
denim products can learn what is most important to the premium denim shopper. In turn,
retailers should cater to customer needs in order to bring in new customers and at the same
3 CHAPTER II
LITERATURE REVIEW
This section of previous literature presents a summary on the current premium denim
market including inputs from the both the trade and academic literature. The literature also
presents conceptual work and findings related to the different retail attributes that influence
consumer behavior and store choice. Further the literature on the consumer behavior
concepts of customer satisfaction, and customer loyalty is considered.
Premium Denim
According to Cotton Incorporated’s Lifestyle Monitor (2009), 96 percent of
consumers own denim jeans, with seven pairs being the average number in each consumer’s
closet. Denim jeans have been a part of the apparel industry since 1886, beginning with Levi
Strauss. However, the trend of “premium denim” jeans is considered a fresh concept, making
an impact in the past ten years (Bell, 2003). Premium denim accounted for two percent of
denim jeans at retail in 2009 (Cotton Incorporated Lifestyle Monitor, 2009); even though this
is a small percentage, premium denim sets the trend for other denim to follow in terms of
style, fit, and finish.
The term “premium denim” is defined as $100.00+ denim jeans sold at retail (Bell,
4 include: Seven for all Mankind, Citizens of Humanity, Hudson, J Brand, Paige Premium
Denim, Rock & Republic, AG Adriano Goldschmied, Guess, Diesel, Earnest Sewn, and
James Jeans. Many retailers have a private label line of premium denim to offer their
customers; including Bloomingdales and Macys.
Cotton Incorporated’s Lifestyle Monitor (2009) reported 11 percent of U.S.
consumers buying premium denim in 2009. Buyers of premium denim are typically but not
restricted to the younger and affluent; 62 percent being age thirteen to thirty-four with annual
incomes of $75,000 or more (Cotton Incorporated Lifestyle Monitor, 2009). Marshal Cohen
of The NPD Group stated, “It’s become very evident that denim is clearly recession proof.
The reason for that is denim has been perceived as the one key category they can’t live
without. That quest for the perfect pair continues to thrive (Tucker, 2008).” Denim has been a
part of the consumer’s closet essentials for years and is considered a key piece to the
consumer’s wardrobe. In the past few years, premium denim made more of a splash with new
weights, colors, and fabrics which enables denim to sell all seasons of the year. More
consumers are wearing premium denim to work and for recreational purposes because of the
endless styles, washes, and fits in denim, making it ideal for any occasion.
For the twelve months ending in March 2009, sales of denim jeans increased two and
a half percent from 2008 (Tucker, 2008). Additionally, the NPD Group reported sales of
premium denim being up 16 percent from 2007 to 2008. In 2008, Guess showed a 26 percent
5 premium denim. Eric Beder, a retail analyst of Brean Murray, Carret & Co, stated, “We
believe Guess is positioned, with more premium denim (at $158) than ever before, to be a
major beneficiary of this trend. In the current environment, we believe the consumer wants
items that are comfortable, add value, and provide a sense of fun. Premium denim is a winner
on all counts, in our view (Tucker, 2003).” The increase of premium denim despite the
economic downturn over the past few years could be attributed to the consumers themselves
who purchase these products.
Cotton Incorporated (2009) compared premium denim buyers to non-premium denim
buyers and noted differences in views on the current economic situation. Sixty-four percent
of premium denim buyers reported “very or somewhat optimistic” about the economy, and
49 percent of non-premium denim buyers reported “very or somewhat optimistic” about the
economy. Eighty percent of premium denim buyers were “optimistic about their own
personal finances,” while 50 percent of non-premium denim buyers were “optimistic about
their own personal finances.” In addition, 53 percent of premium denim buyers purchase
jeans every six months or more often, compared to the 40 percent of non-premium denim
buyers (Cotton Incorporated Lifestyle Monitor, 2009), indicating higher purchasing
frequency for premium denim. These results showed the difference in premium denim buyers
and non-premium denim buyers and how the economy is not having a substantial affect on
6 Premium denim has different qualities that make it “premium” in the consumer’s
mind, which influences purchase decisions. Based off previous literature, fit, quality, and
brand are most important to customers purchasing premium denim. Fit is one of the key
selling points in premium denim. Since premium denim has a reputation of superior fit,
purchasers expect first-rate fit. Consumers are loyal to premium denim because of the
consistent fit; premium denim brands do not face serious competition from other denim
categories (such as moderate and budget denim jeans) because of this fit loyalty (Tucker,
2008). In a 2008 study about prestige seeking consumers in premium denim, consumers
showed the top three evaluative criteria to be fit, quality, and style (Bell, 2003). Customers
need to be informed of the different fits offered by a designer without having to try on each
pair of jeans. Levi Strauss, Guess, Diesel, AG Adriano Goldschmied have large wall displays
that serve as an attention grabber but most importantly, to enlighten customers on the
different fits offered in store (Lipke & Pallay, 2006).
The key factor in apparel purchases is generally price, however, denim does not fall
into that category. According to Cotton Incorporated’s Lifestyle Monitor (2009), when
consumers were asked the most important feature in denim purchases, fit was ranked as the
top response at 50 percent, followed by style at 19 percent, and price at 16 percent, which
7 Retail Attributes
In addition to the product, characteristics of retailers are significant to understanding
consumer behavior. Consumers can be more likely to buy premium denim at one store over
another based off retail attributes.
Visual merchandisers choose to display merchandise in a retail environment in
numerous ways to warrant customer response. Denim is versatile to merchandise because it is
not required to be on a mannequin or folded a certain way; this allows merchandisers to be
creative and appeal to target customers. Denim can be displayed in a “denim bar.” A denim
bar’s function is to group denim in one primary location, generally showcased on shelves and
tables for easier searching of styles and sizes. Denim bars are popular among retailers,
including Abercrombie & Fitch and True Religion. However, some brands, such as Diesel,
do not use a denim bar for the purpose of showcasing denim in a separate room (Lipke &
Pallay, 2006). Earnest Sewn moved their denim to a special room, but uses a denim bar in the
room making customers walk through the store to see all other merchandise before getting to
denim (Lipke & Pallay, 2006). Using mannequins to show the different ways of styling
denim is another way to merchandise premium denim. Bloomingdales uses mannequins to
show the denim lifestyle with their San Francisco location, using one hundred mannequins in
the men’s department alone (Lipke & Pallay, 2006). Additionally, retailers find new ways to
deliver special services to premium denim customers. AG Adriano Goldschmied has a tailor
8 a coffee bar for complimentary coffee drinks while shopping (Lipke & Pallay, 2006).
Bakewell (2003) conducted research on Generation Y shopper preferences in store
atmosphere, design, and staff selection. Generation Y is important for the premium denim
market because 62 percent of premium denim buyers in 2009 were age thirteen to thirty-four
(Cotton Incorporated Lifestlye Monitor, 2009). Bakewell (2003) found Generation Y
shoppers view shopping as a form of recreation and enjoyment and suggested retailers put
resources into store atmospherics and design, sales associates, and incorporate fun into the
selection process of shopping.
Paulins (2003) researched consumer perceptions of store attributes and how those
attributes influence store preference. The four variables found to affect store preference: if
the type of clothing desired was in stock, outside store appearance, shopping hours, and
advertising (Paulins, 2003). Whether or not a store has the clothing a customer likes
influenced store preference most significantly (Paulins, 2003). This suggests merchandise is
the key reason why a customer chooses one store over another.
Denim has many features, including wash, fabric, finish, fit, and color. This requires
extensive consideration on the consumer’s part for which pair is the right one. Therefore,
some consumers seek the assistance of sales associates for premium denim while others
prefer to shop on their own. Diesel prides itself in their sales force. Each season, denim
specialists at Diesel are trained with DVDs and tested on the new lines offered that season
9 the fact that we don’t make it too simple. Buying jeans can be a complicated process, because
our jeans aren’t just a commodity.” Neither Replay nor Diesel have mirrors in the fitting
rooms, which make customers come out to speak to sales associates (Lipke & Pallay, 2006).
In addition, retailers cater to the premium denim buyers who prefer the get-in and get-out
approach. Michael Macho, fashion director of Saks Fifth Avenue, said, “Denim serves as the
nucleus of our contemporary area. We try to have as much product out as possible and make
it really easy for men to shop for themselves. Not every guy wants to deal with a salesperson.
People here are interested in instant gratification, easy in and easy out (Lipke & Pallay,
2006).”
Customer Satisfaction and Loyalty
Satisfaction is the first stage in customer response to the product, with customer
loyalty following satisfaction (Torres-Moraga, 2008). Inexperienced customers look at the
product benefits whereas experienced customers tend to go directly to brands. As the
customer becomes more experienced with those products, he or she may focus on certain
brands (Torres-Moraga, 2008).
Research has been done on utilitarian and hedonic shopping benefits that result in
customer satisfaction and loyalty (Carpenter, 2005). Utilitarian shopping benefits are defined
10 need. Hedonic shopping benefits are defined as the enjoyment customers receive from the
shopping experience. Carpenter (2005) found that both utilitarian and hedonic shopping
benefits have a positive effect on customer satisfaction. Retailers should provide utilitarian
benefits to customers by having the right product at the right price at the right time
(Carpenter, 2005). For hedonic benefits, retailers should provide entertainment, excitement,
and fun in the shopping experience (Carpenter, 2005).
Apparel store retailers can benefit from the disconfirmation theory: customer
satisfaction is a result of how well expectations fit with actual experiences (Paulins, 2003).
Customers who consider the shopping experience successful, mainly with the merchandise
and retail attributes, continue to show store preference for the retailers who meet or exceed
expectations (Paulins, 2003).
Additionally, micromarketing influences customer satisfaction and loyalty.
Micromarketing merchandising is defined as, “buying of customized products using
marketing mix elements at the store level, instead of buying the same products for every store
in the chain (Halepete, 2005).” Customers change constantly and retailers need strategies to
cater to changing customer needs. Halepete (2005) found micromarketing merchandising and
customer loyalty to be directly related. The data indicate retailers achieve customer loyalty
by providing quality products, designs, at the right price, with products that are appropriate
for the retailer’s local customer (Halepete, 2005). Great service and customer loyalty
11 Another study was done on retail satisfaction being a key factor of salesperson and
store loyalty (Reynolds, 2000). Retail satisfaction is defined by Reynolds (2000) as, “a
customer’s emotional reaction to the evaluation of his/her experience with the retailer and the
salesperson.” Reynolds (2000) research found evidence to support the hypothesis: in an
upscale retail setting, building customer-salesperson relationships result in real value to the
retail firm. Loyalty to a salesperson is transferred to loyalty to the retail store, positive word
of mouth, and resistance to competitive pressure (Reynolds, 2000).
Wakefield and Blodgett (1999) found that intangible assets of service quality (i.e.,
reliability, empathy, assurance, responsiveness) had a direct influence on cognitive
evaluations, while tangible assets (building design, décor, ambience) had a direct influence
on affective responses (excitement). Both cognitive and affective responses affect customer
repatronage intentions. Additionally, Hart et al (2007) measured atmosphere, excitement,
environment, accessibility, and service personnel and the influence on the shopping
experience and ultimately repatronage intentions.
This review of literature provides a foundation for research on how retail
characteristics influence consumer purchasing behavior in the premium denim market. The
following retailer attributes were identified as important from the literature: brands offered,
12 credit cards, sales and promotions, sales associates, and overall store environment (Table 1).
This research will study how the retailer attributes influence store choice, customer
satisfaction, and customer loyalty for premium denim consumers.
CHAPTER 3
RESEARCH METHODOLOGY
Research Design
The purpose of this study was to determine the impact of retail attributes on premium
denim customers in regards to store choice, how it influenced customer satisfaction and if
satisfaction led to repeat purchase behavior/customer loyalty. A quantitative research design
was used to examine retail attributes effect on store choice, satisfaction and loyalty for
premium denim shoppers. Surveys were distributed to shoppers in the retail environment to
collect data for the study. Respondents were administered surveys in the store to complete
while shopping or upon purchase. The methodology design was created to target premium
13 Population and Sample
A convenience sample of premium denim shoppers, captured using a store intercept
technique, was used for the study. The sample consisted of 101 female respondents and was
collected in an upscale department store in Raleigh, North Carolina. The average age of
respondents was approximately thirty years, ranging from age eighteen to age fifty-five.
Data Collection
The data collection process transpired over a two month period beginning in
December 2010 and ending in January 2011. The survey was administered on days agreed
upon by the store marketing director to be the highest traffic days occurring during a week to
ensure adequate response. Additionally, the survey was distributed at different times during
the day to receive a variety of respondent demographics. The survey was designed to
generate quick response from premium denim shoppers and took five minutes to complete.
Participation in the survey was voluntary; however, those who participated were offered a
choice of incentives. The department store offered each respondent a choice of coupons to a
14 Questionnaire
The questionnaire was designed to obtain different types of information from the
premium denim shopper. First, several screening questions asked the shopper the amount of
premium denim purchases made in the past year, the amount of premium denim jeans owned,
amount of all jeans owned, the probability of shopping for premium denim in the next six
months and their favorite brands of premium denim owned.
Second, retail attribute questions were asked using a five point scale ranging from not
at all important to extremely important. The attributes included importance of retailer
offering wide variety of brands, favorite brands, merchandise and styling of the product, easy
shopping environment, overall store environment, store image, sales associates, customer
services, store credit cards, and promotions. The scale was developed specifically for this
15 Table 1
Retail Attributes and the Corresponding Sources
Retail Attributes Source
Brands Paulins (2003)
Gehrt (2004)
Deeter-Schmelz (2000)
Merchandising Paulins (2003)
Shopping Environment-Ease and Convenience Deeter-Schmelz (2000) Andreu (2006)
Gehrt (2004)
Customer Services Deeter-Schmelz (2000)
Store Credit Card Saks Fifth Avenue
Sales Associates Reynolds (2000)
Paulins (2003) Gehrt (2004)
Overall Store Environment Paulins (2003)
Andreu (2006) Gehrt (2004)
Deeter-Schmelz (2000)
Promotions Saks Fifth Avenue
Store Image/Prestige Saks Fifth Avenue
Third, store choice questions were asked on a five point scale ranging from never
shop to always shop. Respondents were asked to indicate amount of time shopping at
different retail types. The store choices were upscale department stores, traditional
department stores, boutiques, discount and outlet stores, online department stores, and online
16 The questions in the fourth section were designed to measure the premium denim
customer’s satisfaction and loyalty on a five point agreement scale ranging from strongly
disagree to strongly agree. Statements included satisfaction, happiness and enjoyment of the
premium denim product. Additionally, respondents were asked to agree with statements
about shopping at same stores, loyalty of shopping at same stores, shopping at different types
of stores, and repeat customer intentions when purchasing premium denim. The satisfaction
and loyalty scales were adapted from Carpenter (2005). The last section gathered
demographic information of the respondents and consisted of age, gender and ethnicity.
Analysis
In order to examine the impact of retail attributes on store choice, customer
satisfaction, and customer loyalty for the premium denim shopper, the study used a path
model approach. Path models provide a statistical technique that allows for simultaneous
testing of multiple relationships.
Preliminary Analysis
Prior to fitting the path model, Principal Components Analysis (PCA) was used to
evaluate the dimensionality of the retail attributes, store choices, and satisfaction and loyalty.
Eigenvalues greater than 1.0 and screeplots were evaluated to identify dimensions. Rotated
17 was evaluated using critical ratios associated with skewness and kurtosis. In addition,
Mahalanobis d-squared were used to identify outliers.
Path Analysis
Using AMOS software, path models examined all potential relationships between the
independent and dependent variables. Criteria used to evaluate model fit included: x²/df ratio,
Goodness of Fit Index (GFI), Adjusted Goodness of Fit Index (AGFI), Comparative Fit
Index (CFI), and Root Mean Square Error of Approximation (RMSEA). The modeling
process began with a saturated model, testing all potential relationships and culminated with
18 CHAPTER 4
RESULTS
Prior to fitting the path models to examine the impact of retailer attributes on store
choice, customer satisfaction and loyalty, sample characteristics and shopping behaviors for
premium denim shoppers were evaluated. In addition, measures assessed scale
dimensionality and structure using Principal Components Analysis (PCA) and Rotated Factor
matrices. Resulting factors were evaluated for reliability using Chronbach’s coefficient alpha
according to Nunally and Bernstein’s (1994) criterion of acceptable values greater than 0.70.
Multivariate normality was examined because of its importance to path modeling.
Sample Characteristics
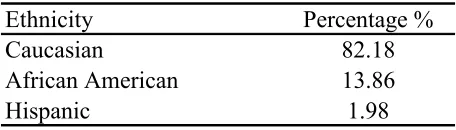
The sample had 101 female respondents (Table 2). Approximately, 82 percent of the
sample were Caucasian, 14 percent were African American and 2 percent were Hispanic
(Table 3). The mean age was 29.92 years, with a minimum age of 18 years and maximum
19 Table 2
Gender of Questionnaire Respondents
Gender Percentage %
Female 100
Male 0
Table 3
Ethnicity of Questionnaire Respondents
Ethnicity Percentage %
Caucasian 82.18
African American 13.86
Hispanic 1.98
Table 4
Age in Years of Questionnaire Respondents
Mean Standard
Deviation Minimum Maximum
20 Shopping Behaviors
Next, the respondents gave information on shopping behaviors for premium denim.
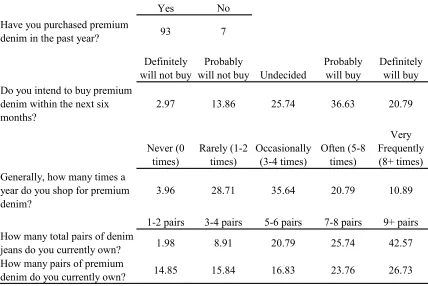
Ninety-three percent had purchased premium denim in the past year. When asked intentions
to buy premium denim in the next six months, five choices were offered: “definitely will not
buy,” “probably will not buy,” “undecided,” “probably will buy,” and “definitely will buy.”
A majority of respondents intended to buy premium denim: 36.63 percent answered
“probably will buy” and 20.79 percent answered “definitely will buy.” Respondents indicated
how many times a yearthey shopped for premium denim with these responses: “never” (zero
times), “rarely” (1-2 times), “occasionally” (3-4 times), “often” (5-8 times), and “very
frequently” (8+ times). Most respondents answered “occasionally,” 35.74 percent, or
“rarely,” 28.71 percent.
The next two questions answered how many denim jeans were owned, with one
question asking about all denim (budget, moderate, and premium) and one question asking
about premium denim. The choices were “1-2 pairs,” “3-4 pairs,” “5-6 pairs,” “7-8 pairs,”
and “9+ pairs” for both questions. Overwhelmingly, 43 percent of respondents answered “9+
pairs” and 25.74 percent answered “7-8 pairs,” when asked about pairs of all denim (budget,
moderate, and premium) owned. Twenty-seven percent of respondents answered “9+ pairs”
21 Table 5
Respondent Buying Behavior in Percentage
Yes No
Have you purchased premium
denim in the past year? 93 7 Definitely
will not buy
Probably
will not buy Undecided
Probably will buy
Definitely will buy Do you intend to buy premium
denim within the next six months?
2.97 13.86 25.74 36.63 20.79
Never (0 times) Rarely (1-2 times) Occasionally (3-4 times) Often (5-8 times) Very Frequently (8+ times) Generally, how many times a
year do you shop for premium denim?
3.96 28.71 35.64 20.79 10.89
1-2 pairs 3-4 pairs 5-6 pairs 7-8 pairs 9+ pairs How many total pairs of denim
jeans do you currently own? 1.98 8.91 20.79 25.74 42.57 How many pairs of premium
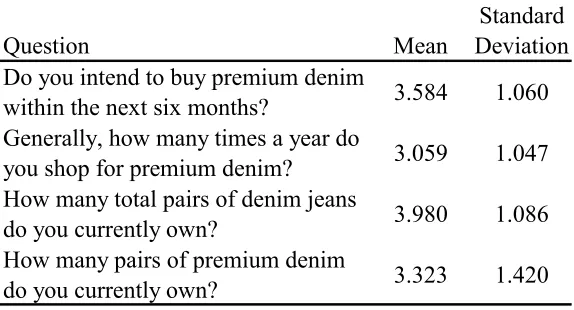
22 Table 6
Respondent Buying Behavior Means
Question Mean
Standard Deviation Do you intend to buy premium denim
within the next six months? 3.584 1.060
Generally, how many times a year do
you shop for premium denim? 3.059 1.047
How many total pairs of denim jeans
do you currently own? 3.980 1.086
How many pairs of premium denim
do you currently own? 3.323 1.420
Principal Components Analysis, Factor Analysis and Reliability
Principal Components Analysis (PCA) and rotated factor matrices using Varimax
were used to evaluate retail attributes, store choice, and satisfaction and loyalty. Dimensions
were determined by means of Eigenvalues greater than one and factors were identified
through the rotated matrices. The retail attributes factors (Table 7) included: Service (RA7,
RA8, RA9), Environmental (RA3, RA4, RA5) and Brands/Promotions (RA2, RA10). The
store choice factors included (Table 9): Upscale (SC1), Boutique (SC3), Online Department
and Boutique (SC5, SC6) and Traditional Department and Discount/Outlet (SC2, SC4). The
satisfaction and loyalty factors included (Table 11): Satisfaction (SL1, SL2, SL3, SL6, SL9)
23 Scale reliability was evaluated using Cronbach’s coefficient alpha for factors with
three items or greater and Pearson’s correlations for factors with two items. All multiple item
scales indicated acceptable alpha levels for internal consistency: Service (α = 0.772),
Environmental (α = 0.729), Satisfaction (α = 0.869) and Loyalty (α = 0.909). Pearson’s
correlation was performed to evaluate the internal consistency of the two items for
Brands/Promotions (ρ 0.247, p< 0.013) and the two items for Online Boutique and
Department (ρ 0.509, p < 0.000) which indicated significant correlations in both cases.
Multiple item scales were deemed reliable and the analysis proceeded with the path modeling
procedure.
Retail Attributes
The Principal Components Analysis for Retail Attributes indicated three dimensions
among the sample data explaining a cumulative 69.94 percent of the variance (Table 13). The
scale was next examined to identify factors using an Orthogonal Varimax rotation. Factor
scores were evaluated for cross loadings. Two items were eliminated from the original scale
in result of excessive cross loading: Retailer offers a wide variety of premium denim brands
(RA1) and Retailer evokes a store image that is preferable to me (RA6). The final factor
solution yielded three factors: Service (RA7, RA8, RA9), Environmental (RA3, RA4, RA5)
and Brands/Promotions (RA2, RA10). These factors were retained for examination in the
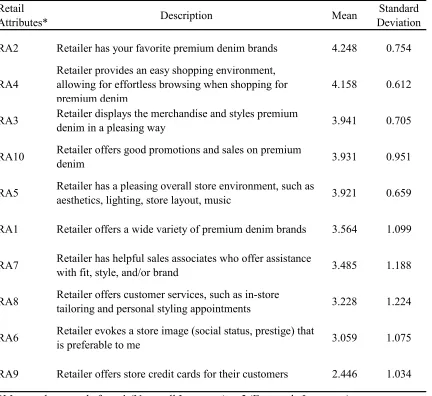
24 Table 7
Retail Attribute Means and Standard Deviation
Retail
Attributes* Description Mean
Standard Deviation RA2 Retailer has your favorite premium denim brands 4.248 0.754
RA4
Retailer provides an easy shopping environment, allowing for effortless browsing when shopping for premium denim
4.158 0.612
RA3 Retailer displays the merchandise and styles premium denim in a pleasing way 3.941 0.705
RA10 Retailer offers good promotions and sales on premium
denim 3.931 0.951
RA5 Retailer has a pleasing overall store environment, such as
aesthetics, lighting, store layout, music 3.921 0.659
RA1 Retailer offers a wide variety of premium denim brands 3.564 1.099
RA7 Retailer has helpful sales associates who offer assistance
with fit, style, and/or brand 3.485 1.188
RA8 Retailer offers customer services, such as in-store
tailoring and personal styling appointments 3.228 1.224
RA6 Retailer evokes a store image (social status, prestige) that is preferable to me 3.059 1.075
25 Table 8
Retail Attribute Factor Means and Standard Deviations
Factors Description Mean Standard
Deviation
Brands/Promotions RA2, RA10 4.089 0.676
Environmental RA3, RA4, RA5 4.007 0.531
Service RA7, RA8, RA9 3.053 0.954
Store Choice
The Principal Components Analysis for Store Choice indicated four dimensions
among the sample data explaining a cumulative 73.69 percent of the variance (Table 13). The
scale was next examined to identify factors using an Orthogonal Varimax rotation. Factor
scores were evaluated for cross loadings. The final factor solution yielded four factors:
Upscale (SC1), Boutique (SC3), Online Department and Boutique (SC5, SC6) and
Traditional Department and Discount/Outlet (SC2, SC4). These factors were retained for
26 Table 9
Store Choice Means and Standard Deviations
Store Choice* Mean Standard
Deviation
Upscale department stores 3.366 1.111
Traditional department stores 2.485 1.064
Boutiques 2.832 1.200
Discount/outlet stores 1.960 0.927
Online department stores 1.970 1.034
Online boutique stores 1.604 0.775
*Measured on a scale from 1 (Never Shop) to 5 (Always Shop)
Table 10
Store Choice Factor Means and Standard Deviations
Factors Description Mean Standard
Deviation
Upscale Department Store SC1 3.366 1.111
Boutique SC3 2.832 1.200
Traditional Department, Discount/Outlet SC2, SC4 2.223 0.838
27 Satisfaction and Loyalty
The Principal Components Analysis for Store Choice indicated two dimensions
among the sample data explaining a cumulative 74.16 percent of the variance (Table 13). The
scale was next examined to identify factors using an Orthogonal Varimax rotation. Factor
scores were evaluated for cross loadings. The final factor solution yielded two factors:
Satisfaction (SL1, SL2, SL3, SL6, SL9) and Loyalty (SL4, SL5, SL7, SL8). These factors
were retained for examination in the path model.
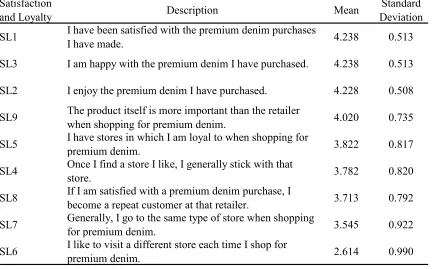
Table 11
Satisfaction and Loyalty Means and Standard Deviations
Satisfaction
and Loyalty Description Mean
Standard Deviation SL1 I have been satisfied with the premium denim purchases
I have made. 4.238 0.513
SL3 I am happy with the premium denim I have purchased. 4.238 0.513 SL2 I enjoy the premium denim I have purchased. 4.228 0.508 SL9 The product itself is more important than the retailer
when shopping for premium denim. 4.020 0.735 SL5 I have stores in which I am loyal to when shopping for
premium denim. 3.822 0.817
SL4 Once I find a store I like, I generally stick with that
store. 3.782 0.820
SL8 If I am satisfied with a premium denim purchase, I
become a repeat customer at that retailer. 3.713 0.792 SL7 Generally, I go to the same type of store when shopping
for premium denim. 3.545 0.922
SL6 I like to visit a different store each time I shop for
28 Table 12
Satisfaction and Loyalty Factor Means and Standard Deviations
Factors Description Mean Standard
Deviation
Satisfaction SL1, SL2, SL3, SL6, SL9 3.867 0.399
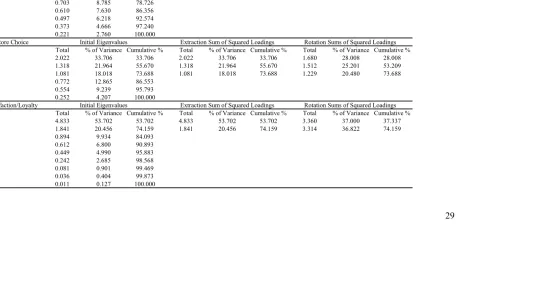
29 Table 13
Retail Attributes, Store Choice, and Satisfaction/Loyalty Eigenvalues of Principal Components Analysis
Retail Attributes
Total % of Variance Cumulative % Total % of Variance Cumulative % Total % of Variance Cumulative %
1 2.830 35.378 35.378 2.830 35.378 35.378 2.137 26.716 26.716
2 1.628 20.354 55.732 1.628 20.354 55.732 1.944 24.304 51.019
3 1.137 14.209 69.941 1.137 14.209 69.941 1.514 18.021 69.941
4 0.703 8.785 78.726
5 0.610 7.630 86.356
6 0.497 6.218 92.574
7 0.373 4.666 97.240
8 0.221 2.760 100.000
Store Choice
Total % of Variance Cumulative % Total % of Variance Cumulative % Total % of Variance Cumulative %
1 2.022 33.706 33.706 2.022 33.706 33.706 1.680 28.008 28.008
2 1.318 21.964 55.670 1.318 21.964 55.670 1.512 25.201 53.209
3 1.081 18.018 73.688 1.081 18.018 73.688 1.229 20.480 73.688
4 0.772 12.865 86.553
5 0.554 9.239 95.793
6 0.252 4.207 100.000
Satisfaction/Loyalty
Total % of Variance Cumulative % Total % of Variance Cumulative % Total % of Variance Cumulative %
1 4.833 53.702 53.702 4.833 53.702 53.702 3.360 37.000 37.337
2 1.841 20.456 74.159 1.841 20.456 74.159 3.314 36.822 74.159
3 0.894 9.934 84.093
4 0.612 6.800 90.893
5 0.449 4.990 95.883
6 0.242 2.685 98.568
7 0.081 0.901 99.469
8 0.036 0.404 99.873
9 0.011 0.127 100.000
Initial Eigenvalues Extraction Sum of Squared Loadings Rotation Sums of Squared Loadings Initial Eigenvalues Extraction Sum of Squared Loadings Rotation Sums of Squared Loadings
30 Normality
Multivariate normality was evaluated using critical ratios associated with skewness
and kurtosis. In addition, Mahalanobis d-squared were used to identify outliers. No evidence
against multivariate normality was detected. Further, Mahalanobis d-squared did not indicate
the presence of outliers, therefore, multivariate normality was assumed and the analysis
proceeded with the path modeling procedure.
Path Analysis
Using AMOS software, path models examined all potential relationships. Criteria to
evaluate model fit included: χ²/df ratio, Goodness of Fit Index (GFI), Adjusted Goodness of
Fit Index (AGFI), Comparative Fit Index (CFI), and Root Mean Square Error of
Approximation (RMSEA). The modeling process began with a saturated model, testing all
potential relationships and culminated with a best-fitting model that returned all significant
paths.
The initial saturated model indicated mixed fit indices χ²/df=3.140, p<.004, Goodness
of Fit Index=0.965, Comparative Fit Index= 0.868, Root Mean Square Error of
Approximation=0.146 (Table 14). After evaluating initial model fit, twenty non-significant
paths were identified (Table 15). At this stage the following twenty paths were eliminated
31 Service -> Traditional Department and Discount Outlet
Estimate, -0.004, Critical Ratio, -0.048, p, 0.961
Service -> Online Department and Boutique
Estimate, -0.006, Critical Ratio, -0.070, p, 0.944
Service -> Satisfaction
Estimate, -0.022, Critical Ratio, -0.421, p, 0.674
Service -> Loyalty
Estimate, -0.106, Critical Ratio, -1.505, p, 0.132
Environmental -> Traditional Department and Discount Outlet Estimate, -1.7, Critical Ratio, -1.014, p, 0.311
Environmental -> Online Department and Boutique Estimate, 0.211, Critical Ratio, 1.380, p, 0.168
Environmental -> Boutique
Estimate, 0.285, Critical Ratio, -1.205, p, 0.228
Environmental -> Upscale Department
Estimate, 0.261, Critical Ratio, 1.306, p, 0.191
Environmental -> Satisfaction
Estimate, 0.184, Critical Ratio, 2.106, p, 0.044
Environmental -> Loyalty
Estimate, 0.069, Critical Ratio, 0.539, p, 0.590
Brands/Promotions -> Traditional Department and Discount Outlet Estimate, 0.222, Critical Ratio, 1.725, p, 0.084
Brands/Promotions -> Boutique
Estimate, 0.188, Critical Ratio, 1.039, p, 0.299
Brands/Promotions -> Satisfaction
Estimate, 0.014, Critical Ratio, 0.201, p, 0.841
Brands/Promotions -> Loyalty
32 Traditional Department and Discount Outlet -> Satisfaction
Estimate, -0.068, Critical Ratio, -1.290, p, 0.197
Traditional Department and Discount Outlet -> Loyalty Estimate, -0.169, Critical Ratio, -2.305, p, 0.021
Online Department and Boutique -> Satisfaction Estimate, 0.025, Critical Ratio, 0.425, p. 0.671
Online Department and Boutique -> Loyalty
Estimate, -0.027, Critical Ratio, -0.340, p, 0.734
Boutique -> Satisfaction
Estimate, -0.017, Critical Ratio, -0.443, p, 0.658
Boutique -> Loyalty
33 The modeling process continued iteratively until the best-fitting model was achieved
(fit indices). Based upon the fit indices, the final model indicated χ²/df=1.441, p<0.101,
Goodness of Fit Index=0.941, Comparative Fit Index= 0.916, Root Mean Square Error of
Approximation=0.066 (Table 14). The model indicated eight significant paths (Table 16)
between the focal factors (Figure 1):
Service -> Upscale Department
Estimate, 0.445, Critical Ratio, 4.226, p<0.001
Service -> Boutique
Estimate, 0.233, Critical Ratio, 1.886, p, 0.059
Environmental -> Satisfaction
Estimate, 0.267, Critical Ratio, 2.961, p, 0.003
Brands/Promotions -> Online Department and Boutique Estimate, 0.321, Critical Ratio, 2.862, p, 0.004
Brands/Promotions -> Upscale Department
Estimate, 0.310, Critical Ratio, 2.082, p, 0.037
Upscale Department -> Loyalty
Estimate, 0.202, Critical Ratio, 3.568, p<0.001
Satisfaction -> Loyalty
Estimate, 0.520, Critical Ratio, 4.024, p<0.001
Upscale Department -> Satisfaction
34 Squared Multiple Correlations (SMC) for the endogenous (dependent) variables
indicate that the predictors best explain variance in Store Loyalty (Estimate=0.233) and the
Upscale Department Store Patronage Choice (Estimate=0.207). The SMC estimates for the
remaining endogenous constructs explain indicate relatively less explained variance:
Satisfaction (Estimate=0.084), Online Department/Boutique (Estimate=0.076) and Boutique
(Estimate=0.034).
Table 14
Model Fit Criteria for Saturated Path and Final Path
Model χ² df χ²/df P GFI CFI RMSEA
RMSEA Confidence
Interval Saturated
35 Table 15
Regression Weights, Covariances and Variances for Saturated Path Model
Regression Weights Estimate SE CR P
Service -> Traditional Dept & Discount Outlet -0.004 0.091 -0.048 0.961 Service -> Online Dept & Boutique -0.006 0.083 -0.070 0.944
Service -> Boutique 0.164 0.128 1.289 0.197
Service -> Upscale Dept 0.410 0.108 3.803 *** Service -> Satisfaction -0.022 0.052 -0.421 0.674 Service -> Loyalty -0.106 0.071 -1.505 0.132 Environmental -> Traditional Dept & Discount Outlet -0.170 0.168 -1.014 0.311 Environmental -> Online Dept & Boutique 0.211 0.153 1.380 0.168 Environmental -> Boutique 0.285 0.236 1.205 0.228 Environmental -> Upscale Dept 0.261 0.200 1.306 0.191 Environmental -> Satisfaction 0.184 0.091 2.106 0.044 Environmental -> Loyalty 0.069 0.129 0.539 0.590 Brands/Promotions ->Traditional Dept & Discount Outlet 0.222 0.128 1.725 0.084 Brands/Promotions -> Online Dept & Boutique 0.273 0.117 2.330 0.020 Brands/Promotions -> Boutique 0.188 0.181 1.039 0.299 Brands/Promotions -> Upscale Dept 0.257 0.153 1.679 0.093 Brands/Promotions -> Satisfaction 0.014 0.072 0.201 0.841 Brands/Promotions -> Loyalty 0.037 0.099 0.369 0.712 Traditional Dept & Discount Outlet -> Satisfaction -0.068 0.053 -1.290 0.197 Traditional Dept & Discount Outlet -> Loyalty -0.169 0.073 -2.305 0.021 Online Dept & Boutique -> Satisfaction 0.025 0.058 0.425 0.671 Online Dept & Boutique -> Loyalty -0.027 0.080 -0.340 0.734 Boutique -> Satisfaction -0.017 0.038 -0.443 0.658
Boutique -> Loyalty 0.063 0.052 1.220 0.222
Upscale Dept -> Satisfaction 0.145 0.044 3.254 0.001 Upscale Dept -> Loyalty 0.206 0.064 3.194 0.001 Satisfaction -> Loyalty 0.468 0.138 3.395 ***
Covariances Estimate SE CR P
Service <--> Environmental 0.144 0.052 2.754 0.006 Environmental <-> Brands/Promotions 0.107 0.037 2.874 0.004 Service <--> Brands/Promotions 0.112 0.065 1.734 0.083
Variances Estimate SE CR P
Service 0.902 0.127 7.071 ***
Environmental 0.279 0.040 7.071 ***
Brands/Promotions 0.452 0.064 7.071 ***
E1 0.673 0.095 7.071 ***
E2 0.558 0.079 7.071 ***
E3 1.332 0.188 7.071 ***
E4 0.953 0.135 7.071 ***
E5 0.134 0.019 7.071 ***
E6 0.39 0.055 7.071 ***
36 Table 16
Regression Weights, Covariances, Variances, and Squared Multiple Correlations for Final Path Model
Regression Weights Estimate SE CR P
Service -> Upscale Dept 0.445 0.105 4.226 ***
Service -> Boutique 0.233 0.124 1.886 0.059
Environmental -> Satisfaction 0.267 0.088 3.046 0.002
Brands/Promotions -> Online Dept & Boutique 0.321 0.112 2.862 0.004
Brands/Promotions -> Upscale Dept 0.310 0.149 2.082 0.037
Upscale Dept -> Satisfaction 0.145 0.044 3.254 0.001
Upscale Dept -> Loyalty 0.202 0.057 3.568 ***
Satisfaction -> Loyalty 0.520 0.129 4.029 ***
Covariances Estimate SE CR P
Service <-> Environmental 0.144 0.052 2.754 0.006
Service <-> Brands/Promotions 0.112 0.065 1.734 0.083
Environmental <-> Brands/Promotions 0.107 0.037 2.874 0.004
Variances Estimate SE CR P
Service 0.902 0.127 7.071 ***
Environmental 0.279 0.040 7.071 ***
Brands/Promotions 0.452 0.064 7.071 ***
E2 0.569 0.080 7.071 ***
E3 1.378 0.195 7.071 ***
E4 0.969 0.137 7.071 ***
E5 0.139 0.020 7.071 ***
E6 0.446 0.063 7.071 ***
Squared Multiple Correlations Estimate
Upscale Dept 0.207
Online Dept & Boutique 0.076
Boutique 0.034
Satisfaction 0.085
Loyalty 0.233
37 Figure 1
Impact of Retail Attributes on Store Choice, Customer Satisfaction and Customer Loyalty for Premium Denim Service Environmental Brands/Promotions Online Department and Boutique Boutique Upscale Department Satisfaction Loyalty 0.233* 0.445*** 0.321** 0.310** 0.267** 0.202*** 0.520***
Note: *p<0.06, **p<0.01, ***p<0.001
0.145*** Service Environmental Brands/Promotions Online Department and Boutique Boutique Upscale Department Satisfaction Loyalty 0.233* 0.445*** 0.321** 0.310** 0.267** 0.202*** 0.520***
Note: *p<0.06, **p<0.01, ***p<0.001
38 CHAPTER 5
CONCLUSIONS, IMPLICATIONS, LIMITATIONS, FUTURE RESEARCH
Conclusions and Implications
The conclusions and implications are organized into two broad categories: the
statistical conclusions suggested by the path models, which consider the specific
relationships between variables, and the broader answers and managerial implications to the
three focal research questions: 1) what retail attributes (brands offered, merchandising of
product, ease of shopping, customer services, retailer image, store credit card, sales
associates, overall store environment, and promotions/sales) are most important to premium
denim customers?, 2) how do the retail attributes influence store choice when shopping for
premium denim?, 3) how do the retail attributes and store choice influence customer
satisfaction and customer loyalty for premium denim customers? Implications are suggested
based upon the findings of the study.
Statistical Conclusions
Predictors of Online/Department and Boutique Stores. The path model tested the
impact of three retail attribute factors (Table 8, i.e., Service, Environmental and
Brands/Promotions) on the premium denim patronage choice for Online Department Store
and Online Boutiques. The saturated path model indicated no significant relationships
39 factor emerged as a significant positive predictor for the Online Department Store and Online
Boutique choice (Figure 1, Beta=0.321, p <0.01).
Predictors of Boutique Stores. The path model tested the impact of three retail
attribute factors (Table 8, i.e., Service, Environmental and Brands/Promotions) on the
premium denim patronage choice for Boutiques. The saturated path model indicated no
significant relationships between the Environmental and Brands/Promotions factors (Table
16). The Service factor was a significant positive predictor for the Boutique store choice
(Figure 1, Beta=0.233, p<0.06).
Predictors of Upscale Department Store Choice. The path model showed the
influence of three retail attribute factors (Table 8, i.e., Service, Environmental and
Brands/Promotions) on the premium denim patronage choice for Upscale Department Stores.
The saturated path model did not show a significant relationship for the Environmental factor
(Table 16). However, both the Service factor and the Brands/Promotion factor emerged as
significant positive predictors for Upscale Department stores (Figure 1, Service, Beta=0.445,
p<0.001, Brands/Promotions, Beta=0.31, p<0.06).
Predictors of Satisfaction. Additionally, the path model showed the influence of three
attribute factors (Table 8, i.e., Service, Environmental and Brands/Promotions) and three
40 Department) on the Satisfaction factor (Table 12). The model showed no significant
relationships for the following factors: Service, Brands/Promotions, Boutique, and Upscale
Department Stores (Table 16). However, the Online Department/Boutique store factor and
Environmental factor emerged as positive predictors for Satisfaction (Figure 1, Online
Department/Boutique, Beta=0.022, p<0.717, Environmental, Beta=0.261, p<0.01).
Predictors of Loyalty. The path model tested the influence of the Satisfaction factor,
three attribute factors (Table 8, i.e., Service, Environmental and Brands/Promotions) and
three patronage factors (Table 10, i.e., Online Department and Boutique, and Upscale
Department) on the Loyalty factor (Table 12). The model did not indicate significant
relationships for the following factors: Service, Environmental, Brands/Promotions, Online
Department/Boutique, and Boutique (Table 16). However, the Upscale Department factor
and Satisfaction factor were both positive predictors on Loyalty (Figure 1, Upscale
41 Research Questions
Research Questions One and Two. Observation of means, factor means, and path
estimates are examined to address research questions one and two. Because the two questions
are intrinsically related, they are addressed simultaneously in this section. The first research
question is “what retail attributes (brands offered, merchandising of product, ease of
shopping, customer services, retailer image, store credit card, sales associated, overall store
environment and promotions/sales are most important to premium denim customers?” and
the second research question is “how do the retail attributes influence store choice when
shopping for premium denim?”
From observing the raw means associated with the individual retail attribute items
(Table 7), it appears “Retailer has your favorite premium denim brands” and “Retailer
provides an easy shopping environment, allowing for effortless browsing when shopping for
premium denim” are consistently rated by respondents as highly important. Likewise, when
investigating the factors, or aggregated attribute items (Table 8), it appears the most
important factors are Brands/Promotions (which includes “Retailer has your favorite
premium denim brands” and “Retailer offers good promotions and sales on premium denim”)
and Environmental factor (which included “Retailer displays the merchandise and styles
premium denim in a pleasing way,” “Retailer provides an easy shopping environment,
allowing for effortless browsing when shopping for premium denim,” and “Retailer has
42 Based upon evaluation of the path model estimates (Table 16, Figure 1), it appears
that the Brands/Promotions factor is most influential in driving store choice for Upscale
Department Stores and Online Department Stores and Boutiques. In both cases, path
estimates indicate significant estimates for the relationship between Brands/Promotions and
these two store choices. However, the Brands/Promotions factor does not appear to drive
store choice for Traditional Boutiques in the purchase of premium denim (Table 15 and
Table 16).
The service factor (which includes “Retailer has helpful sales associates who offer
assistance with fit, style, and/or brand,” “Retailer offers customer services, such as in-store
tailoring and personal styling appointments,” and “Retailer offers store credit cards for their
customers”) also indicates an influence on store choice for Boutiques and Upscale
Department Stores (Table 16, Figure 1). The influence of service positively impacts the
choice of Boutiques and Upscale Department stores. However, the impact of the service
factor on Upscale Department store choice for premium denim is strongly indicated by the
path estimate. Therefore, it appears that this is a particularly important factor in the decision
to choose the upscale format.
The path model did not indicate a relationship between the Environmental factor and
the three retail format choices (Figure 1). However, a direct significant path was indicated
between the Environmental factor and Satisfaction. The positive estimate associated with the
43 environment and pleasing overall store environment can drive satisfaction for the premium
denim consumer regardless of format choice (Table 16).
In conclusion, after examining the raw means for the attributes, along with the
aggregated factors and the more stringent path estimates (Table 7, Table 8 and Table 16) we
find that the Service factor and Brands/Promotions are most influential in format choice
overall (Figure 1). This relationship is particularly true for the upscale department store
choice on premium denim purchases. These two factors also indicate an influence on store
choices outside of the upscale environment including Boutiques and Online Department and
Boutiques.
The most variance in format choice was explained for the upscale department format,
based upon the squared multiple correlations in the study (Table 16). The drivers of this
choice are Service and Brands/Promotions. In addition, it appears that the upscale department
store choice leads to long term loyalty among the premium denim consumer, which is not
indicated by the other formats.
Based on the importance of retail attributes, store choice, and the path model, several
key implications materialize. The Service factor (which includes “Retailer has helpful sales
associates who offer assistance with fit, style, and/or brand,” “Retailer offers customer
services, such as in-store tailoring and personal styling appointments,” and “Retailer offers
44 “Retailer has your favorite premium denim brands” and “Retailer offers good promotions and
sales on premium denim”) are the most influential Retail Attribute factors.
The Upscale Department store format is influenced by both the Service factor and the
Brands/Promotions factor, with the Service factor being the more significant relationship.
Therefore, upscale retail formats should keep their premium denim customers and attract new
premium denim customers by catering to customer service, offering promotions, and keeping
premium denim brands for target customer. Tactics to increase service in an upscale retail
format include: sales associates who specialize in premium denim fittings, personal styling
appointments, in-store tailoring/hemming of premium denim bought in store, store credit
card promotions, and promotions/sales for frequent shoppers. The significance of Service and
Brands/Promotions for the upscale department store points out the importance of feeling
special and receiving one-on-one attention for the premium denim shopper.
Additionally, in regards to store choice, the path model indicated Online Department
Stores and Boutiques being influenced by the Brands/Promotions. The online retailers of
boutiques and department stores should cater to premium denim customers by keeping the
target customer’s favorite brands in-stock and offering promotions/sale events frequently.
Past research has been conducted on the attraction of shopping online because customers
associate online shopping with reduced prices and promotions/sales (Dholakia, 2002).
45 associated with customer service and one-on-one attention based off the intimate setting of a
smaller environment. Therefore, to maintain premium denim customers, boutique stores
should deliver services such as in-store tailoring, helpful sales associates and store credit
cards.
Research Question Three. Research question three is “how do the retail attributes and
store choice influence customer satisfaction and customer loyalty for the premium denim
customer?” Discussed in the previous section, the path model indicated a direct positive
relationship between the Environmental factor and the Satisfaction factor (Table 16). In
terms of relationships between the three retail format choices’ influence (Upscale
Department Stores, Online Department Stores/Boutiques and Boutiques) on satisfaction and
loyalty, two relationships emerged. The model suggests that the upscale department store
choice leads to customer satisfaction loyalty for the premium denim consumer (Figure 1).
Again, no relationships between the remaining two format factors (Online
Department/Boutique Stores and Boutiques) and satisfaction or loyalty are indicated. In
keeping with the past empirical research on customer satisfaction and loyalty (Reynolds,
2000 and Torres-Marga, 2008) the model indicated a positive significant path from
satisfaction to loyalty among the premium denim shopper (Table 16).
Therefore, because the Environmental factor (“Retailer provides an easy shopping
46 displays the merchandise and styles premium denim in a pleasing way,” and “Retailer has a
pleasing overall store environment, such as aesthetics, lighting, store layout and music”)
leads to customer satisfaction, it can be implicated to retailers the importance premium denim
customers place on shopping environment resulting in satisfaction. Retailers need to display
merchandise in a way catered to target premium denim customers and offer an easy shopping
environment to keep premium denim shopper satisfied, and thus returning to the store and
becoming loyal customers. Based off these findings and the foundation of past literature,
satisfied premium denim customers lead to loyal premium denim customers. The importance
of customer satisfaction for retailers comes across clear in this study.
Limitations and Future Research
The conceptual and empirical limitations of the study are presented along with
directions for future research. The purpose of this study was to determine the influence of
retail attributes on store choice, customer satisfaction and loyalty for premium denim
products.
The conceptual model drew on the retail patronage literature, which suggests a
number of attributes that influence store choice (Paulins, 2003; Gehrt & Yan, 2004;
47 for upscale department store format choice, retail attributes that influence store choice within
this contexts are the focus of this analysis. After completing the study, we believe that
additional attributes related to the consumer may be driving choice behavior within this
context. For example, our findings suggest that price consciousness, brand consciousness,
(Bell, 2008; Carpenter, 2005; Pappau, 2008) quality perception and additional consumer
perceptions likely influence choice behavior for premium denim. Because our focus was on
retail attributes (i.e., controllable variables for the retailers), consumer perceptions were not
included in our conceptual model. For future research into the choice for premium denim, a
suggested direction is to examine consumer perceptions using the price cue literature (Moore
& Fairhurst, 2003).
The empirical limitations associated with this study primarily emerged in the
sampling method and the measurements. Store-intercept method was used to insure capturing
of the upscale department store shopper. While this sampling method provided us with our
target respondent, we were not able to control for homogeneity among demographic or
psychographic variables. Therefore, we must assume that the target consumer of the single
upscale department store used to capture our data is systematically similar. This limitation is
common to intercept research and we made this choice knowing its limitations. For future
research and theoretical testing, it would be advantageous to sample actual consumers based
upon common attributes, such as income and education (Moore, Kennedy & Fairhurst, 2003).
48 and may not capture typical consumer behavior which varies by season. Therefore, additional
data collection could improve the reliability and value of our results.
The measurements used in this study were adapted from the literature (Paulins, 2003;
Gehrt & Yan, 2004; Deeter-Schmelz, 2000; Reynolds, 2000). Though they were useful in
capturing consumer perceptions of retail attributes, the scales are superficial in some cases.
For example our environmental factor only included merchandising of the product, easy
shopping environment and pleasing overall store environment (Table 8). During the
measurement evaluation process we eliminated a number of items due to lack of reliability,
cross loading and triviality (Table 15 and Table 16). Therefore, measurement development
related to retail attributes and store choice criteria is needed. In addition, using alternative
methods for measurement including qualitative interviews and/or secondary data analysis,