CSEIT1831371 | Received : 11 Feb 2018 | Accepted : 22 Feb 2018 | January-February-2018 [(3) 1 : 1443-1448]
International Journal of Scientific Research in Computer Science, Engineering and Information Technology © 2018 IJSRCSEIT | Volume 3 | Issue 1 | ISSN : 2456-3307
1443
Tele Comm. Customer Data Analysis using Multi-Layer
Clustering Model
Y. Gopi*1, Varikallu Sumalatha2
*1Assistent Professor, Department of MCA, St. Mary's Group of Institutions, Guntur, Andhra Pradesh, India
2PG Students, Department of MCA, St. Mary's Group of Institutions, Guntur, Andhra Pradesh, India
ABSTRACT
Customer segmentation provides an efficient way to get insights into customer characteristics and behavioral preferences. Two-layer clustering model for mobile telecommunication client analysis enhances customer relationship management and focuses on a dynamically dynamical marketplace. With the increase of huge data and also the evolution of data mining technology, the mass storage of internal enterprise data will be analyzed. Effectively for hidden customer worth. The promotion of promoting activities and client relationship support is supported an extensive precision-marketing model that evolved to focus on the client base and acquire in-depth understanding to suit that base’s desires. a progressively important issue is a way to integrate marketing resources and properly distribute and match individual client interests and preferences with the foremost effective marketing activities, additionally as mine knowledge to work out those products or services most attractive to customers. Data clustering and clustering algorithms allow us to cluster extremely consistent individuals and assign dissimilar people to the acceptable segments. Trade and world have several samples of clustering analysis getting used to ascertain cluster characteristics: customer grouping analysis could be a well-liked application. By analyzing client attributes, behaviors, and preferences, we will verify the high homogeneity of individual clusters, and also the high degree of unsimilarity among individuals, given the appropriate segments.
Keywords: Data Analysis, Mining Technology.2 –Layer Clustring Model, Tele Comm Customer.
I.
INTRODUCTION
By analyzing customer attributes, behaviors, and preferences, we can determine the high homogeneity of individual clusters, and the high degree of
dissimilarity among individuals, given the
appropriate segments. In addition to effectively controlling the homogeneity of characteristics among the mass customer base, this analysis can also be used for limited customers—for example, to develop management strategies and market-in principles to assist in customer relationship management (CRM).a two-layer clustering model based on the analysis of customer at-tributes, customer contributions, and cluster segmentation. We cluster the value of mobile
marketers can use this modeling approach to promote products or services accurately.
II.
RELATED WORK
Customer Clustering
We can divide clustering algorithms into the following general categories:
Hierarchical. The data points are merged or
split to form the target clusters.
Partitional. The number of clusters to be
formed is specified in advance, and the data points are assigned iteratively to the respective clusters.
Density-oriented. Clusters are formed by
concatenating the data space distribution density thresholds in line with the data points.
Grid-oriented. The data space is quantized into
a grid structure in accordance with grid-based units for clustering.
Model-based. Existing models (often statistical ones) are used to cluster data points individually.4
Cluster analysis is widely used for multivariate data analysis in fields such as medicine, economics, text mining, and commercial applications. There have been many studies on cluster analysis for separating data characteristics and detecting data-clustering phenomena. Business applications include targeted or direct marketing based on customer grouping and clustering, customization services, good CRM, and customer behavior, at-tributes, and preferences.
According to the 80/20 rule (or the Pareto principle),5 80 percent of a company’s profits come
from the most important 20 percent of its customers, with the remaining 20 percent of profits coming from the ordinary 80 percent of customers. If a company can fully comprehend its key 20 percent of customers, those customers can bring a substantial profit. The related research com-bines the concepts of customer lifetime value (CLV) and customer segmentation. In this study, customers form appropriate segments, which help the company focus
on its target customers and then develop CRM, marketing strategies, and promotional activities.
CLV refers to the total revenue that each customer can bring to the enterprise. It can be divided into the customer’s historical value, current value, and potential value. Academic research on customer grouping has been conducted based on CLV, and three different models have been put forward according to customer contribution, basic attributes (such as age and gender), and preferred customer behavior.6 The results show that customer groups
formed through multiple dimensions can
differentiate customer attributes effectively. Dividing the majority of customer groups into several special behavioral subgroups helps a company gain an
in-depth understanding of its customer base.7
However, most customers grouping to date has either been based on rules of thumb or has used only the average revenue per user (ARPU) as a benchmark for customer segmentation. Only a few approaches have included other factors, such as customer lifecycle or overall customer contri-bution.8,9 Vodafone, a British
telecom operator, segments mobile users into many
homogeneous clusters through customer
segmentation and customer profiling to identify common features. It uses the analysis and description of user attributes to help management with decision-making and operational guidelines.10
III. PROPOSE WORK
Two-Layer Clustering Model
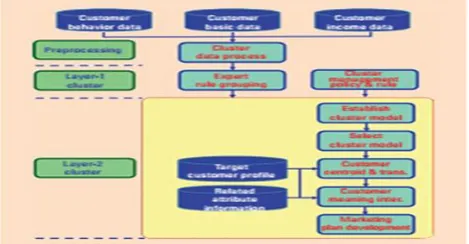
two-layer clustering model for customer segmentation.
Figure 1. shows a flow-chart of the two-layer clustering model.
Our approach begins by collecting and segmenting
individual customers’ contributions, personal
preferences, overall customer profile, and other factors. Customer segmentation for a huge number of customer’s uses on the order of 105–106 clusters.
These clusters are then used to develop a general strategy for CRM, which forms the first layer of clusters. After the first layer of the target has been clustered, the characteristics of the subgroups are described and interpreted by the subdivision of the second-layer clustering algorithm. The big data platform cross-analysis function maintains each group of customers and, along with effective marketing programs, forms the second layer of customer clustering analysis.
The aims of the proposed two-layer clustering model are as follows:
provide real-time, diverse, and rich customer
information through preplanned pre-analysis to strengthen the target customer base and re-duce the workload of marketing staff;
evaluate the customer segmentation strategy
for each group to improve the effectiveness of activity planning and the CRM strategy; and
Use data mining technology to tap potential
target customers, increase the feasibility of marketing products and services, and improve the accuracy of precision marketing.
In our proposed model, the first layer examines customer value, and the second layer uses consumer-behavior features for further grouping. In practice, the definition of customer value varies by industry. Even the same industry can have different priorities, such as the amount of consumption, the number of consumers, the number of stores, and so on. So, when implementing this model, each industry must first define the customer value of each variable. In addition, because customer behavior can change, to make the marketing strategy more accurate, we must dynamically monitor the changes in these acts and cooperate with automatic mechanisms for observing customer-behavior trends and pro-viding early warnings. We next describe our pro-posed two-layer clustering model in detail.
Layer-1 Clustering Architecture
The first-layer clustering architecture (the L1 cluster) uses the mean, and divides customers based on two 2D attributes (Figure 2): The horizontal axis divides the overall mobile customer base into the 0–99 range (that is, a total of 100 rankings) ac-cording to a customer’s contribution to the company’s revenue. The higher the value, the higher the customer’s contribution, and the higher the customer’s value to the company. The vertical axis is based on voice-leased monthly bills. The higher the voice-call monthly fee, the greater the customer’s reliance on the telecom’s mobile service, and the higher the demand for mobile calls. Finally, the behavior of special, data-oriented billed users (customers whose main need is for mobile Internet) becomes an independent group. In this study, we take the contribution and ARPU as the v customer’s grouping variables. As mentioned, in practical applications, the definition of customer value varies according to each industry. Even if the same industry may have different priorities, we can use the small-scale test to determine the first layer of the selected group variable.
strategy for CRM is developed for each group. For example, in accordance with the L1 cluster cutting, the overall strategy for maintaining the customer base should be driven by the performance of the S1 customer group as the main criterion.
Among the customer groups, S1 makes the highest contribution to the customer base. Focus should be committed to retaining this customer base and strengthening customer loyalty to stabilize the company’s revenue. Meanwhile, the S6 group makes a low contribution to the customer base. The focus here should be on enhancing customer value and strengthening customers’ dependence on mobile services to improve their contributions to the company’s revenue. Due to the special behavior of the S7 customer base, the company should strengthen the promotion of its value-added services to drive customer demand for voice services.
Layer-2 Clustering Architecture
The second-level grouping (the L2 cluster) is structured under the L1 cluster of expert rules. Sub-groups are subdivided for each L1 cluster, as Figure 2 shows. First, we aggregate for each L1 cluster by calculating customers’ communication behavior to distinguish between their preferences and their business habits. The cluster variables used by the L2 cluster subdivision can vary depending on the L1 clusters the customer belongs to.
Let’s look at mobile-customer segmentation as an example—that is, postpaid customers in groups S1–S6. To find out the main sources of communication behavior and customer contribution, the inter- and intra-network traffic minutes, the number of called objects, the ratio of each sub item to the total bill, and other variables are added.
In contrast, because the S7 group consists of customers whose main need is for mobile Inter-net (that is, a data-oriented type), the call behavior and use of other mobile value-added services among this group are significantly different from those of
general, monthly postpaid customers. Variables assigned to the L2 cluster thus focus on the use of mobile data. For example, the proportion of downloads, the data transmission growth rate, and the time proportion of data transmission can be used to outline customers’ online-behavior variables rather than voice-behavior variables.
To appropriately segment customers into the S1–S7 groups, we add where customers rank in their groupings to the group variable design. For example, international voice calls are telecom services that are often used by business customers or those who roam internationally, and are a source of mobile revenue. To differentiate the main users of international voice services into different cost bands and customer contributions, we investigate which customers are willing to use international voice roaming services and establish the difference in the dependence degree of international voice roaming groups. We summarize the number of minutes used by individual international voice customers in the overall customer segment rankings, using inter-national phonetic variables to derive the variable type. Therefore, after the second-level grouping, we can analyze the voice call behavior of relative subgroups within the overall group.
We take the following steps to clean up (pre-process) the input variables of the L2 cluster:
correlation coefficient analysis—eliminate the de-pendency on high-value variables to avoid excessively similar weightings that result in subgroup errors; and
Outlier processing—replace the outliers using the ceiling or floor method to avoid bias due to extremes that affect the clustering algorithm in determining customer attributes.
two-step, and Kohonen are used to establish the cluster model according to customer attributes, behavior preferences, and contract status. Each L1 cluster is split into five-to-seven different L2 clusters. The optimal clustering model is then selected as the basis of the final L2 clustering, based on conditions such as the maximum and minimum cluster ratio, the silhouette coefficient, and readability for marketers.
IV. CONCLUSION
Our two-layer customer clustering model provides a macro and micro perspective to assist mobile CRM. Marketers can use pre-analysis and data mining to target their customers and sell the company’s products and services with accurate marketing. In addition, the expert-rule L1 subgroup can help companies to develop a general CRM direction and improve customer service. After establishing the clustering model and related strategies, we can track changes in the group structure periodically and systematically. This allows us to monitor trends in group movement, monitor size changes in each cluster, and adjust the group marketing policy and management strategy to enhance the effectiveness of the early warning mechanism. At present, customer clustering is only included in cluster modeling through mobile voice, data us-age behavior, customer contributions, and customer base data. In future work, we intend to increase the grouping of the customer-variables selection function. For different marketing or business needs, a customer-clustering model will be established to increase the flexibility of customer-clustering applications. In addition, in accordance with changing customer group structures to achieve a set threshold value, we aim to establish restart of the cluster modeling process or modify the marketing strategy of the warning mechanism to improve the dynamic feedback model grouping benefits.
V.
REFERENCES
[1]. N. Lu et al., "A Customer Churn Prediction Model in Telecom Industry Using Boosting," IEEE Trans. Indus-trial Informatics, vol. 10, no. 2, 2014, pp. 1659-1665.
[2]. T. Jiang and A. Tuzhilin, "Improving
Personalization Solutions through Optimal Segmentation of Customer Bases," IEEE Trans. Knowledge and Data Eng., vol. 21, no. 3, 2009; doi:10.1109/ICDM.2006.87.
[3]. C. Qiuru et al., "Telecom Customer
Segmentation Based on Cluster Analysis," Proc. 2012 Int’l Conf. Computer Science and Information Processing (CSIP), 2012, pp. 1179-1182.
[4]. J. Han and M. Kamber, Data Mining: Concepts
and Techniques, 2nd ed., Elsevier, 2006.
[5]. R.S. Duboff, "Marketing to Maximize
Profitability," J. Business Strategy, vol. 13, no. 6, 1992, pp. 10-13.
[6]. S.Y. Kim et al., "Customer Segmentation and Strategy Development Based on Customer Lifetime Value: A Case Study," Expert Systems with Applications, vol. 31, 2006, pp. 101-107. [7]. S.H. Han et al., "Segmentation of Telecom
Customers Based on Customer Value by Decision Tree Model," Expert Systems with Applications, vol. 39, 2012, pp. 3964-3973. [8]. S. Masood et al., "Customer Segmentation and
Analysis of a Mobile Telecommunication Company of Pakistan using Two Phase Clustering Algorithm," Proc. Int’l Conf. Digital Information Management (ICDIM), 2013, pp. 137-142.
[9]. J. Wu and Z. Lin, "Research on Customer Segmentation Model by Clustering," Proc. 7th Int’l Conf. Electronic Commerce, 2005, pp. 316-318.
[10]. S.M.H. Jansen, Customer Segmentation and
Customer Pro-filing for a Mobile
Behavior: A Vodafone Case Study, 17 July 2007.
[11]. D.M. Eler et al., "Simplified Stress and Simplified Silhouette Coefficient to a Faster
Quality Evaluation of Multidimensional
Projection Techniques and Feature Spaces,"
Proc. 19th Int’l Conf. Information
Visualization, 2015, pp. 133-139.