Scholarship@Western
Scholarship@Western
Electronic Thesis and Dissertation Repository
9-12-2019 2:00 PM
Above- and belowground community linkages in boreal peatlands
Above- and belowground community linkages in boreal peatlands
and climate warming implications
and climate warming implications
Caitlyn Lyons Supervisor Lindo, Zoë
The University of Western Ontario Graduate Program in Biology
A thesis submitted in partial fulfillment of the requirements for the degree in Master of Science © Caitlyn Lyons 2019
Follow this and additional works at: https://ir.lib.uwo.ca/etd
i
Aboveground plants provide resources to the belowground microbial community via plant litter and, in turn, the belowground microbial community provides nutrients for plant uptake, linking the two systems. My aim was to characterize and describe differences in plant
community composition, plant litter quality and microbial community composition between two boreal peatlands in northern Ontario. These peatlands have contrasting plant and
microbial communities, the Sphagnum moss-dominated peatland harboring a higher fungi to bacteria ratio compared to the Carex sedge-dominated peatland. Clear open top chambers were installed at both sites to simulate warming. Higher temperatures decreased Sphagnum
moss in the Sphagnum-dominated peatland, increased aboveground biomass in the Carex
sedge dominated peatland, and increased the heterogeneity in plant community composition at both sites. Shifts in aboveground plant community and subsequent plant litter quality inputs to the microbial community has potential implications for peatland carbon storage.
Keywords
ii
Summary for Lay Audience
Dead plant material that enters the soil system is an important source of nutrients for soil microorganisms who, in turn, recycle nutrients and make them available for plant uptake. Peatlands are a type of wetland with a large organic soil layer composed of partially
decomposed plant material called peat. Peat is rich in carbon, making peatlands an important global carbon store. Plants and microorganisms can be described along a spectrum of fast growing with high nutrient demands to slow growing with low nutrient demands, and plants are thought to be paired with microorganisms with similar traits. My thesis describes both the aboveground plant community and the belowground microbial community in two contrasting boreal peatlands located in northern Ontario. The two peatland sites I have characterized are: 1) a Sphagnum moss-dominated peatland with nutrient poor plants that is dominated by fungi, a slow nutrient cycler; and 2) a Carex sedge-dominated peatland with nutrient rich plants, dominated by bacteria, a fast nutrient cycler. The contrasting plant and soil microorganism communities have implications on carbon storage, with the Sphagnum-dominated peatland having the potential to store more carbon. I also explored the impacts of warming on the aboveground plant communities at both of these peatland sites using clear open top chambers that act as a greenhouse, warming the air. At both sites, under higher temperatures, plant community composition was more variable: in the Sphagnum-dominated peatland I saw a decrease in moss abundance, and in the Carex-dominated peatland I saw an increase in aboveground biomass. Sphagnum is important in maintaining the carbon
iii
Co-Authorship Statement
iv
Acknowledgments
v
Table of Contents
Abstract ... i
Summary for Lay Audience ... ii
Co-Authorship Statement ... iii
Acknowledgments ... iv
Table of Contents ... v
List of Tables ... viii
List of Figures ... x
List of Appendices ... xii
List of Abbreviations ... 1
Chapter 1 ... 2
1 Introduction ... 2
1.1 Linking aboveground and belowground communities ... 2
1.2 Boreal peatlands ... 5
1.3 Climate warming effects on ecological communities ... 6
1.4 Climate change and peatland plant communities ... 7
1.5 Site selection and description ... 8
1.6 Thesis objectives and rationale ... 9
1.7 References ... 10
Chapter 2 ... 16
2 Above- and belowground community linkages in boreal peatlands ... 16
2.1 Introduction ... 16
2.2 Materials & Methods ... 19
2.2.1 Site description ... 19
vi
2.2.3 Plant litter and peat sampling ... 21
2.2.4 Phospholipid fatty acid analysis ... 22
2.2.5 Statistical analysis ... 24
2.3 Results ... 25
2.3.1 Aboveground plants and litter ... 25
2.3.2 Peat quality and belowground microbial community ... 33
2.4 Discussion ... 38
2.5 References ... 43
Chapter 3 ... 50
3 Climate warming and plant community shifts in boreal peatlands ... 50
3.1 Introduction ... 50
3.2 Materials & Methods ... 52
3.2.1 Site description ... 52
3.2.2 Sampling design ... 53
3.2.3 Environmental properties ... 54
3.2.4 Vegetation surveys ... 56
3.2.5 Statistical analysis ... 57
3.3 Results ... 59
3.3.1 Environmental conditions ... 59
3.3.2 Univariate community measures ... 60
3.3.3 Community measures ... 64
3.4 Discussion ... 70
3.5 References ... 74
Chapter 4 ... 79
4 Discussion ... 79
vii
4.2 Plant communities along the ‘fast-slow’ spectrum ... 79
4.3 Microbial communities along the ‘fast-slow’ spectrum ... 81
4.4 Warming induced heterogeneity in plant communities ... 82
4.5 The role of plant and microbial communities in carbon cycling ... 84
4.6 Study limitations and future directions ... 85
4.7 Conclusions and significance ... 87
4.8 References ... 88
Appendices ... 94
References ... 98
viii
List of Tables
Table 2.1 Plant variables measured at two peatland sites in northern Ontario, Canada. Values are means ± standard error (n=12). F & P values correspond to the main effect of fen
corresponding to way ANOVAs for Shannon’s diversity and Pielou’s evenness and two-way MANOVAs for %C, %N, and C:N. ... 26
Table 2.2 Peat variables measured at two peatland sites in northern Ontario, Canada (n=5). Values are means ± standard error, and statistical F & P values correspond to main effect of fen. Peat %C, %N, and C:N results are based on one-way MANOVA. Peat moisture content and basal respiration results are based on one-way ANOVA. PLFA univariate community indices results correspond to one-way ANOVA. ... 34
Table 3.1 Environmental variables for the two experimental peatland sites near White River, Ontario. Values are based on weather station data collected every 15 seconds, and are means (± standard deviation) over the growing season (May – August). Total rainfall is rainfall over the growing season. ... 55
Table 3.2 Air temperature inside and outside of warming treatment plots at the two
experimental fen sites measured on average twice a week from June to August 2017. Values are means ± standard deviation. Letters denote significant differences. ... 61
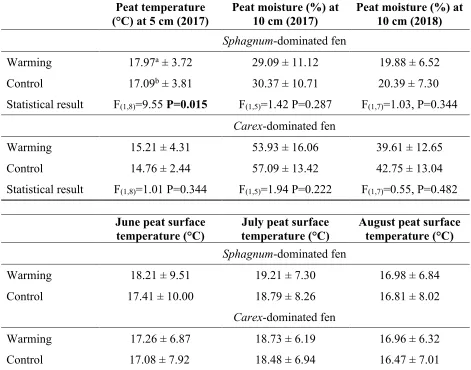
Table 3.3 Peat environmental variables (means± standard deviation) within both the control and warming treatments at both sites. Statistical results indicate significant differences between main effect of treatment using a two-way repeated measures ANOVA (treatment and blocks as main effects, time as repeated measure). ... 62
ix
x
List of Figures
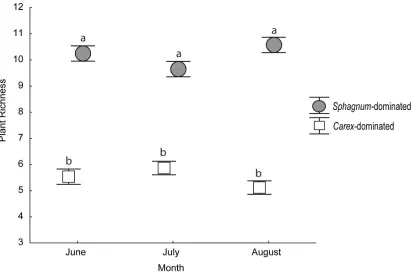
Figure 2.1 Mean plant richness at both the Sphagnum-dominated and Carex-dominated fen across three sampling time points (June, July and August) during 2018. Letters denote significant differences using Tukey HSD post-hoc comparisons and error bars are standard error. ... 27
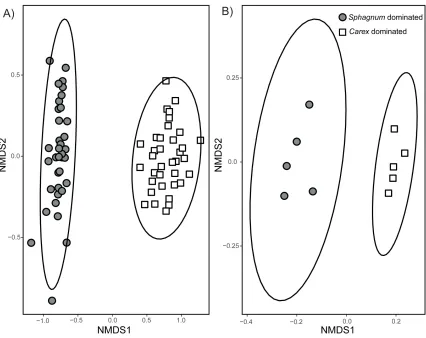
Figure 2.2 Compositional similarities of A) aboveground plant communities (n=36) and B) belowground microbial communities (n=5). Aboveground plant communities are based on aboveground biomass of individual plant species from 0.25m2 plots. Belowground microbial
communities are based on PLFAs extracted from the top 5-10cm of peat. Stress is 0.1 with k=2 (number of dimensions) for the aboveground plant communities and 0.05 with k=2 for the belowground microbial communities. The ellipses indicate 95% confidence intervals. .. 30
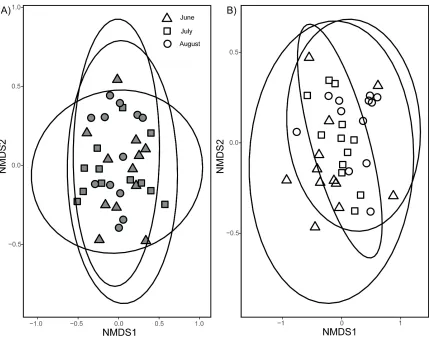
Figure 2.3 Compositional similarities of A) aboveground plant communities in the
Sphagnum-dominated fen (n=36) and B) aboveground plant communities in the Carex -dominated fen (n=36) across three sampling periods in 2018: June, July, and August. Aboveground plant communities are based on aboveground biomass of individual plant species from 0.25m2 plots. Stress is 0.24 with k=2 (number of dimensions) for the SF and
0.16 with k=2 for the CF. The ellipses indicate 95% confidence intervals. ... 31
Figure 2.4 Mean litter biomass (g/0.25 m2), %C, %N, and C:N at both the Sphagnum
-dominated and Carex-dominated fen across three sampling times: end of growing season, winter, and growing season (n=5). Letters denote significant differences after Tukey HSD post hoc comparisons and error bars are standard error. ... 32
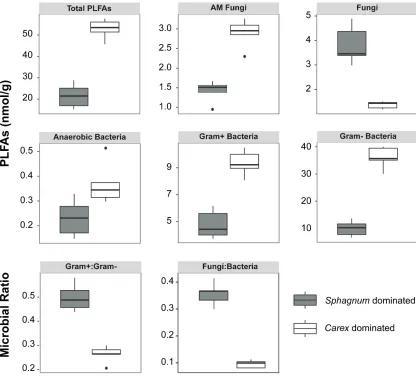
Figure 2.5 Boxplots of the total amount of PLFAs in the peat, the different microbial groups, the Gram+ to Gram- ratio, and the fungi to bacteria ratio (n=5). All means are significantly different between the SF and CF based on a one-way MANOVA ... 35
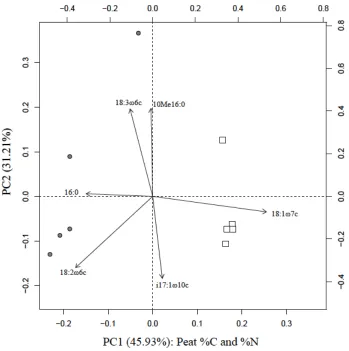
Figure 2.6 Principal Components Analysis biplot for the belowground microbial
communities based on the PLFAs (n= 5); only PLFAs with scores greater than 0.2 are shown. Positive PC1 values correspond to low %C and high %N and negative PC1 values
xi
measured environmental variables. 16:00 is a fatty acid associated with Gram+ bacteria, 18:3ω6c and 18:2ω6c corresponds with general fungi, 10Me16:0 corresponds with
actinomycetes, 18:1ω7c corresponds with Gram-bacteria, i17:1ω10c corresponds to Gram- bacteria. The SF is indicated by gray circles and the CF is indicated by white squares. ... 37
Figure 3.1 Mean Leaf Area Index as a proxy for plant biomass (excluding mosses and other ground cover) for both control and warming chambers across two growing seasons (2017 & 2018) for the A) Sphagnum-dominated fen (SF) and B) the Carex-dominated fen (CF). Error bars represent standard error. ... 65
Figure 3.2 Compositional similarities of plant communities across two growing seasons under control and warming treatments in the Sphagnum-dominated fen (SF) (A) and the
Carex-dominated fen (CF) (B). Ordination stress as a measure of ease to plot the
communities in space is 0.17 for SF with three axes and stress is 0.13 for CF with three axes. The ellipses represent 95% confidence intervals. ... 66
xii
List of Appendices
Appendix A: The %C, %N, and C:N values for fresh plant material collected from each species observed at two peatland sites in northern Ontario. Values are means ± standard error for three replicate plants where possible. ... 94
Appendix B: Specific PLFA biomarkers associated with various microbial groups ... 95
Appendix C: A schematic map of the experimental set-up for the two peatland sites, A) the
Sphagnum-dominated fen (SF) and B) the Carex-dominated fen (CF). At both sites, the experimental layout included four blocks with four plots each to account for spatial
heterogeneity in plant community composition. Within each block, experimental plots were assigned as two warming and two control treatments. ... 96
List of Abbreviations
ANOVA Analysis of Variance
C Carbon
CF Carex-dominated Fen
CWM Community Weighted Means
F:B Fungi:Bacteria
LAI Leaf Area Index
MANOVA Multivariate Analysis of Variance
MVDisp Multivariate Dispersion Index
N Nitrogen
NMDS Non-Metric Multidimensional Scaling Ordination
OTC Open-top Chamber
PCA Principal Components Analysis
PERMANOVA Permutational Multivariate Analysis of Variance
PLFA Phospholipid Fatty Acid
SF Sphagnum-dominated Fen
Chapter 1
1
Introduction
1.1 Linking aboveground and belowground communities
The aboveground (plant) and belowground (soil microbial) communities in terrestrial systems do not function independently, rather there is a feedback between the two. This feedback exists through an exchange of resources between the above- and belowground communities (Wardle et al. 2004). Plants provide resources to the microbial community via litter (Hättenschwiler et al. 2005) and root exudates (Porazinska et al. 2003; Brzostek et al. 2013). The belowground system in turn cycles soil nutrients during the process of decomposition, making them available for plant uptake. The life history traits of both the aboveground plant species and the belowground microbial groups can influence both the rate and the quality of resource exchange between the two systems. It has been long established that species demonstrate trade-offs in growth, reproduction, and more generally resource allocation and acquisition that leads to differences in life history strategies (Grime 1977; Wright et al. 2004; Westoby and Wright 2006). Grime (1977) was the first to describe and formalize this paradigm in plant species traits where he described fast-growing, nutrient exploitative and slow-growing, nutrient conservative dichotomous plant trait strategies. In reality, plants and other organisms are constrained by ecological trade-offs, but life history traits exist along a continuum between the two extremes (Grime 1977; Reich 2014). In addition, at a food web and ecosystem level, these differences in life history traits translates into differences in the nutritional value (quality) of plants and microorganisms with implications on resource cycling between the above- and belowground communities.
inputs is by examining the Carbon (C) to Nitrogen (N) ratio (C:N). Nitrogen is often the limiting resource in terrestrial systems (Vitousek and Howarth 1991), constraining growth and productivity. Plants that are efficient at acquiring N, and have greater N in their tissues, produce litter inputs to the soil system that are higher in N, and are thus considered to be more labile and of higher quality for microbial growth. Plants such as mosses that depict ‘slow’ life history traits such as short stature, slow growth rates and high shade tolerance, tend to succeed in more nutrient poor environments, withstanding lower amounts of resources that might be limiting to other plant species (Grime et al. 1990). In contrast, plants that depict ‘fast’ life history traits, such as sedges, tend to populate environments that are more nutrient rich and therefore provide more nutrient rich resources to the belowground (Keddy et al. 1998). Sedges are associated with the ‘fast’ life history traits such as tall height and fast growth, enabling efficient capture and utilization of resources such as light, water, nutrients or space (Grime 1974).
Traits exist at the level of the individual, but are mostly derived by species-specific morphological, physiological and behavioural traits. At the community-level, the ecological community is a collection of species demonstrating various life history strategies. The biomass ratio hypothesis postulates that the most dominant species will have the greatest effect on ecosystem processes (Grime 1998). As such, to determine traits of the community as a whole, ecologists often use community-weighted means (CWM) to account for the relative abundance of different species in a community. This is important when considering inputs to the belowground system, as both the plant species present and the relative dominance of each will impact both the quantity and quality (%C, %N, and C:N) of resources available to the soil microorganisms.
Aboveground plant inputs are the basal resource for the soil food web. The belowground soil microorganisms decompose the plant inputs and recycle soil resources making them available for plant uptake. Decomposition is a multi-step process involving both physical and chemical processes (Coleman et al. 2004). During the initial stage any of the
dissolvable compounds are leached into the water present in the soil. The second stage involves the physical fragmentations of plant material by soil invertebrates and the
transform the smaller pieces into basic inorganic forms of nitrogen, phosphorus and carbon that plants can uptake (Van Der Heijden et al. 2008). The microbial community can also utilize the dissolvable compounds produced by leaching (Allison et al. 2010; Blagodatsky et al. 2010) and furthermore much of the microbially derived products are reused by other microorganisms and the rest of the soil food web (Kögel-Knaber 2002).
Similar to their aboveground counterparts, microorganisms can also demonstrate ‘fast-slow’ life history traits. In addition to ‘fast-‘fast-slow’ life history traits, Grime (1977) also recognizes three possible survival strategies: 1) ruderal, indicating an ability to colonize under high disturbance and have low stress tolerance; 2) stress-tolerant, indicating an ability to colonize under low disturbance and high stress; and 3) competitive, indicating an ability to colonize under low disturbance and low stress. Along this continuum, it is generally held that bacteria are considered ruderal, fast growing and nutrient exploitative whereas fungi are more stress tolerant, slow growing and nutrient conservative (Wardle et al. 2004). Bacteria are considered to cycle nutrients faster than fungi, demonstrating greater decomposition and high heterotrophic respiration rates (Wardle et al. 2004). Soil systems dominated by bacterial communities have been demonstrated to store less carbon and subsequently release more CO2 to the atmosphere (Strickland et al. 2009; Strickland
and Rousk 2010; Malik et al. 2016). Fungi are considered to have slow nutrient cycling and lower rates of heterotrophic respiration resulting in more carbon stored in soils (Malik et al. 2016). Furthermore, fungi have the ability to use specialized enzymes to break down more recalcitrant plant litter that bacteria cannot, yet fungi are not limited to utilizing only recalcitrant low quality litter; they also utilize labile litter (Waldrop and Firestone 2004; Caruso et al. 2018). The C:N values of microbial biomass are indicative of ‘fast’ versus ‘slow’ processes where bacteria C:N is typically lower (greater
1.2 Boreal peatlands
Peatlands, wetlands with organic soils greater than 40 cm deep, cover ~13% of the Canadian landscape, and the majority (~97%) of Canadian peatlands are located in the boreal region (Tarnocai et al. 2011). Not only are peatlands a dominant feature on the Canadian landscape, they are also a unique ecosystem to study above- and belowground community linkages because the aboveground plants leave their legacy as partially decomposed organic matter or “peat”. Decomposition is a slow process in boreal peatlands compared to other ecosystems because low temperatures, waterlogged and acidic conditions slow decomposition rates, allowing for the accumulation of peat (Moore et al. 2007). Plant productivity in peatlands is also generally low, but the even slower decomposition rate creates an accumulation of undecomposed plant material (peat) that is a C store and establishes peatlands as important global C sinks. This net gain of C to the soil system in peatlands means that peatlands store 1/3 of the world’s terrestrial C despite only covering ~3% of the globe (Gorham 1991). As the plant litter is an important
constituent of the peat, the aboveground plant community has a strong influence on the inputs to the belowground microbial community and the C storage potential of peatlands. At the same time, the microbial community (fungi and bacteria), as the primary
decomposers of this plant material, are also important when considering the C
sequestration ability of peatlands. Decomposition rate is the main determinant of net C storage potential for peatlands.
Boreal peatlands are not uniform in terms of aboveground plant community composition, hydrology, or nutrient content. Rather, they exist along a continuum from nutrient poor, hydrologically unconnected and Sphagnum-dominated bogs to relatively nutrient rich, hydrologically connected and vascular plant dominated fens (Rydin and Jeglum 2013). This continuum likely extends to the belowground microbial community as well. Several studies have examined the aboveground plant community composition in boreal
peatlands (for example, Whitehouse and Bayley 2005; Locky and Bayley 2006; Palozzi and Lindo 2017), while other studies have examined the belowground microbial
community composition in boreal peatlands (for example, Haynes et al. 2015;
Borga et al. 1994). Both the above- and belowground community play roles in ecosystem functions such as C storage in boreal peatlands, and both should be studied in tandem especially when climate change is expected to impact both the plant (Weltzin et al. 2003; Jassey et al. 2013; Buttler et al. 2015; Dieleman et al. 2015) and microbial communities (Bragazza et al. 2013; Asemaninejad et al. 2017b, 2018).
1.3 Climate warming effects on ecological communities
Anthropogenic activities have altered the environment so intensively that many scientists agree we have entered a new geological epoch, the Anthropocene (Crutzen 2002). One aspect of this new epoch is the rise in atmospheric CO2, associated with human activities;
which is inducing climate warming across the globe. The ever-increasing atmospheric levels of CO2 are unprecedented within the past 22,000 years and are 40% above
pre-industrial levels (IPCC 2013). There is a linear relationship between CO2 levels and
temperature (Allen et al. 2009; Gillett et al. 2013) as CO2 is a greenhouse gas. As humans
continue to emit CO2 through the burning of fossil fuels, global temperatures are
predicted to continue to rise. A special report published by the IPCC indicates that global average temperatures have risen by 1ºC (likely between 0.8 and 1.2 ºC) in 2017 since pre-industrialization and are expected to rise by 0.2 ºC (0.1 and 0.3 ºC) with each passing decade (IPCC 2018). While there are other global change factors besides rising CO2
concentrations, such as alterations in precipitation, increased NOx deposition and other global pollutants, and land use change / habitat loss that are affecting ecological
communities (Sala et al. 2000), it is also important to quantify the direct consequences of climate warming on ecological communities and ecosystem-level processes.
Rising temperatures alters abiotic conditions, disrupting ecological communities. Community composition is a function of both species’ interactions with the abiotic environment and interactions between species. Species’ ranges encompass the possible habitable environments, and alterations in abiotic conditions can shift environments from habitable to uninhabitable for certain species while shifting from uninhabitable to
interactions, modifying the outcomes of competition, decoupling mutualistic partnerships, and altering predator-prey dynamics. Predicting the effects of climate warming on community composition is difficult to generalize as the responses tend to depend on species’ life history traits although fast life history traits tend to win under warming (Parmesan 2007; Berg et al. 2010).
Across the globe, rising temperatures are altering community composition and the rates of key ecosystem processes they mediate. Yet, temperature increases are not uniform across the globe, with certain regions experiencing increases in temperature much higher than the global average, such as higher latitudes like the boreal zone. Warming effects in high latitude regions can result in snow, ice and permafrost melt, thereby decreasing the regional albedo and creating a positive feedback to further amplify warming in northern regions (Holland and Bitz 2003). Canada’s Changing Climate Report 2019 indicates that Canada has seen an increase in temperature of 1.7ºC (likely between 1.1 and 2.3ºC) between 1948 and 2016 compared to the pre-industrial temperatures, whereas northern Canada has seen an increase of 2.3ºC (likely between 1.7 and 3ºC) (Zhang et al. 2019). Furthermore, all four of the predicted climate scenarios from the IPCC (2013) indicate that Canada’s projected increase in temperature is twice the corresponding global temperature increase (Zhang et al. 2019). As such, it is clear that Canada’s northern ecosystems are at an increased risk to rising temperatures.
1.4 Climate change and peatland plant communities
Several previous studies have examined the impacts of rising temperatures on boreal peatland plant communities. These studies have mainly focused on Sphagnum-dominated peatlands, with the generally consensus that there will be a shift in the ‘fast-slow’
spectrum, away from the slower growing Sphagnum spp. towards the faster growing vascular plant species (Weltzin et al. 2000; 2003; Fenner et al. 2007; Dieleman et al. 2015). Mechanistically this arises as warming shifts the competitive outcome in favour of the faster growing, nutrient exploitative species. The various studies have shown shifts towards different vascular plant types. For instance, Dieleman et al. (2015) and Fenner et al. (2007) in a mesocosm lab experiment noted a shift from Sphagnum spp. to
in shrub dominance. Jassey et al. (2013) and Buttler et al. (2015), in a field study, found an increase in total vascular abundance using passive warming open-top chambers (OTC) and Bragazza et al. (2016) also found an increase in vascular plant abundance by
transplanting peat cores with intact vegetation to a lower altitude with warmer
temperatures. Finally, Bragazza et al. (2013), in an observational study, observed higher shrub biomass at lower altitudes with higher soil temperatures compared to peatlands at higher elevations with lower soil temperatures. Fewer studies have focused on graminoid dominated peatlands such as Carex spp.. Where studies have been done, Weltzin et al. (2000; 2003) using a mesocosm design, and Mäkiranta et al. (2018) using passive warming OTCs, no shifts in plant community composition under warming were found. However, Weltzin et al. (2000; 2003) did find an increase in annual net primary
productivity of graminoids.
1.5 Site selection and description
Two boreal peatlands sites were selected for this thesis, they are located near White River, Ontario (48°21’N, 84°20’W); these sites have been monitored as long-term research sites by the Ontario Ministry of Natural Resources and Forestry for the past 15 years (see Webster and McLaughlin (2010) for full description). The two boreal peatland sites are fens; one fen has a nutrient poor status and is dominated by Sphagnum spp. mosses while the other fen has an intermediate nutrient status and is dominated by Carex
spp. sedges. The fens will henceforth be referred as SF (Sphagnum-dominated fen) and CF (Carex-dominated fen), respectively. Both the SF (4.5 ha) and the CF (10.2 ha) are surrounded by mixed wood forests, while the SF has a small lake on the southeastern side, and the CF has two small stream tributaries on the northern and southwestern edges.
There is an understory of Sphagnum mosses (S. magellanicum Brid., S. angustofolium
(C.E.P. Jensen ex Russow) C.E.O Jensen, S. fuscum (Schimp.) Klinggr., and S.
shrubs such as Labrador tea (Rhododendron groenlandicum Oeder), leatherleaf (Chamaedephne calyculata L. Moench), Bog laurel (Kalmia polifolia Wagenh.), Bog rosemary (Andromeda polifolia L.), and lowbush blueberry (Vaccinium angustifolium
Aiton). Ericaceous shrubs are evergreen, allowing plants to persist in nutrient poor environments through leaf longevity and reducing nutrient loss through leaf litter
production. The SF is also sparsely treed by two coniferous species: black spruce (Picea mariana (Mill.) B.S.P.) and tamarack (Larix laricina (Du Roi) K. Koch). Both species have adventitious roots that allow them to persist in waterlogged conditions.
Carex spp. predominate the CF; the main species include C. stricta Lam., C. oligosperma
Michx., and C. lasciocarpa. The three Carex spp. tend to grow in small patches semi-isolated from one another, as Carex spp. spread laterally by rhizomatous growth to form clonal patches, rarely reproducing by seed. Carex spp. also have specialized tissue structures (aerenchyma) to retain oxygen enabling Carex spp.to persist in low oxygen environments, such as waterlogged peatlands. Leatherleaf and sweet gale (Myrica gale
L.) are the most abundant shrubs found in the CF. Sweet gale is a deciduous shrub and is more prevalent than leatherleaf, indicative of the intermediate nutrient status at this peatland where sweet gale is able to allocate more resources to new leaf growth every year. Sphagnum mosses occupy sparse patches in the CF (see Palozzi and Lindo (2017) for previous plant community description).
1.6 Thesis objectives and rationale
In this thesis, I investigate plant and microbial community linkages in boreal peatlands located in northern Ontario, and examine changes in plant community composition for two peatland vegetation types under warming. One peatland is dominated by Sphagnum
mosses (Sphagnum Fen (SF)) and the other dominated by Carex sedges (Carex Fen (CF)); these sites also differ in nutrient status, and hydrology. My specific objectives were to:
1) Link the aboveground plant community composition to the belowground
quality (%C, %N, and C:N) to the belowground peat quality at both the SF and CF in an observational study (Chapter 2).
2) Compare plant community composition under passive warming to control
temperature plots in both the SF and CF using univariate community indices and multivariate analysis (Chapter 3).
I describe and compare the plant and microbial communities of the SF and the CF. The two vegetation types (Sphagnum and Carex)represent the dominant plants found in the majority of boreal peatlands. To characterize the plant community composition, I measured the aboveground biomass for each plant species, and to characterize the belowground microbial community, I used phospholipid fatty acid analysis. I then link the plant and microbial communities by describing the quality of the plant inputs and the peat environment by determining the %C, %N, and C:N of the fresh plant material, annual plant litter inputs, and the peat.
I then analyzed the effects of passive warming on plant community composition in those same two peatlands in a large-scale field warming experiment over two years. I used clear OTCs to simulate warming at both the SF and CF and compared the warming plant communities to un-warmed (control) plots. Field experiments can provide greater
ecological validity compared to lab-based studies, as they can better simulate natural systems. The response of vascular peatlands under warming are understudied and yet are equally important to consider. In both chapters I considered the aboveground plant inputs and the ecosystem-level process of C storage in boreal peatlands.
1.7 References
Allison SD, Wallenstein MD, Bradford MA (2010) Soil-carbon response to warming dependent on microbial physiology. Nat Geosci 3:336–340. doi: 10.1038/ngeo846
Allen MR, Frame DJ, Huntingford C, Jones CD, Lowe JA, Meinshausen M, Meinshausen N (2009) Warming caused by cumulative carbon emissions towards the trillionth tonne. Nature 458:1163–1166. doi: 10.1038/nature08019
10.1080/11956860.2019.1595932
Asemaninejad A, Thorn RG, Branfireun BA, Lindo Z (2018) Climate change favours specific fungal communities in boreal peatlands. Soil Biol Biochem 120:28–36. doi: 10.1016/j.soilbio.2018.01.029
Asemaninejad A, Thorn RG, Lindo Z (2017a) Vertical distribution of fungi in hollows and hummocks of boreal peatlands. Fungal Ecol 27:59–68. doi:
10.1016/j.funeco.2017.02.002
Asemaninejad A, Thorn RG, Lindo Z (2017b) Experimental climate change modifies degradative succession in boreal peatland fungal communities. Microb Ecol 73:521– 531. doi: 10.1007/s00248-016-0875-9
Berg MP, Toby Kiers E, Driessen G, van der Heijden M, Kooi BW, Kuenen F, Liefting M, Verhoef HA, Ellers J (2010) Adapt or disperse: Understanding species persistence in a changing world. Glob Chang Biol 16:587–598. doi:
10.1111/j.1365-2486.2009.02014.x
Blagodatsky S, Blagodatskaya E, Yuyukina T, Kuzyakov Y (2010) Model of apparent and real priming effects: Linking microbial activity with soil organic matter
decomposition. Soil Biol Biochem 42:1275–1283. doi: 10.1016/j.soilbio.2010.04.005
Borga P, Nilsson M, Tunlid A (1994) Bacterial communities in peat in relation to botanical composition as revealed by phospholipid fatty acid analysis. Soil Biol Biochem 26:841–848. doi: 10.1016/0038-0717(94)90300-X
Bragazza L, Buttler A, Robroek BJM, Albrecht R, Zaccone C, Jassey VEJ, Signarbieux C (2016) Persistent high temperature and low precipitation reduce peat carbon
accumulation. Glob Chang Biol 22:4114–4123. doi: 10.1111/gcb.13319
Bragazza L, Parisod J, Buttler A, Bardgett RD (2013) Biogeochemical plant-soil microbe feedback in response to climate warming in peatlands. Nat Clim Chang 3:273–277. doi: 10.1038/nclimate1781
Brzostek ER, Greco A, Drake JE, Finzi AC (2013) Root carbon inputs to the rhizosphere stimulate extracellular enzyme activity and increase nitrogen availability in temperate forest soils. Biogeochemistry 115:65–76. doi: 10.1007/s10533-012-9818-9
Buttler A, Robroek BJM, Laggoun-Défarge F, Jassey VEJ, Pochelon C, Bernard G, Delarue F, Gogo S, Mariotte P, Mitchell EAD, Bragazza L (2015) Experimental warming interacts with soil moisture to discriminate plant responses in an ombrotrophic peatland. J Veg Sci 26:964–974. doi: 10.1111/jvs.12296
Caruso T, De Vries FT, Bardgett RD, Lehmann J (2018) Soil organic carbon dynamics matching ecological equilibrium theory. Ecol Evol 8:11169–11178. doi:
Coleman DC, Crossley DA, Hendrix PF (2 eds) (2004) Fundamentals of Soil Ecology. Elsevier, MA, USA.
Crutzen PJ (2002) Geology of mankind. Nature 415:23. doi: 10.1038/415023a
Dieleman CM, Branfireun BA, Mclaughlin JW, Lindo Z (2015) Climate change drives a shift in peatland ecosystem plant community: Implications for ecosystem function and stability. Glob Chang Biol 21:388–395. doi: 10.1111/gcb.12643
Fenner N, Freeman C, Lock MA, Harmens H, Reynolds B, Sparks T (2007) Interactions between elevated CO2 and warming could amplify DOC exports from peatland catchments. Environ Sci Technol 41:3146–3152. doi: 10.1021/es061765v
Gillett NP, Arora VK, Matthews D, Allen MR (2013) Constraining the ratio of global warming to cumulative CO2 emissions using CMIP5 simulations. J Clim 26:6844– 6858. doi: 10.1175/JCLI-D-12-00476.1
Gorham E (1991) Northern Peatlands : Role in the carbon cycle and probable responses to climatic warming. Ecol Appl 1:182–195
Grime JP (1974) Vegetation classification by reference to strategies. Nature 250:26–31. doi: https://doi.org/10.1038/250026a0
Grime JP (1977) Evidence for the existence of three primary strategies in plant and its relevance to ecological and evolutionary theory. Am Nat 111:1169–1194. doi: 10.1103/PhysRevE.76.042103
Grime JP (1998) Benefits of plant diversity to ecosystems: immediate, filter and founder effects. J Ecol 86:902–910.
Grime JP, Rincon ER, Wickerson BE (1990) Bryophytes and plant strategy theory. Bot J Linn Soc 104:175–186. doi: 10.1111/j.1095-8339.1990.tb02217.x
Hättenschwiler S, Tiunov AV, Scheu S (2005) Biodiversity and litter decomposition in terrestrial ecosystems. Annu Rev Ecol Evol Syst 36:191–218. doi:
10.1146/annurev.ecolsys.36.112904.151932
Haynes KM, Preston MD, McLaughlin JW, Webster K, Basiliko N (2015) Dissimilar bacterial and fungal decomposer communities across rich to poor fen peatlands exhibit functional redundancy. Can J Soil Sci 95:219–230. doi: 10.4141/cjss-2014-062
Holland MM, Bitz CM (2003) Polar amplification of climate change in coupled models. Clim Dyn 21:221–232. doi: 10.1007/s00382-003-0332-6
IPCC (2018): Summary for Policymakers. In: Global Warming of 1.5°C. An IPCC Special Report on the impacts of global warming of 1.5°C above pre-industrial levels and related global greenhouse gas emission pathways, in the context of strengthening the global response to the threat of climate change, sustainable development, and efforts to eradicate poverty. [Masson-Delmotte, V., P. Zhai, H.-O. Pörtner, D. Roberts, J. Skea, P.R. Shukla, A. Pirani, W. Moufouma-Okia, C. Péan, R. Pidcock, S. Connors, J.B.R. Matthews, Y. Chen, X. Zhou, M.I. Gomis, E. Lonnoy, Maycock, M. Tignor, and T. Waterfield (eds.)]. World Meteorological Organization, Geneva, Switzerland, 32 pp.
Jassey VE, Chiapusio G, Binet P, Buttler A, Laggoun-Défarge F, Delarue F, Bernard N, Mitchell EA, Toussaint ML, Francez AJ, Gilbert D (2013) Above- and belowground linkages in Sphagnum peatland: Climate warming affects plant-microbial interactions. Glob Chang Biol 19:811–823. doi: 10.1111/gcb.12075
Keddy P, Fraser LH, Wisheu IC (1998) A comparative approach to examine competitive response of 48 wetland plant species. J Veg Sci 9:777–786. doi: 10.2307/3237043
Kögel-Knaber I (2002) The macromolecular organic composition of plant and microbial residues as inputs to soil organic matter. Soil Biol Biochem 34:139–162.
Locky DA, Bayley SE (2006) Plant diversity, composition, and rarity in the southern boreal peatlands of Manitoba, Canada. Can J Bot 84:940–955. doi: 10.1139/b06-049
Mäkiranta P, Laiho R, Mehtätalo L, Straková P, Sormunen J, Minkkinen K, Penttilä T, Fritze H, Tuittila ES (2018) Responses of phenology and biomass production of boreal fens to climate warming under different water-table level regimes. Glob Chang Biol 24:944–956. doi: 10.1111/gcb.13934
Malik AA, Chowdhury S, Schlager V, Oliver A, Puissant J, Vazquez PGM, Jehmlich N, von Bergen M, Griffiths RI, Gleixner G (2016) Soil fungal: bacterial ratios are linked to altered carbon cycling. Front Microbiol 7:1–11. doi: 10.3389/fmicb.2016.01247
Manzoni S, Trofymow JA, Jackson RB, Porporato A (2010) Stoichiometric controls on carbon, nitrogen, and phosphorus dynamics in decomposing litter. Ecol Monogr 80:89–106. doi: 10.1890/09-0179.1
Moore TR, Bubier JL, Bledzki L (2007) Litter decomposition in temperate peatland ecosystems: The effect of substrate and site. Ecosystems 10:949–963. doi: 10.1007/s10021-007-9064-5
Palozzi JE, Lindo Z (2017) Boreal peat properties link to plant functional traits of ecosystem engineers. Plant Soil 418:277–291. doi: 10.1007/s11104-017-3291-0
Parmesan C (2007) Influences of species, latitudes and methodologies on estimates of phenological response to global warming. Glob Chang Biol 13:1806-1872.
doi:10.1111/j.1365-2486.2007.01494.x
Porazinska DL, Bardgett RD, Blaauw MB, Hunt H. William WW, Parsons AN, Seastedt TR, Wall DH (2003) Relationships at the aboveground-belowground interface: Plants, soil biota, and soil processes. Ecol Monogr 73:377–395. doi:
10.1890/0012-9615(2003)073[0377:RATAIP]2.0.CO;2
Reich PB (2014) The world-wide “fast-slow” plant economics spectrum: A traits manifesto. J Ecol 102:275–301. doi: 10.1111/1365-2745.12211
Rydin H, Jeglum JK (2nd eds) (2013) The Biology of Peatlands. Oxford University Press,
Oxford, United Kingdom
Sala OE, Oesterheld M, Chapin III FS, Walker M, Armesto JJ, Berlow E, Bloomfield J, Dirzo R, Huber-Sanwald E, Huenneke LF, Jackson RB, Kinzig A, Leemans R, Lodge DM, Mooney HA, Poff NL, Wall DH, Sykes MT, Walker BH (2000) Global
biodiversity scenarios for the year 2100. Science (80- ) 287:1770–1774. doi: 10.1126/science.287.5459.1770
Six J, Frey SD, Thiet RK, Batten KM (2006) Bacterial and fungal contributions to carbon sequestration in agroecosystems. Soil Sci Soc Am J 70:555–569. doi:
10.2136/sssaj2004.0347
Soares M, Rousk J (2019) Microbial growth and carbon use efficiency in soil: Links to fungal-bacterial dominance, SOC-quality and stoichiometry. Soil Biol Biochem 131:195–205. doi: 10.1016/j.soilbio.2019.01.010
Strickland MS, Lauber C, Fierer N, Bradford MA (2009) Testing the functional significance of microbial community composition. Ecology 90:441–51
Strickland MS, Rousk J (2010) Considering fungal: bacterial dominance in soils -
Methods, controls, and ecosystem implications. Soil Biol Biochem 42:1385–1395. doi: 10.1016/j.soilbio.2010.05.007
Tarnocai C, Kettles IM, Lacelle B (2011) Peatlands of Canada; Geological Survey of Canada, Open File 6561 (digital database); CD-ROM
Turetsky MR, Crow SE, Evans RJ, Vitt DH, Wieder RK (2008) Trade-offs in resource allocation among moss species control decomposition in boreal peatlands. J Ecol 96:1297–1305. doi: 10.1111/j.1365-2745.2008.01438.x
Van Der Heijden MGA, Bardgett RD, Van Straalen NM (2008) The unseen majority: Soil microbes as drivers of plant diversity and productivity in terrestrial ecosystems. Ecol Lett 11: 296–310. doi: 10.1111/j.1461-0248.2008.01199.x
occur ? Biogeochemistry 13:87–115.
Waldrop MP, Firestone MK (2004) Microbial community utilization of recalcitrant and simple carbon compounds: Impact of oak-woodland plant communities. Oecologia 138:275–284. doi: 10.1007/s00442-003-1419-9
Wardle DA, Bardgett RD, Klironomos JN, Setala H, van der Putten WH, Wall DH (2004) Ecological linkages between aboveground and belowground biota. Science 304:1629–1633.
Waring BG, Averill C, Hawkes C V. (2013) Differences in fungal and bacterial physiology alter soil carbon and nitrogen cycling: Insights from meta-analysis and theoretical models. Ecol Lett 16:887–894. doi: 10.1111/ele.12125
Walther GR (2010) Community and ecosystem responses to recent climate change. Philos Trans R Soc B Biol Sci 365:2019–2024. doi: 10.1098/rstb.2010.0021
Walther GR, Post E, Convey P, Menzel A, Parmesan C, Beebee TJ, Formentin J-M, Hoegh-Guldberg O, Bairlein F (2002) Ecological responses to recent climate change. Nature 416:389–395.
Weltzin JF, Bridgham SD, Pastor J, Chen J, Harth C (2003) Potential effects of warming and drying on peatland plant community composition. Glob Chang Biol 9:141–151. doi: 10.1046/j.1365-2486.2003.00571.x
Weltzin JF, Pastor J, Harth C, Bridgham SD, Updegraff K, Chapin CT (2000) Response of bog and fen plant communities to warming and water-table manipulations. Ecology 81:3464–3478. doi: 10.1088/0305-4470/38/37/005
Westoby M, Wright IJ (2006) Land-plant ecology on the basis of functional traits. Trends Ecol Evol 21:261–268. doi: 10.1016/j.tree.2006.02.004
Whitehouse HE, Bayley SE (2005) Vegetation patterns and biodiversity of peatland plant communities surrounding mid-boreal wetland ponds in Alberta, Canada. Can J Bot 83:621–637. doi: 10.1139/b05-034
Wright IJ, Reich PB, Westoby M, Ackerly DD, Baruch Z, Bongers F, Cavender-Bares J, Chapin T, Cornelissen JHC, Diemer M, Flexas J, Garnier E, Groom PK, Gulias J, Hikosaka K, Lamont BB, Lee T, Lee W, Lusk C, Midgley JJ, Navas M-L, Niinemets Ü, Oleksyn J, Osada N, Poorter H, Poot P, Prior L, Pyankov VI, Roumet C, Thomas SC, Tjoelker MG, Veneklaas EJ, Villar R (2004) The worldwide leaf economics spectrum. Nature 428:821–827. doi: 10.1038/nature02403
Zhang X, Flato G, Kirchmeier-Young M, Vincent L, Wan H, Wang X, Rong R, Fyfe J, Li G, Kharin VV (2019) Changes in temperature and precipitation across Canada;
Chapter 2
2
Above- and belowground community linkages in boreal
peatlands
2.1 Introduction
Traditionally, the aboveground (plant) and belowground (soil) communities have been studied in isolation from one another, yet a greater appreciation of the interconnectivity between the two has emerged over the last three decades (Schnitzer et al. 2011; Bardgett and van der Putten 2014). The plant community (i.e. producers) provides resources to the belowground consumers (i.e. decomposers), but decomposition processes also release important nutrients that are key resources to their aboveground counterparts, creating a flow of nutrients and energy between the two subsystems. Aboveground plants provide organic carbon to the belowground consumers via plant litter (Hättenschwiler et al. 2005), and belowground, plants provide important resources to root-associated organisms (i.e. the rhizosphere) (Porazinska et al. 2003; Brzostek et al. 2013). While belowground food webs are considered ‘donor-controlled’, suggesting limited or no ability of the soil community to regulate or feedback to aboveground plant communities (Van Der Heijden et al. 2008), plant communities are often associated with certain microbial communities. Recent perspectives suggest that above- and belowground communities are more tightly linked than previously thought (Porazinska et al. 2003; Eisenhauer 2012), and that both the above- and belowground community composition influence one another (Carlson et al. 2010; Shanmugam and Kingery 2018). However, the extent to which these above- and belowground pairings are causal (and bidirectional), or correlational (i.e. both plant and microbial communities are associated with resource gradients, independently) is under debate (Carlson et al. 2010; Orwin et al. 2010; Fan et al. 2015; Li et al. 2015).
There are various ways for plant species to acquire and allocate resources, presenting a long-standing trade-off paradigm in life history strategies (Grime 1977; Wright et al. 2004; Westoby and Wright 2006). Plant species are described to exist along a continuum of fast-growing, nutrient exploitative life history traits vs slow-growing, nutrient
aboveground herbivores) and litter quality for belowground decomposers (Grime 1977; Reich 2014). Litter is thus often described as either ‘labile’ or ‘recalcitrant’, where faster growing plants produce labile litter that is more nutrient (mainly nitrogen (N)) rich, contains simpler carbon (C) compounds, and has lower C:N. Labile litter is considered to be high quality litter, facilitating faster decomposition and nutrient cycling (Manzoni et al. 2010) because the C compounds are easier to decompose, and N is often the main limiting nutrient in terrestrial systems (Vitousek and Howarth 1991). Plants that are slow growing, are typically conservative in their nutrient acquisition, are typically more heavily defended with structural compounds and secondary metabolites, and
consequently produce more recalcitrant litter (low N, complex C compounds, higher C:N) and lower litter quality that leads to slower decomposition and nutrient cycling (Reich 2014). As soil microbial communities mineralize organic N from plant litter and make it bio-available for plant uptake, it can be hypothesized that microbial communities that have life history traits requiring more N will be paired with aboveground plant communities that have higher litter quality, more labile (low C:N), and vice versa.
Above- and belowground communities are particularly linked in peatlands because the whole soil profile is comprised of partially decomposed plant matter (peat) that largely dictates the nutrients available to the belowground microbial communities.
Decomposition rates in peatlands are lower than the aboveground plant biomass
production due to water saturation and often low temperatures (in boreal zones) such that aboveground plant C inputs are net sequestered in the soil as a build-up of peat. However, not all peatlands are equal in terms of decomposition rates, which depends on
hydrological regimes, nutrient inputs from ground water, and aboveground plant
community composition. Peatlands exist on a continuum of hydrological connectivity and nutrient inputs (e.g. bogs, nutrient poor fens to nutrient rich fens). This continuum is related to vegetation: bogs and nutrient-poor fens are typically dominated by Sphagnum
litter (low N, and high phenolics that mask cellulose and make tissue more resistant to microbial breakdown) compared to Carex spp. sedges, and therefore Sphagnum spp. peatlands are predicted to have slower nutrient cycling and differences in soil properties (Turetsky et al. 2008; Palozzi and Lindo 2017b).
Belowground, the microbial community also exists along a ‘fast-slow’ life history continuum. Peatland microbial communities contain high diversity of fungi
(Asemaninejad et al. 2017) and bacteria, and less significantly archaea (Asemaninejad et al. 2019) where fungal and bacterial microorganisms are typically considered different functional groups because they differ in cell biomass and life history traits that leads to differences in decomposition dynamics. While both fungi and bacteria have the ability to use high quality, labile C substrates (Waldrop and Firestone 2004; de Vries and Caruso 2016), bacteria tend to outcompete fungi in this environment while the opposite is true under low quality, recalcitrant C, where fungi outcompete bacteria (Strickland et al. 2009b, a). As such, fungi are sometimes considered ‘slow’ C and nutrient cyclers that immobilize nutrients within long-lived biomass, while bacteria are considered ‘fast’ cyclers with nutrients turning over and being mineralized through bacterial cell metabolism and death (Joergensen and Wichern 2008; Strickland and Rousk 2010). Bacterial communities can be further classified as either Gram+ or Gram- bacteria and rather than differing across the ‘fast-slow’ dichotomy these groups differ in their
preferred C source: Gram+ bacteria prefer soil organic matter derived C (i.e. microbially processed) and Gram- bacteria prefer plant derived C (Kramer and Gleixner 2008; Fanin et al. 2019). This ‘fast-slow’ dichotomy of both aboveground plants and belowground microbial communities has consequences for C sequestration and C release (dissolved organic C and CO2) in peatland soils. Given predicted peatland plant shifts (Jassey et al.
2013; Dieleman et al. 2015; Bragazza et al. 2016) and increases in decomposition rates under climate change (Bond-Lamberty et al. 2018; Jenkinson et al. 1991), understanding plant-soil microbial interactions is of growing importance.
Whether differences in microbial communities that stem from differences in aboveground plant community properties (e.g. plant litter quality) feedback to affect the plant
et al. 2008). Differences in the abundance of fungi and bacteria is thought to lead to different rates of C and nutrient cycling that can affect plant community composition. In this study, I characterize the aboveground plant community and the belowground
microbial community in two boreal peatlands: an intermediate nutrient fen that is dominated by Carex spp. sedges and a nutrient-poor fen dominated by Sphagnum spp. mosses. I characterize the aboveground plant communities through species level
morphological identification, and I identify microbial groups based on phospholipid fatty acids (PLFA) biomarkers extracted from the peat. My objective is to relate the above- and belowground communities by examining 1) the nutrient quality of the aboveground plant community, 2) the quality of the annual plant litter inputs to the belowground system, and 3) the quality of the peat in which the microbial communities reside. As
Sphagnum has conservative nutrient-use strategies, in the Sphagnum-dominated fen, I predict lower litter quality and subsequently a smaller and more fungal dominated microbial community compared to the Carex-dominated fen with more nutrient
exploitative traits that would produce higher litter quality and support a larger and more bacterial dominated microbial community.
2.2 Materials & Methods
2.2.1
Site description
The two fen sites chosen for this study are located near White River, Ontario (48°21’N,
84°20’W) and are a part of a larger boreal peatland complex that has been monitored as long-term research sites by the Ontario Ministry of Natural Resources and Forestry for the past 15 years. The mean annual precipitation is 980 mm and the mean annual temperature is 2.1°C for the region (see Webster and McLaughlin (2010) for full description). The two fens are approximately 2 km apart. One fen is dominated by
Sphagnum spp. mosses and has a nutrient poor status while the other fen is dominated by
The SF, as the name suggests, has a blanket of Sphagnum mosses (S. magellanicum Brid.,
S. angustofolium (C.E.P. Jensen ex Russow) C.E.O Jensen, S. fuscum (Schimp.) Klinggr., and S. girgensohnii (Russow)), is moderately covered by shrubs including Labrador tea (Rhododendron groenlandicum Oeder), leatherleaf (Chamaedephne calyculata (L.) Moench), and lowbush blueberry (Vaccinium angustifolium Aiton), and is sparsely treed by black spruce (Picea mariana (Mill.) B.S.P.) and tamarack (Larix laricina (Du Roi) K. Koch). Carex spp. predominate the CF vegetation where C. stricta Lam. grows in patches semi-isolated from C. oligosperma Michx., and C. lasciocarpa. Shrubs, leatherleaf and
Myrica gale L. (sweet gale) in lesser amounts also inhabit the CF and Sphagnum mosses occur in sparse patches (See Palozzi and Lindo (2017a) for previous plant community description).
2.2.2
Aboveground plant sampling
The aboveground plant community was assessed in 0.25m2 plots (n=12) from each fen
during June, July, and August 2018, totaling 72 plots. Within each haphazardly chosen plot, all aboveground plant biomass was destructively sampled by clipping at the root-shoot interface, sorted by species using the keys of Newmaster et al. (1997), and were dried at 60°C for a minimum of 48 hrs. To determine Sphagnum spp. biomass, 5 cm2 of
Sphagnum carpet was collected and the photosynthetic shoots were retained as the sample, the biomass was then dried and multiplied by 25 to determine an estimate of
Sphagnum biomass for each plot — the section collected was determined to be the best representation of the plot, in terms of species and density. I calculated plant richness, Shannon’s diversity index (𝐻"), and Pielou’s evenness (𝐽") based on the aboveground
biomass calculated from each plot using the vegan package in R (Oksanen et al. 2018), where:
𝐻" = −'𝑝
)ln (𝑝)) .
)/0
In these equations, pi is the proportional aboveground biomass based on destructive sampling of each plant species and S is species richness.
The aboveground plant quality (i.e. %C and %N content, C:N) was assessed by collecting leaves from each species (photosynthetic shoots for moss species, based on
Bond-Lamberty and Gower (2007)) from three randomly selected plots across all time points (Appendix A). Leaves and shoots for each species were ground using a stainless steel blade grinder, and homogenized within each plot. Some rare species that had low
biomass were therefore only sampled from one plot. Leaves were analyzed for %C, %N, and C:N using a combustion analyzer (vario MAX cube Elementar CNS analyzer) with birch leaf (Betula papyrifera Marsh.) as the quality control.
The community weighted mean (CWM) for each plant quality trait (i.e. %C, %N, C:N) was calculated for each of the 72 plots using the equation:
𝐶𝑊𝑀678)6 = '(𝑝) × 𝑥))
where pi is again the proportional aboveground biomass based on destructive sampling of each plant species, while xi is the trait value for that particular species. The CWM takes into account both the quality (%C, %N, C:N) of each plant species and the biomass of each plant species to determine one quality (%C, %N, C:N) for the entire community.
2.2.3
Plant litter and peat sampling
Litter traps were deployed haphazardly at each fen to determine both quantity and quality of seasonal litter inputs to the soil system. Litter traps were constructed with a black mesh (1 mm) bottom, allowing moisture, but not plant litter to filter through. At each fen, five 0.25 m2 litter traps were deployed in August 2017, with litter collection in October 2017
Five surficial peat samples (top 5-10 cm, approximately 100 g) were collected
haphazardly from each fen in October 2017. A subsample of peat (15 g wet weight) was used to measure the moisture content gravimetrically. The peat was dried at 60°C for one week and re-weighed after drying. The soil moisture content was calculated using the formula:
% Moisture = ((g wet weight – g dry weight) / g dry weight) × 100.
Heterotrophic basal respiration was used to estimate microbial activity and was measured using a Licor Infrared Gas Analyzer (IRGA LI-8100A) and Multiplexer unit (LI-8150). A 50 g wet weight subsample of peat was placed in 250 ml mason jars (n=5 from each peatland site) and aluminum foil was wrapped around each jar to ensure only
heterotrophic basal respiration was measured. Respiration was measured over 12 hours at room temperature; measurements for each sample were averaged over 90 seconds for 30 minutes, with a 30 second purge of the headspace between measurements. Peat from each sample was ground and analyzed for %C, %N, and C:N using a combustion autoanalyzer (vario MAX cube Elementar C:N) as previously described, and all remaining subsamples of peat were frozen at -80°C and lyophilized for determination of the microbial
community composition.
2.2.4
Phospholipid fatty acid analysis
sample prior to PLFA extraction and subsequently used to calculate extraction efficacy. Samples were subsequently vortexed for 30 s, shaken for 2 h, and centrifuged for 1 h at 2500 rpm. The supernatant was removed and the Bligh and Dyer extractant procedure was repeated again on the peat samples to ensure thorough PLFA extraction. Chloroform (i.e. 1.8 ml for CF and 4.2 ml for SF) and citrate buffer (i.e. 0.72 ml for CF and 1.68 ml for SF) was added to the supernatant, and the samples were left for 12 h to separate.
Following separation, the upper aqueous layer was disposed of, and the lower organic phase was evaporated under N2 gas in a hot water bath to accelerate evaporation and
prevent oxidation. Samples were re-dissolved in 2 ml chloroform and PLFAs were separated from other fatty acids using a solid phase extraction column (50 mg silica gel SPE 96-well plate). Columns were conditioned with 1 ml methanol and 1 ml chloroform and the phospholipids were eluded with 0.5 ml of 5:5:1 methanol:chloroform:deionized water. The samples were again evaporated under N2.
Methyl-esters were added to the PLFAs using 0.5:0.5:1 methanol:chloroform:methanolic potassium hydroxide. Samples were incubated for 15 minutes at 37°C, cooled to room temperature, and 0.6 ml of hexane and 0.2 ml of chloroform were added to each sample. Samples were neutralized with 0.5 ml 1M acetic acid, 0.8 ml deionized water was added, and samples were vortexed prior to being centrifuged at 2000 rpm for 5 minutes. The upper hexane layer was removed, and the extraction process was repeated with the lower layer (0.6 ml of hexane and 0.2 ml of chloroform). The upper hexane layer from the second extraction was added to the first and the organic phases were evaporated under N2. All samples were subsequently re-dissolved in hexane and the fatty acid methyl esters
2.2.5
Statistical analysis
Plant species richness, Shannon’s diversity and Pielou’s evenness were analyzed using a two-way ANOVA implemented in R (version 3.4.3) using the vegan package (Oksanen et al. 2018) — because each plot was destructively sampled, all plots are considered
independent, so I used fen and month as the main effects. Aboveground plant quality was analyzed using two-way MANOVA implemented in R to determine differences between the CWM of %C, %N, and C:N for the SF and CF aboveground biomass, with fen and month as the main effects. Litter quantity was analyzed using a two-way repeated measures ANOVA and litter quality (%C, %N, and C:N) was analyzed using two-way repeated measures MANOVA in Statistica (version 7.0) with fen and time period (i.e. end of growing season, winter, and growing season) as the main effects (StatSoft. Inc., 2004). To determine if each individual dependent litter quality variable (%C, %N, and C:N) varied between sites, separate two-way repeated measures ANOVA were run. A one-way MANOVA was used to analyze peat quality (%C, %N, and C:N) with fen type as the main effect.
The MIDI software separated the PLFA microbial biomass into six microbial groups: arbuscular mycorrhiza fungi (AM fungi), fungi (all other fungi besides AM fungi), anaerobic bacteria, gram positive bacteria (Gram+), gram negative bacteria (Gram-), and actinomycetes. Actinomycetes, was not included in the analysis as the duplicate
demonstrated >70% variation. The total biomass and biomass of each microbial group was analyzed using a one-way MANOVA with fen type as the main effect (version 3.4.3; R Development Core Team). I also calculated the overall fungal:bacterial (F:B) ratio and Gram+:Gram- ratio for each sample, and these were also included in the one-way
MANOVA. I analyzed PLFA richness, diversity and evenness using a one-way ANOVA with fen as the main effect.
community dissimilarity), and the communities are plotted as points in non-metric multidimensional space with more dissimilar communities plotted farther away from one another in ordination space. Dissimilarities in composition between communities were examined for statistically significant differences between fen sites by comparing the distribution of dissimilarities using 1000 permutations. For the belowground microbial community any PLFA that contributed to less than 1% of the biomass across the five replicates was not included in the analysis. The adonis function in the vegan package in R (Oksanen et al. 2018) was used for the PERMANOVA and NMDS visualization. Finally, a Principal Components Analysis (PCA) using vegan was performed on the belowground microbial community composition based on PLFA percentages (Oksanen et al. 2018). Site scores from the PCA were extracted for the 2 main axes and linear regressions that included all environmental variables (soil moisture, basal respiration, %C, %N, C:N of the peat) were used as explanatory variables to determine which environmental variables were associated with particular PLFAs.
2.3 Results
2.3.1
Aboveground plants and litter
The SF demonstrated nearly 2´ greater aboveground plant richness than the CF (F(1,70)=0.257.2, P<0.001) (Fig. 2.1), and also had significantly greater Shannon’s
diversity index but lower Pielou’s evenness (Table 2.1). There were no significant differences among monthly sampling times for plant survey data (richness: F(2,70)=0.065,
P=0.938, diversity: F(2,70)=0.485, P=0.618, evenness: F(2,70)=0.549, P=0.580), and any
difference between fen types was not affected by sampling time (i.e. interactive effects) (richness: F(2,70)=2.775, P=0.069, diversity: F(2,70)=0.944, P=0.394, evenness:
F(2,70)=0.051, P=0.950) although plant species richness was lowest during July in the SF
Table 2.1 Plant variables measured at two peatland sites in northern Ontario, Canada. Values are means ± standard error (n=12). F & P values correspond to the main effect of fen corresponding to two-way ANOVAs for Shannon’s diversity and Pielou’s evenness and two-way MANOVAs for %C, %N, and C:N.
Sphagnum-dominated fen
Carex-dominated fen F(1,70) P Plant Shannon’s diversity 1.46 ± 0.04 1.22 ± 0.04 17.07 <0.001
Plant Pielou’s evenness 0.63 ± 0.02 0.73 ± 0.02 15.46 <0.001
Plant CWM C content (%) 47.89 ± 0.19 49.34 ± 0.21 27.78 <0.001
Plant CWM N content (%) 1.18 ± 0.02 1.60 ± 0.04 109.94 <0.001
When considering the aboveground plant community, I found significant differences between the two fens (PERMANOVA: F(1,71)=47.945, P=<0.001) (Fig. 2.2), as well as
shifts in the aboveground plant community across the three sampling times (F(2,71)=2.773,
P=0.005). This shift in plant community during the growing season was more pronounced in the CF, leading also to a significant fen by month interaction effect
(F(1,71)=3.293, P=0.004) (Fig. 2.3). The CWM for %C and %N of fresh plant material was
significantly greater in the CF compared to the SF, however the fresh plant quality did not change across the three sampling months (Table 2.1), leading to a C:N in the SF compared to the CF (Table 2.1). The mosses including Sphagnum species and Pleurozium schreberi (Brid.) Mitt. had low %N, driving the high C:N ratio in SF, while the abundant
Myricagale and lesser abundant Salix pedicellaris Pursh. had relatively high %N, driving the low C:N in the CF (See Appendix A for full list of species and their C and N fresh litter values).
There was no difference in litter biomass between the two fens (fen main effect: F(1,16)=0.297, P=0.601), however there was variation in litter biomass across the three
sampling periods (time main effect: F(2,16)=4.79, P=0.023) which was mainly driven by
the CF where the highest litter biomass was collected after the growing season and the lowest biomass collected after the winter (Fig. 2.4) (fen ´ time interaction: F(2,16)=6.548,
P=0.008). The overall repeated measures MANOVA model was significant for litter quality (%C, %N, C:N) across fens (F(1,16)=427.7, P<0.001) and time (F(2,16)=6.6,
P=0.024), while there was also a fen ´ time interaction (F(2,16)=16.3, P=0.002). Litter
quality (i.e. C:N) was lowest in SF litter collected at the end of the first growing season
where C:N values were the highest of all litter collected (fen ´ time interaction:
F(2,16)=13.12, P<0.001), yet the SF litter had consistently higher C:N values compared to
the CF (fen main effect: F(1,8)=379.60, P<0.001) (Fig. 2.4). The C:N values of the litter
were related to changes in both %C and %N across sampling times (%C time ´ fen
interaction: F(2,16)=19.10, P<0.001, %N time ´ fen interaction: F(2,16)=18.43, P<0.001).
Oct) (Fig. 2.4), and low values of %C were observed during the winter accumulated litter (Oct – June) in the CF (Fig. 2.4). Litter %C was consistently greater (%C fen main effect: F(1,8)=49.13, P<0.001, %C time main effect: F(2,16)=54.69, P<0.001) and %N consistently
lower (%N fen main effect: F(1,8)=308.37, P<0.001, %N time main effect: F(2,16)=29.19,
Figure 2.2 Compositional similarities of A) aboveground plant communities (n=36) and B) belowground microbial communities (n=5). Aboveground plant communities are based on aboveground biomass of individual plant species from 0.25m2 plots.
Figure 2.3 Compositional similarities of A) aboveground plant communities in the
Sphagnum-dominated fen (n=36) and B) aboveground plant communities in the
Carex-dominated fen (n=36) across three sampling periods in 2018: June, July, and August. Aboveground plant communities are based on aboveground biomass of individual plant species from 0.25m2 plots. Stress is 0.24 with k=2 (number of
Figure 2.4 Mean litter biomass (g/0.25 m2), %C, %N, and C:N at both the
Sphagnum-dominated and Carex-dominated fen across three sampling times: end of growing season, winter, and growing season (n=5). Letters denote significant
2.3.2
Peat quality and belowground microbial community
Belowground, the quality (i.e. %C, %N, C:N) of the peat mirrored the trends in the aboveground plant litter inputs from the litter traps and CWMs of the aboveground plant communities, where I found significantly greater %C, significantly lower %N, and significantly greater C:N (Table 2.2) in the SF compared to the CF. The peat moisture content was significantly lower in the SF compared to the CF, while basal respiration was 2´ greater (Table 2.2). There was no significant difference in PLFA richness or PLFA Shannon’s diversity between the fens, however, the SF had greater Pielou’s evenness of PLFAs compared to the CF (Table 2.2).
Overall fungal to bacterial ratios (F:B) were significantly greater in the SF compared to the CF (F(1,8)=164.93, P=<0.001)(Fig. 2.5), and all microbial groups (fungi and bacteria)
also demonstrated biomass differences between fens (Fig. 2.5). While the SF had a greater fungal biomass, this was due to fungal groups such as saprophytic fungi
(F(1,8)=47.10, P<0.001), rather than arbuscular mycorrhizal (AM) fungi, which were more
abundant in the CF (F(1,8)=51.55, P<0.001). The SF also had significantly less overall
PLFA biomass (F(1,8)=91.81, P<0.001), and less anaerobic bacteria (F(1,8)=7.28, P=0.027),
Gram+ bacteria (F(1,8)=51.62, P<0.001), and Gram- bacteria (F(1,8)=138.5, P<0.001)
biomass than the CF. However, the SF had a greater Gram+ bacteria:Gram- bacteria ratio (F(1,8)=61.91, P<0.001) compared to the CF (Fig. 2.5). Correspondingly, the belowground
Table 2.2 Peat variables measured at two peatland sites in northern Ontario, Canada (n=5). Values are means ± standard error, and statistical F & P values correspond to main effect of fen. Peat %C, %N, and C:N results are based on one-way MANOVA. Peat moisture content and basal respiration results are based on way ANOVA. PLFA univariate community indices results correspond to one-way ANOVA.
Sphagnum-dominated fen
Carex-dominated
fen F(1,8) P
Peat C content (%) 44.67 ± 0.22 40.56 ± 0.95 17.68 0.003 Peat N content (%) 0.844 ± 0.13 2.158 ± 0.05 92.43 <0.001
Peat C:N content 57.25 ± 7.30 18.81 ± 0.26 22.73 <0.001 Peat moisture content (%) 1117.28 ± 129.16 699.31 ± 46.55 9.27 0.016
Basal respiration
(gCO2/m2/h) 0.040 ± 0.004 0.088 ± 0.015 8.74 0.018