EFFECTS OF DEVOLUTION ON TECHNICAL EFFICIENCY OF HEALTHCARE SERVICES DELIVERY IN BOMET COUNTY, KENYA
KIPRONOH VICTOR SANG (BSc. HSM) Q140/CTY/PT/29063/2014
A THESIS SUBMITTED IN PARTIAL FULFILLMENT OF THE REQUIREMENTS FOR THE AWARD OF THE DEGREE OF MASTER OF
SCIENCE IN HEALTH MANAGEMENT IN THE SCHOOL OF PUBLIC HEALTH OF KENYATTA UNIVERSITY.
ii
DECLARATION
This thesis is my original work and has not been presented for the award of any degree in any other university.
Signature: …... Date... Kipronoh Victor Sang - Q140/CTY/PT/29063/2014
Department of Health Management and Informatics
SUPERVISORS
We confirm that the work reported in this thesis was carried out by the candidate under our supervision.
Signature... Date... Dr. Andre Yitambe
Department of Health Management and Informatics, Kenyatta University
Signature...Date... Dr. George Kosimbei
iii
DEDICATION
iv
ACKNOWLEDGMENT
I wish in a special way to thank my supervisors Dr. Andre Yitambe and Dr. George Kosimbei for their enormous support, audience and guidance throughout the realization of this thesis research.
Special gratitude also goes to my departmental lecturers and colleagues for their support and inputs. Gratitude also goes to Kenyatta University for the opportunity and material support in carrying out this research.
To the staff in the Ministry of Health Nairobi and Bomet County department of Health, thank you for your enormous assistance during the research process.
v
TABLE OF CONTENT
DECLARATION... ii
DEDICATION... iii
ACKNOWLEDGMENT ... iv
TABLE OF CONTENT ... v
LIST OF FIGURES ... viii
LIST OF TABLES ... ix
ACRONYMS AND ABBREVIATIONS ... x
ABSTRACT ... xii
CHAPTER ONE: INTRODUCTION ... 1
1.1 Background of the study ... 1
1.2 Statement of the Problem ... 4
1.3 Study justification ... 6
1.4 Research questions ... 7
1.5 Objectives ... 7
1.5.1 Main Objective ... 7
1.5.2 Specific objectives... 8
1.6 Conceptual model ... 8
1.7 Significance of the study ... 9
CHAPTER TWO: LITERATURE REVIEW ... 10
2.0 Introduction ... 10
2.1 Theoretical literature ... 10
2.1.1 Devolution and efficiency ... 10
2.1.2 Devolution and Recentralization ... 14
vi
2.2.1 Healthcare facilities and technical efficiency scores ... 16
2.2.2 Healthcare human resources and devolution ... 18
2.3 Summary of literary review ... 19
CHAPTER THREE: METHODOLOGY ... 21
3.1 Research design ... 21
3.2 Study variables ... 21
3.2.1 Dependent Variable ... 21
3.2.2 Independent Variables ... 21
3.3 Study location ... 21
3.4 Study Population ... 22
3.5 Sampling technique ... 22
3.6 Research instruments ... 23
3.7 Data collection techniques ... 23
3.8 Validity and reliability ... 23
3.9 Data management... 24
3.9.1 Estimation technique ... 24
3.10 Data analysis ... 26
3.11 Ethical consideration ... 27
CHAPTER FOUR: RESULTS ... 28
4.1 Technical efficiency scores ... 28
4.1.1 Pre-devolution efficiency scores ... 29
4.1.2 Post-devolution efficiency scores... 29
4.2 Returns to scale of health production ... 30
4.3 Changes in hospital and primary health facility numbers ... 30
vii
4.3.2 Primary health facility changes ... 31
4.4 Healthcare workforce ... 32
CHAPTER FIVE: DISCUSSION, CONCLUSIONS AND RECOMMENDATIONS ... 35
5.1 Discussion ... 35
5.1.1 Efficiency score changes ... 35
5.1.2 Changes in hospital and primary health facility numbers ... 37
5.1.3 Healthcare workforce numbers and composition changes ... 39
5.2 Conclusion ... 40
5.3 Recommendations ... 42
5.3.1 Policy recommendations ... 42
5.3.2 Recommendations for further research ... 43
REFERENCES ... 44
APPENDIX I: Map of Bomet County ... 49
APPENDIX II: Health Output Data ... 50
APPENDIX III: MOH Data use Approval ... 51
APPENDIX IV: NACOSTI Research Permit ... 52
APPENDIX V: Graduate School Approval ... 53
viii
LIST OF FIGURES
ix
LIST OF TABLES
Table 4.1 Efficiency score summary ... 28
Table 4.3.1 Number of hospitals in Bomet County ... 31
Table 4.3.2 Primary healthcare facilities in Bomet county ... 32
x
ACRONYMS AND ABBREVIATIONS AHSPR Annual Health Sector Performance Report
AIE Authority to Incur Expenditure ANC Antenatal Care
BPS Board of Post-Graduate Studies CRS Constant Returns to Scale DEA Data Envelopment Analysis
DHIS District Health Information Software DMUs Decision-Making Units
DRS Decreasing Returns to Scale FIF Facility Improvement Funds GDP Gross Domestic Product HSWG Health Sector Working Group
IPPD Integrated Payroll and Personnel Database IRS Increasing Returns to Scale
KHSSP Kenya Health Sector Strategic Plan KNBS Kenya National Bureau of Statistics KNH Kenyatta National Hospital
MDGs Millennium Development Goals MFL Master Facility List
MMR Maternal Mortality Ratio MOH Ministry of Health
MTRH Moi Teaching and Referral Hospital
xi OPD Out- Patient Department
SAGA’s Semi-Autonomous Government Agencies SE Scale Efficiency
xii ABSTRACT
1
CHAPTER ONE: INTRODUCTION 1.1 Background of the study
The Constitution of Kenya (2010) provides for devolution of health services, which implies that service provision and management is now primarily a function of the counties and functions of stewardship for the health policy including standards and guidelines left with the national government (KHSSP 2014-2018, 2014). Devolution is a form of decentralization that involves the transfer of authority from the central government to smaller legally constituted autonomous units. Functions and resources are assigned to both levels of government where they coordinate and not subordinate to each other (Murkomen, 2012).
Devolution has been seen by its proponents as a way of improving the access and efficiency in the delivery of services to the people since the decisions are made close to the people hence decision makers are more accountable to them (World Bank, 2012). Efficiency in healthcare provision is the relationship between a specific product of the health care system (output) and the resources used to create that product (inputs), thus involves the maximizing of output for a given set of inputs or minimizing inputs used to produce a given output (Hussey et al., 2009).
2
Semi-Autonomuos Government Agencies (SAGA’s) and policy and strategy formulation and implementation. The counties on the other hand are in charge of all county health facilities including the county referral hospitals all the way to the community units, in terms of health service provision and promotion. Ambulatory and emergency services also fall within the counties, so as public health functions.
The two levels however share the responsibilities in legislation, health financing (resource mobilization, policy and regulation), financial management, planning and budgeting, quarantine administration, disease prevention & control (policy & coordination); including surveillance, partnerships; including public and private, intergovernmental relations, procurement of health products and technologies, human resources management and development, monitoring and evaluation, health research (regulation and implementation) and health information systems. Infrastructural and process changes have been seen since the new system started operating, with differences in the change indicators in different counties according to The Annual Health Sector Performance Report (AHSPR), July 2013 – June 2014 from the Ministry of Health.
3
almost a decade before devolution was rolled out in the country.
The Health Sector Analytical Report 2013-2014 by the Ministry of Health is a more recent study which has an aspect of technical efficiency in it. The report estimates that the country average technical efficiency stands at 56.43%, a mean value of the relative technical efficiencies of the 47 counties. The analytic report is the first of its kind by the ministry of health, though it does not look into the devolution effects on this performance indicator.
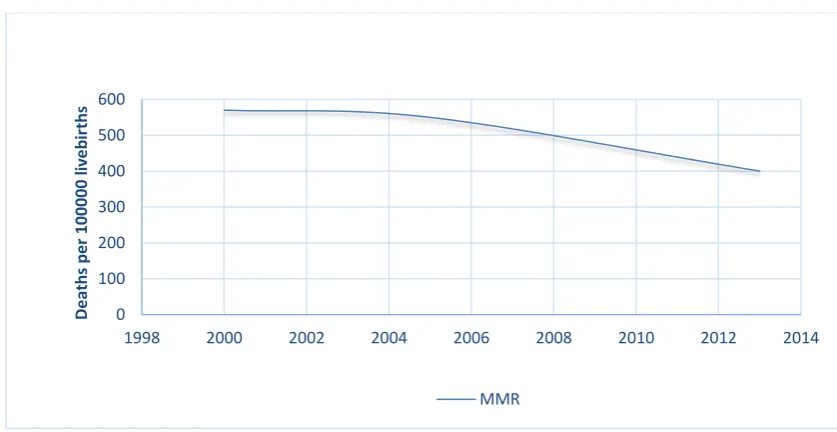
The Millennium Development Goals (MDG’s) which were central to the health sector proved a challenge to meet by most countries in sub-Saharan Africa, Kenya included. A look at goal number 5 on maternal health for example, shows that improvements were realized in reducing maternal deaths as shown in figure 1.1 below, but not by 75% as was the target.
Source: KDHS 2015
Figure 1.1: Trends in maternal mortality ratio from 2000 to 2013 0 100 200 300 400 500 600
1998 2000 2002 2004 2006 2008 2010 2012 2014
4
The World Health Organization termed the progress by Kenya in realizing the goal on maternal mortality as insufficient. This is despite the enormous resources that were dedicated to realize this goal among others when countries were committing at the 2000 millennium summit (WHO, 2014), which can point to inefficiency in their use.
The National Health Accounts (NHA) 2012/2013 (GOK, 2015) showed, in their findings, a general increase in government expenditure on health as a percentage of total government expenditure from 4.6% in 2009/10 to 6.1% in 2012/13. The Total Health Expenditure (THE) increased from Kshs 163 billion in 2009/10 to Kshs 234 billion in 2012/13. Total health spending accounted for 6.8% of GDP up from 5.4% in 2009/10. Despite these increase in health care allocations and spending, little improvements have been seen in terms of health indicators, according to Health Sector Working Group report (2012). This may imply that these resources may not have been efficiently utilized to improve on the health outcomes. Devolution came into practice at almost the closing period of the report. This study therefore came in handy to ascertain whether there are any efficiency gains after devolution in Bomet County, with analysis of the changes in the healthcare investments against the changes in the outcome indicators.
1.2 Statement of the Problem
5
There have been numerous industrial actions by the healthcare workers through their unions agitating for recentralization of the health sector. The year 2014 saw 800 doctors resign from civil service according to the Kenya Medical Practitioners and Dentists Union (KMPDU). A bill was once tabled in Kenya’s parliament that wanted the health sector to be taken back to the national government. These events denote problems in the devolved health sector that need attention.
Notably, Bomet county healthcare workers did not participate in the 2014 strikes according to the Ministry of health. The Council of Governors also in their report of 2014 placed Bomet county in second place in terms healthcare service delivery among the counties. However, the Health Sector Analysis Report (2013-2014) shows its relative efficiency as below average (43.1%). These seemingly differential results make Bomet county an area of interest.
Goals of the health sector will only be realized if the scarce healthcare resources are properly utilized to realize greater efficiencies. Obtaining and putting into best use of the scarce health resources is an essential function of the health system (WHO, 2000). Inputs into the health sector by the various counties produced different output levels with some proving much technically efficient in health provision than others (Health Sector Analysis Report 2013-2014). More calls have been made by leaders to increase the funding to the counties for improved service provision while others feel the counties are not doing enough with what they already have.
6
were on average only ploughed back to 90.4%. Requirement of some facilities to deposit FIF in a common account by county governments resulted to less or more funds than collected being re-invested for development.
In devolution literature, while the focus is on implementation of decentralization policies due to perceived benefits available in blueprints and country experiences, it is worth noting that recentralization by previously devolved countries citing efficiency as one reason to recentralize (Saltman, et.al., 2007) calls for analyses of devolved systems and their efficiency gains. While broad studies and assessments have been taken by the ministry of health to gauge the progress in attaining the health sector goals due to the health sector reforms including devolution, it proved difficult to access a specific study that has been done to ascertain how devolution affects the efficiency of health care provision in counties. This study therefore sought to fill this gap by determining the effects of devolution on healthcare efficiency in Bomet County-Kenya, through comparing the relative technical efficiencies of the county’s health system before and after devolution.
1.3 Study justification
7
The Health Sector Analysis Report (2013-2014) recommends that the health sector ought to keenly focus on efficiency improvements in how the available resources are utilized, with emphasis on counties. The recentralizing trends in previously devolved healthcare systems of the likes of Norway citing inefficiencies (Saltman et.al 2007) also call for efficiency analyses in devolving and devolved healthcare system and Kenya is no exception. Policy makers in Kenya need the information on efficiency performance as a result of devolution to inform their decisions in addressing challenges that arise on implementing devolution policies. The information currently is scant and not readily available.
1.4 Research questions
i) What are the technical efficiency levels of the county before and after devolution?
ii) What are the returns to scale of health production in Bomet county before and after devolution?
iii) What changes have occurred in the number of hospitals and functional primary care facilities in the county since devolution of health services rolled out? iv) Which changes in healthcare human resource composition and numbers have
taken place due to devolution?
1.5 Objectives
1.5.1 Main Objective
8 1.5.2 Specific objectives
This study addressed four specific objectives:
i) To determine the levels of technical efficiency changes in Bomet county before and after devolution.
ii) To determine the returns to scale of health production in Bomet county before and after devolution.
iii) To establish the change in the number of hospitals and functional primary healthcare facilities occurring after devolution.
iv) To ascertain the human resources for health numbers and composition changes that have been done since devolution took place.
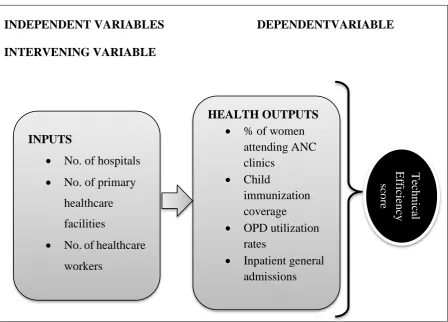
1.6 Conceptual model
9
Source: Literature review 2015, Author.
Figure 1.2 Conceptual model
1.7 Significance of the study
This study generated information that paint a picture of how implementation of devolution policies in the county’s health sector has affected its efficiency, comparing the state before devolution and two years down the line. The health managers and stakeholders can therefore use the information to make changes to improve the health sector. The findings also form a baseline in analyses in the devolved units to get the real picture of devolving health services in the country and therefore impart on the decision making regarding health sector efficiency and the changes needed in resource allocation and use to achieve optimal health production.
INDEPENDENT VARIABLES DEPENDENTVARIABLE INTERVENING VARIABLE
INPUTS
No. of hospitals No. of primary
healthcare facilities
No. of healthcare workers
HEALTH OUTPUTS % of women
attending ANC clinics
Child
immunization coverage OPD utilization
rates
10
CHAPTER TWO: LITERATURE REVIEW
2.0 Introduction
This chapter encompasses devolution and efficiency literature in two parts, the theoretical literature and the empirical literature. The concepts, experiences and reviews on decentralization of health services and the efficiency concerns are covered in the theoretical literature while empirical literature reviews the past empirical studies that have been carried out concerning devolution/decentralization of healthcare and the effects on efficiency of healthcare production. The summary of literature review will be the emerging issues and gaps as per the review.
2.1 Theoretical literature 2.1.1 Devolution and efficiency
Devolution is a form of decentralization that involves the transfer of authority from the central government to smaller legally constituted bodies. The smaller lower level units are autonomous; hence the central government has no direct control over their activities. Functions and resources are assigned to both levels of government where they coordinate and not subordinate to each other (Murkomen, 2012).
11
concept of moving health services decisions closer to the people. Health services are among the functions devolved to counties in Kenya with the national government remaining with stewardship and oversight authority as stipulated in schedule IV of Constitution of Kenya (2010).
Efficiency in healthcare provision is the relationship between a specific product of the health care system (output) and the resources used to create that product (inputs). The health system would be efficient if it was able to maximize output for a given set of inputs or to minimize inputs used to produce a given output (Hussey, et al., 2009). Allocative efficiency concerns provision of public health goods and services to the public which the benefits accrue to a larger population rather than private goods and services where benefits go to individuals (Schwartz , Guilkey and Racelis, 2002).
12
Decentralization has been advocated for in developing countries for decades by health sector reform advocates with the view as an administrative reform possible for efficiency and quality improvements, promotion of democracy and accountability to the local population (Bossert 1998). Decentralization is based on the idea that properly structured and steered smaller organizations are more agile and accountable than larger organizations (Saltman, et.al., 2007). Even Max Weber, the German sociologist famed for the bureaucratic model admitted that small scale organization is the alternative to bureaucracy (Weber, 1947). As by the proponents of decentralization, authority for control and policy making when closer to the constituents eliminate inefficiencies and lack of responsiveness that are rampant with central systems. However, critics of devolution do not trust that local governments can improve efficiency, with fears of resources used to produce private goods in place of services with greater public health benefits (Angeles, et.al., 1999).
Ideally, decentralization can improve technical efficiency if it removes excess administrative levels, if it leads to innovation and discovery of new techniques for health service delivery, or if greater oversight and accountability of health workers and planners decrease wastage of resources (Hutchinson and LaFond, 2004). Studies done on federal systems have in their findings reported that central governments have an upper hand in making equitable allocation decisions, more so for assisting the poor while devolved units more effectively utilize funds to achieve efficiency (World Bank, 1994).
13
institutions and the constituents, sources of inefficiency can be identified by the management and therefore addressed. The local people are also actively involved and therefore there is expected efficient delivery of the health services governed locally. They also brought in the idea of accountability, where the financing of public goods is the responsibility of the local beneficiaries, which increases Allocative efficiency and if properly implemented contribute to economic efficiency (Levaggi and Smith, 2003). The capacity to innovate within the counties and enhanced cost-consciousness as recognized in devolution leads to improved efficiency (Bergman, 1998). Jervis and Plowden (2003) also reported that health care strategies are better implemented under devolved systems based on need. Efficiency advantages as a result of decentralization policies also come through due to reduced risk of bottlenecks at the central level, which in turn increases the overall process capacity of the system (Saltman, et.al., 2007). Furthermore, decentralization is attributed to cost cutting and avoidance of duplication of services, especially secondary and tertiary health care. This can be done when responsibility is connected to the community within the coverage area (Mills, 1994). According to Regmi et al. (2010), decentralization improves efficiency through enhancing accountability of regional administrators and allocation efficiency basing on local needs and interests which improves governance and public service provision.
14
local conditions is also likely to be scant in centralized systems and it may involve more costs for decision makers at the central system or government to collect such information than it would have been for local decision makers. The higher information and transaction cost involved has been argued by some researchers as the need to decentralize decision making closer to the people, more so in developing countries than the developed ones (Shah, 1998).
2.1.2 Devolution and Recentralization
Despite the literature that supports the idea of devolution to improve health services efficiency, some experiences denote contradicting results. Brazil’s devolved units are the municipalities which were entitled to receive funds directly from the federal government to facilitate for all levels of care. This was through The Gestão Plena do Sistema Municipal. It incentivized municipalities to invest more in hospitals, laboratories, and high-tech equipment. These were before then under-utilized because of the municipality population sizes. There emerged new inefficiencies from the system of direct transfers to municipalities which were attributed to; loss of the economies of scale normally realized when producing most complex medical services, reduced size of risk-pool which was used to finance the advanced care; and large increases in transactional costs because of replication of administrative functions throughout the municipalities (World Bank, 2003).
15
care was regained by the central government more and more in the 15 years that followed through more regulations on the counties (Magnussen, 1998). The year 2002 the saw the recentralization of specialized care to the central government. Further, operating authority was recentralized from the 19 elected counties to the central government who appointed 6 regional boards in their place. The responsibility for financing health sector remained at national and not regional level. These actions were prompted by the experiences they had with devolved units.
The decentralized system saw hospitals in Norway agree on soft budgeting with the counties, which was eventually passed to the national government. The system therefore failed to satisfice from the efficiency perspective or that of containing the cost, failing on the main objectives of devolution for healthcare (Saltman, et.al., 2007). The devolved units also seemed to be in competition for services which resulted in service duplication therefore decreased technical efficiency (Magnussen and Mobley, 1999). The reforms, however, have not proven any better for Norway with the first two years of the reform seeming to show growing inefficiencies while effects on total cost containment uncertain.
16 2.2 Empirical literature
While many studies have been done on devolution and decentralization around the world, less attention has been given to how it affects the efficiency of service provision in particular. Strumpf, et al. (2001) studied the effects of decentralization on allocative efficiency, with reference to the provision of public and private goods in Ugandan public health sector and acknowledged the scant attention in health economics literature to efficiency issues in health goods and services provision due to devolution. Their study used the government data on resource allocations to determine their budgeting decisions regarding provision on public goods versus private health goods. Findings indicated that local governments used more resources to provide private goods in the expense of public goods. This was because local governments provide the preferences of the citizens, who choose the goods that benefit them directly. Local governments were seen to behave like individuals and therefore choose the goods and services that accrue direct benefits. Decentralization thus decreased the Allocative efficiency in these districts (Strumpf, et al., 2001).
2.2.1 Healthcare facilities and technical efficiency scores
17
Granting autonomy to hospitals can also be viewed as decentralizing or de-concentrating authority from the national government (Rondinelli, et. al., 1984). There are a few studies that have been done to measure the efficiency of the autonomous hospitals compared to the ones still under the central system. Data Envelopment Analysis (DEA) and regression analyses were used to measure technical efficiency and estimate determinants of efficiency respectively (Cellini, et. al., 2000; Giuffrida, et. al., 2000; Fabbri, 2001). The findings, which were based on technical efficiency scores, indicated difference in efficiencies due to the different organization setups. Autonomous hospitals repeatedly showed higher efficiency scores than those still integrated to the national system. This can be replicated in devolved systems since both concepts involve transfer of authority from the centralized system.
Most technical efficiency studies globally have focused on hospitals, health centers and such health set ups. This can be attributed to the growing pressure to improve hospital performance amid the scarcity of resources through proper resource allocation (WHO, 2000). Hollingsworth (2008) provided an overview of the various studies undertaken on hospital efficiency. Data Envelopment Analysis method was widely used in these studies which cover mostly the developed countries.
18
Kirigia, et al.(2002) found that 74% of public hospitals were efficient, while 44% of public health centers (Kirigia, et al., 2004) were found to be inefficient.
A pilot study in Ghana by Osei, et al. (2005) found 47% of the hospitals were technically inefficient, with an average TE score of 61%; 59% of the hospitals were scale inefficient, an average SE of 81%. Among the health centers, 18% were technically inefficient, with a mean TE score of 49%; 47% were scale inefficient, with an average SE score of 84%. Sebastian and Lemma (2010) did a study in Ethiopia (Tigray) on health extension program efficiency, and found the mean scores for technical and scale efficiency to be 0.57 and 0.95 respectively. Out of 60 health posts, 25.0% were found to be technically efficient. 63.3% were operating at their most productive scale size.
It is worth noting that among these studies on technical efficiencies, none focuses on devolution, or devolved units for that matter. They however help in pointing out the efforts to measure efficiency in the health sector in Africa.
2.2.2 Healthcare human resources and devolution
19
Kenya’s devolution however faced a lot of challenges due to the healthcare human resources being against their seconding to the county governments. Industrial actions followed with their unions leading them. The doctors and medical practitioner’s union reports showed that 800 doctors resigned from government hospitals since devolution started up to 2014. Most doctors also migrated to richer counties where private clinics can do better. This meant that other counties had to deal with the shortage of doctors thus affecting their service delivery. It is worth noting that these are mostly the counties that devolution targeted to enhance equity in service provision.
The perception of the healthcare workers on devolution also played a role in their acceptance of devolution. A study done in the University of Nairobi showed that only 36% of the medical students in their clinical years (years 3, 4 and 5) would want to work in government institutions with others preferring the private/mission or Non-Governmental organizations. 73% of them also felt that the devolution pillar of efficiency cannot be met by the county governments (Nyongesa, et.al., 2015). Experience from devolved countries however note the anticipated teething problems that are to be conquered over time.
2.3 Summary of literary review
20
support recentralization policies in efficiency improvements. Many health systems are trying to accommodate the challenges posed by devolution through limiting decentralized decisions with others creating centralized bodies to provide a minimum level of services to all citizens. The concept of decentralization therefore becomes fuzzier and difficult to assess its effects (Magnussen, et. al., 2007).
21
CHAPTER THREE: METHODOLOGY 3.1 Research design
The research design used was a cross-sectional survey. ‘Ex-ante’ and ‘ex-post’ secondary data, as is in health economics studies, from devolution periods was collected from the county’s health information platforms and subjected to econometric analysis using the Data Envelopment Analysis (DEA) to allow for comparison.
3.2 Study variables 3.2.1 Dependent Variable
This was represented by the efficiency score, which determines how best the factors of production have been combined to yield maximum results. This was derived using the DEA model.
3.2.2 Independent Variables
These were the input factors into the health system that are combined to yield the outputs, which are the number of hospitals, the number of primary care facilities and the number of healthcare human resources. Their combination ratios in the production function determines the efficiency scores. The health system- whether devolved or centralised- determines the mix of these factors to be deployed, which are the labour and capital resources.
3.3 Study location
22
has a total population of 846,012 and projected to be 891,168 by 2017, a 2.3% growth. It covers an area of 2037.4 km2. It borders Kericho county to the north, Narok county to the east and south and Nyamira county to the west. The county is largely an agricultural economy, with tea farming, dairy farming and horticulture being the leading economic activities.
3.4 Study Population
The study subjects were the five sub-counties of Bomet County as a devolved unit responsible for carrying out devolved functions, healthcare provision included. The input data captured the resources invested by the county in healthcare provision, which was collected as sub-county aggregates.
3.5 Sampling technique
The choice of Bomet county was reached purposively as a devolved unit among the 47 counties since the data from all the counties proved difficult to get given the time, finances and the reliability of the data. Notably, Bomet county healthcare workers did not participate in the 2014 strikes according to the Ministry of health. The Council of Governors also in their report of 2014 placed Bomet county in second place in terms healthcare service delivery among the counties. However, the Health Sector Analysis Report (2013-2014) shows its relative efficiency as below average (43.1%). These seemingly differential results made Bomet county an area of interest.
23
of efficiency scores to give their expert views on the subject matter, them being responsible for rolling out devolution policies in the department of health.
3.6 Research instruments
A data checklist detailing on the inputs and outputs data from the county at a period prior and after devolution was used. This is the data that was fed to the DEA model to determine the efficiency scores. A key informant interview guide was used to collect information from the county health managers regarding their views on the computed efficiency scores.
3.7 Data collection techniques
Quantitative and secondary data were collected using a data checklist from the county departments of health and the Ministry of Health information platforms. These included the District Health Information Software, the Master Facility List and the Integrated Payroll and Personnel Database. Key informant interviews were conducted after computing efficiency scores to give county health managers a chance to scrutinize the data and give their views.
3.8 Validity and reliability
24 3.9 Data management
3.9.1 Estimation technique
Data Envelopment Analysis (DEA) introduced by Charnes, Cooper and Rhodes (1978) is a non-parametric linear programming method which measures technical efficiency relative to a frontier among different Decision Making Units which are fairly homogenous. The efficient frontier or data envelop is plotted using input and output combinations from the best performing DMU. This study will use DEA to evaluate relative efficiencies among the sub-counties as DMU’s. The sub-counties along the best practice frontier are considered efficient and are assigned an efficiency score of 1 or 100%. Those sub-counties below the frontier are assigned a technical efficiency score of between 0 and 1 or 1% and 100% and are measured by their distance from the frontier. Health production involves multiple inputs and multiple outputs, therefore justifies the use of DEA by this study to estimate the technical efficiency level in the county. The individual technical efficiency of the sub-counties is defined as;
𝑇𝑒𝑐ℎ𝑛𝑖𝑐𝑎𝑙 𝑒𝑓𝑓𝑖𝑐𝑖𝑒𝑛𝑐𝑦 (𝑇𝐸) =𝑤𝑒𝑖𝑔ℎ𝑡𝑒𝑑 𝑠𝑢𝑚 𝑜𝑓 𝑜𝑢𝑡𝑝𝑢𝑡𝑠
𝑤𝑒𝑖𝑔ℎ𝑡𝑒𝑑 𝑠𝑢𝑚 𝑜𝑓 𝑖𝑛𝑝𝑢𝑡𝑠
25
Model 1: DEA model, CRS Model 2: DEA model, VRS
Eff = max ∑ 𝑢𝑟𝑦𝑟𝑗0
𝑟
𝑢𝑟 , 𝑣𝑖
s.t
∑ 𝑢𝑖 𝑟𝑦𝑟𝑗− ∑ 𝑣𝑖 𝑖𝑥𝑖𝑗 ≤ 0; ∀𝑗
∑ 𝑣𝑖 𝑖𝑥𝑖𝑗0 = 1
𝑢𝑟, 𝑣𝑖 ≥ 0; ∀𝑖, ∀𝑟.
Eff = max ∑ 𝑢𝑟𝑦𝑟𝑗0
𝑟
+ 𝑢𝑜
𝑢𝑟 , 𝑣𝑖
s.t
∑ 𝑢𝑖 𝑟𝑦𝑟𝑗− ∑ 𝑣𝑖 𝑖𝑥𝑖𝑗 + 𝑢𝑜≤ 0; ∀𝑗
∑ 𝑣𝑖 𝑖𝑥𝑖𝑗0 = 1
𝑢𝑟, 𝑣𝑖 ≥ 0; ∀𝑖, ∀𝑟.
Where
𝑦𝑟𝑗= the amount of output r produced by sub county j,
𝑥𝑖𝑗= the amount of input I used by sub county j,
𝑢𝑟 = the weight given to output r, (r=1,…,t and t is the number of outputs)
𝑣𝑖= the weight given to input i, (i=1,…,m and m is the number of inputs)
n= the number of sub counties,
j0= the sub county under assessment
26
systems do not operate at such level and therefore the varied returns to scale model. Here, the output changes are not proportional to the input changes. Where the output changes are less than proportionally to the input increase, then the health system is experiencing decreasing returns to scale (DRS) and where the output changes are more than proportionally to the input increases, there is Increasing returns to scale (IRS). Scale efficiency determines whether a system is operating at its optimal production scale or not, and is derived from dividing the CRS technical efficiency score by VRS technical efficiency score.
Scale efficiency score (SE)= CRS TE Score ÷VRS TE Score
Data Envelopment Analysis according to Osei, et. al. (2005) and Kirigia (2010) is mostly preferred in healthcare efficiency determination due to its strengths in; i) ability to compute efficiency using multiple inputs and outputs, which is common in healthcare production, ii) use of inputs and outputs without the need to functionally relate them and they can also be different units of measurement, iii) facilitating comparisons between fairly homogeneous DMU’s like counties or hospitals and iv) non-requirement of cost or price information of the inputs. However, it has limitations; i) any deviation from the efficient frontier is attributed to inefficiency while it could have been due to statistical noise, and ii) it is non-parametric, therefore difficult to carry out hypothesis testing on inefficiency.
3.10 Data analysis
27
rolling out devolution. The county mean efficiency scores for the two periods were be compared to ascertain the changes if any. Information from the key informant interviews was then used to explain the results.
3.11 Ethical consideration
28
CHAPTER FOUR: RESULTS
4.1 Technical efficiency scores
From the different input values (Tables 4.2, 4.3 & 4.4) into the county health sector in the two periods that is before and after devolution kicked off, together with the county health output values (Appendix II), technical efficiency scores of the two periods were calculated using the DEA software as explained in chapter 3.
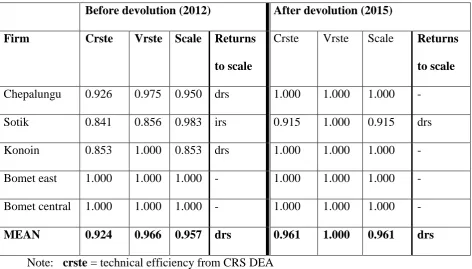
Table 4.1 shows the technical efficiency scores of Bomet county based on the data of the year 2012 before devolution and 2015 after devolution.
Table 4.1 Efficiency score summary
Before devolution (2012) After devolution (2015)
Firm Crste Vrste Scale Returns
to scale
Crste Vrste Scale Returns to scale Chepalungu 0.926 0.975 0.950 drs 1.000 1.000 1.000 -
Sotik 0.841 0.856 0.983 irs 0.915 1.000 0.915 drs Konoin 0.853 1.000 0.853 drs 1.000 1.000 1.000 - Bomet east 1.000 1.000 1.000 - 1.000 1.000 1.000 - Bomet central 1.000 1.000 1.000 - 1.000 1.000 1.000 -
MEAN 0.924 0.966 0.957 drs 0.961 1.000 0.961 drs
Note: crste = technical efficiency from CRS DEA vrste = technical efficiency from VRS DEA scale = scale efficiency = crste/vrste
29 4.1.1 Pre-devolution efficiency scores
Assuming a constant returns to scale (CRS) model, the results show that two of the five sub-counties (Bomet East & Bomet Central) which represents 40% are relatively efficient with a technical efficiency score of 1 or 100%. Of the three which were CRS relatively inefficient, Chepalungu had a technical efficiency score of 0.926, with Sotik’s score being 0.841 and that of Konoin being 0.853. This gives a county mean score of 92.4%.
However, when it came to Varied Returns to Scale (VRS) technical efficiency scores, 60% were relatively efficient with a technical efficiency score of 100%. These were Bomet East, Bomet Central and Konoin sub-counties. Chepalungu and Sotik which are relatively technically inefficient had scores of 0.975 and 0.856 relatively. The county VRS technical score mean from the above is 0.966.
4.1.2 Post-devolution efficiency scores
The post-devolution era data showed that the Constant Returns to Scale technical efficiencies in the sub-counties improved, with now 4 out of five of them being relatively efficient, that is they have an efficiency score of 100%. Only Sotik sub-county had an efficiency score of less than 1, that is 0.915, which is also an improvement from the 0.841 in the 2012 data. The mean CRSTE for the county was 0.961, up from the 0.924 from the 2012 data.
30 4.2 Returns to scale of health production
Table 4.1 gives the scale efficiency scores of the sub-counties in the two periods under study. Scale efficiency scores showed that before devolution, two of the five sub-counties, that is Bomet East and Bomet Central operated at optimum production levels with a score of 1. The other three sub-counties which were regarded as scale inefficient had scale efficiency scores of 0.950 (Chepalungu), 0.983 (Sotik) and 0.853 (Konoin). Chepalungu and Konoin sub-counties depicted diminishing returns to scale while Sotik showed increasing returns to scale. Bomet county mean scale efficiency at 2012 was 0.957, showing diminishing returns to scale.
The scale efficiency scores show that in 2015 (after devolution), 4 out of 5 of the sub-counties were operating in optimal production levels with a scale efficiency of 100%, with only Sotik having a scale efficiency score of less than 1, which is 0.915, thus deemed scale inefficient with diminishing returns to scale. The mean scale efficiency score for the county is 0.961 from the 0.957 in the 2012 data, still showing diminishing returns to scale.
4.3 Changes in hospital and primary health facility numbers
Hospitals in the county are the third tier in the decentralized system grading of healthcare, which comprise of the county and sub-county referral hospitals, previously the level 4 and level 5 hospitals. Table 4.3.1 shows the number of hospitals in Bomet county before devolution (2012) and after devolution (2015).
4.3.1: Change in hospital numbers
31
Table 4.3.1 Number of hospitals in Bomet County
SUB-COUNTIES
NO. OF HOSPITALS
Before devolution (2012) After devolution (2015)
Bomet Central 1 2
Bomet East 1 2
Chepalungu 0 1
Konoin 0 1
Sotik 1 2
COUNTY TOTALS 3 8
The county data reports of the year 2012 before devolved governments came into operation shows the number of hospitals in the county were only 3, with 2 being private mission. However, in the reporting period of 2015 two years into devolution, the number of hospitals has increased to 8, an addition of 5 more hospitals, one in each of the county’s five sub-counties. These are the sub-county referral hospitals which provide more comprehensive curative services to the referrals from the sub-county health facilities.
4.3.2 Primary health facility changes
32
Table 4.3.2 Primary healthcare facilities in Bomet county
SUB-COUNTIES NO. PRIMARY CARE FACILITIES
Before devolution (2012) After devolution (2015)
Bomet Central 19 23
Bomet East 15 19
Chepalungu 26 32
Konoin 22 25
Sotik 27 33
COUNTY TOTALS 109 132
The primary healthcare facilities, which cover the two lowest tiers of facilities increased in number from the 109 that were in operation from the reports of the year 2012 to 132 functional primary health facilities as per the 2015 facility reports, representing a 21.1% increase. An average of additional four facilities were established or operationalized within each of the five sub-counties after devolution, with a bulk of these being the dispensaries.
4.4 Healthcare workforce
The table 4.4 shows the human resource compositions of the health sector in Bomet County in terms of numbers of the different designations in the two different devolution periods under study.
33 Table 4.4 Human resource composition
Designation YR: 2012 YR: 2015
Health Records & Information Mgt. Officers 11 17
Pharmacist 3 4
Physiotherapist 5 6
Community Oral Health 4 5
Medical Directors 1 4
Public Health Officers 76 132
Occupational Therapist 1 5
BSNs 1 7
General nurses 292 564
Chief Radiographer 2 4
Clinical Officers 70 96
Community health extension worker 2 4
Family Physician 0 1
General Surgeon 0 1
OBGYN 0 1
Med Lab 40 66
Medical Engineers 7 17
Medical Officers 7 21
Medical Social Workers 2 4
Nutrition & Dietetics 10 38
Orthopaedic technologists 1 2
Paediatrician 0 1
Pharm Techs 15 27
Renal Nurses 0 3
Clinical Officer (Anaesthetist) 2 3
Senior Dental Technologist 1 2
34
The number of medical specialists also increased, some who were not there at all. The renal nurses were 3 as by 2015 but were not there at 2012. A general surgeon, a family physician, a paediatrician and a gynaecologist were also employed (1 each) by 2015. The county employed an additional 14 medical officers from the 7 captured in the 2012 data to the 21 that are in the data of the reporting year 2015. There was only one medical director in 2012 and in 2015 they were four.
From the reports of 2012 before devolution officially started to reports of 2015 when devolution was ongoing, the number of occupational therapists increased from 1 to 5, with chief radiographers increasing from 2 to 4. An additional 26 clinical officers were employed bringing the number to 96 from 70. From the 76 public health officers that were there in 2012, 56 more were added to make the totals in the county to 132.
35
CHAPTER FIVE: DISCUSSION, CONCLUSIONS AND RECOMMENDATIONS
5.1 Discussion
5.1.1 Efficiency score changes
The CRS model of DEA shows that the county as per the 2012 data (pre-devolution) has a mean technical efficiency score of 92.4 % with 40% of the sub-counties being technically efficient, a technical efficiency score of 100%. The 60% inefficient sub-counties had a mean technical efficiency score of 87.3%, meaning that they could attain efficiency by minimizing their input ratios by 12.3% on average.
The VRS model on the same data of 2012 before devolution gives the mean technical efficiency scores of the county to be 96.6%. Here, 60% of the sub-counties are seen as technically efficient, a score of 100%. The 2 sub-counties which are inefficient have an average TE score of 91.6%, thus to attain the efficiency gradient, these sub-counties ought to slash their input ratios by 8.4%.
The pre-devolution results also showed that 2 out of the 5 sub-counties were operating optimally while 60% showed diminishing returns to scale, meaning an increase in the production inputs results in a decrease in the health outputs. The average scale efficiency score for these sub-counties is 92.87%, meaning they should scale down their productions by an average of 7.13%. These results concur with a research done in South Africa (Kirigia et al 2000;2001) which reported that to realize efficiency, the hospitals and clinics needed to reduce its inputs substantively.
36
hospitals in Kenya was found to be 97.72%. The difference can however be explained by the inclusion of lower tier health facilities in this study, where the lower tiers are seen as more inefficient than the level four hospitals. This can be supported in the researches in Kenya which found out that 26% of public hospitals were inefficient (Kirigia, et al., 2002) while 44% of public health centers were found to be inefficient (Kirigia, et al., 2004).
The technical efficiency scores calculated using the data from post-devolution period (2015) show some bit of improvements in the technical efficiency scores. Assuming a CRS model, the county’s mean technical efficiency score was 96.1%, with the ratio of efficient sub-counties being 80%. This is an increase from the pre-devolution scores where only 40% of the sub-counties were technically efficient. The mean T.E score of the county also increased by 3.7%.
VRS DEA results from the post-devolution period shows that all the sub-counties are technically efficient, all score 100%. This is an improvement from the pre-devolution’s mean technical efficiency score of 96.6% where only 60% of the sub-counties were technically efficient. The TE score post-devolution increased by 3.4 %. This is in tandem with studies which showed that devolved units better utilize their resources to achieve efficiency (World Bank 1994; Saltman et al 2007).
37
scale. The Sub-county medical officer of health in Sotik attributed this to the number of facilities being more and the health outputs being largely a shared value in the county.
All these efficiency scores show improvements from the pre-devolution era to the post-devolution era. These results are related to the findings by various studies (Cellini, et. al., 2000; Giuffrida, et. al., 2000; Fabbri, 2001) which found out that autonomous hospitals repeatedly showed higher efficiency scores than those still integrated to the national system. The autonomy in these hospitals is a concept that can be equated to the devolved healthcare in this study.
5.1.2 Changes in hospital and primary health facility numbers
The county government records showed an increase in the number of hospitals in the county by 5, bringing the total number to 8. The hospitals, which are the third tier in the devolved structure, offer a greater range of services and act as referral points to the lower tier facilities. According to the county executive committee member (CECM) for health, there was need to upgrade a facility in every sub-county to offer the services to the residents in those devolved units and to ease the congestion in the county referral hospital, sentiments echoed by the sub-county medical officers of health (SCMOHs). The upgrade came with improved range of services, increased staff and availability of specialized services in the sub-counties. This is the essence of devolving healthcare where access and coverage of most of the healthcare services is increased, bringing them closer to the population as it was in Brazil’s devolved system (World Bank, 2003).
38
the community health extension workers (CHEWs) and are responsible for identifying the health needs and situation in the communities. Critics of devolution point out devolution’s neglect of the public goods (Strumpf, et. al., 2001), but through creation of the community health units and continued involvement of the CHEWs, health as a public good has been prioritized right from the lowest point of community welfare and not merely on disease treatments. The population therefore in this devolved system is greatly involved in their health affairs (Regmi et al., 2010).
From the community units, residents are referred to the dispensaries for mild ailments, or further referred to the health centers which offer more comprehensive services. According to the county director of medical services, more of these primary healthcare facilities improve the health seeking behavior in the communities, therefore justifying the county government’s investment in more of these units. County data reports from the year 2012 before devolution of healthcare officially rolled out shows that the county had 13 health centers and 96 dispensaries, making a total of 109 primary health facilities.
39
5.1.3 Healthcare workforce numbers and composition changes
In 2012, before devolution was rolled out, Bomet County had a total of 553 health workers spread across the county. This however increased to 1035 by the year 2015. The county records show not only an increase in the number of health workers but also introduction of new specialists and increase in number in the existing ones. Devolving healthcare, according to World Bank means that a county health system should be self-sufficient to a larger percentage; therefore, it should offer specialized services as much as it can, with high-end equipment and also specialist medical staff to offer the services (World Bank, 2003). It is in this regard therefore that the county director of medical services emphasized on the need for improvement in the healthcare workforce, both in numbers and skills to offer timely and specialized care.
The general nurses, the biggest cadre of health workers increased from 292 to 564. These are spread all over the county even to the lowest level facility so that services everywhere are up to standard. Due to the introduction of a renal unit in Longisa county referral hospital, the county sought services from 3 new renal nurses. To cover the increased range of services and number of facilities in the county, clinical officers too increased in number from 70 to 96. Radiologists increased from 2 to 4 to cover the introduction of radiology services in Ndanai sub-county and Sigor sub-county hospitals.
The number of doctors in the rank of medical officers increased from 7 to 21,
40
Paediatrician and a Gynaecologist to increase the range of specialized clinics in the county referral hospital. Introduction of these new clinics and specialist professionals according to the director of medical services in the county was to provide a range of services to the public, which motivates them to seek affordable services from the county hospitals due to its quality. This corresponds to the call by the Ministry of Health to improve on the quality and quantity of medical staff in referral facilities for overall quality of services (MOH, 2011).
The 87.2% increase in staff levels is however not sufficient according to the county health management Team due to the increased health facilities to cover and the increasing number of people using the public health facilities. The goal of making the health services more accessible and affordable easily overrides the issue of human resources for health shortages in our health facilities due to the issue of financial constraints. It is however better balanced when decisions are made closer to the people in devolved units because areas worst hit are prioritized (Kolehmainen-Aitken, 1998).
5.2 Conclusion
5.2.1 Technical efficiency levels
41 5.2.2 Returns to scale of health production
The average county scale efficiency score improved from 95.7% to 96.1%. Though it is a slight change, four out of five sub-counties are operating optimally after devolution of healthcare, up from two before it was devolved. The county average shows diminishing returns to scale, meaning the inputs should be scaled down by 3.9% to realize optimal production.
5.2.3 Number of hospitals and health facilities changes
Hospitals in Bomet County increased in number from 3 in 2012 prior to devolution’s onset, to 8 in 2015 after the commencing of devolution in Kenya. This meant upgrading of 5 facilities to have a hospital in each of the 5 sub-counties of Bomet County, referred to as sub-county referral hospitals in line with the Kenya Health Sector Strategic and Investment Plan (KHSSP 2012-2017) which factors in devolved healthcare.
Functional primary facilities, which are the health centers and dispensaries increased in number from 109 in 2012 to 132 by 2015. This meant the construction of new facilities, operationalizing the non-operational and upgrading some dispensaries to the health center levels. Health centers in particular increased from 13 to 18, while dispensaries increased from 96 to 114.
5.2.4 Healthcare human resource changes
42
denoting a 200% increase. Apart from numbers, new specialties were introduced, which included 3 renal nurses due to creation of a renal unit. A surgeon, a family doctor, a paediatrician and a gynaecologist were also introduced to offer such range of services.
5.3 Recommendations
5.3.1 Policy recommendations
The following are the policy recommendations based on the findings from the study.
i) The county ought to create more demand for its health services and therefore increase the utilization of its resources. This could be done through the use of community units, which is responsible for bringing out the unmet needs in the population and linking the populations to the health facilities.
ii) To ensure optimum use of healthcare resources, healthcare managers ought to do frequent monitoring and evaluation of the facilities to ensure that maximum benefit is yielded from the great investments in healthcare as a result of devolution. Creation of new hospitals, new health centers and dispensaries together with the staff and equipment that come with them should be reason enough to ensure the health outcomes are enormous in the county.
iii) The range of healthcare services in the county referral hospitals should be increased and their quality improved to create in itself the confidence the population has in the public healthcare system, enhancing the prudent use of these specialized services and resources for health benefits.
43
too much technicalities. This makes a greater use of human resources that could have been less involved in their duty stations.
5.3.2 Recommendations for further research
This study recommends the following for further research;
1. An in-depth research involving larger budgets and extended timeframes to cover all the counties where data from each county can be analysed and results compared to see how the counties are faring, and use to get the mean country technical efficiency score comparisons.
44 REFERENCES
Angeles, G., Stewart, J., Gaete, R., Mancini, D., Trujillo, A. & Fowler, C. (1999). Health Care Decentralization in Paraguay: Evaluation of Impact on Cost,
Efficiency, Basic Quality, and Equity. Baseline Report. MEASURE Evaluation
Technical Report Series No. 4. Carolina Population Center, University of North Carolina at Chapel Hill.
Bergman, S. E. (1998). Swedish Models of Health Care Reform: A Review and Assessment. International Journal of Health Planning and Management, 13: 91–106.
Bossert, T. (1998). Analyzing the Decentralization of Health Systems in Developing Countries: Decision Space, Innovation and Performance. Soc. Sci. Med.Vol. 47(10). Boston: Harvard School of Public Health.
Cellini, R., Pignataro, G. & Rizzo, I. (2000) Competition and Efficiency in Health Care: An Analysis of the Italian Case. International Tax and Public Finance, 7: 503– 19.
Fabbri, D. (2001) Efficiency in Hospital production. Public Economics, 31 (1): 33–70. Giuffrida, A., La Pecorella, F. & Pignataro, A., La Pecorella, F. & Pignataro, G. (2000)
Hospital Care Organization: Analysis of efficiency in hospitals. Public Economics 4: 101–24.
Government of Kenya, (2014). “Hospital Services Assessment Report 2014.” Government printers. Nairobi, Kenya.
45
Government of Kenya. (2014). “Annual Health Sector Performance Report, July 2013 - June 2014.” Government printers. Nairobi, Kenya.
Government of Kenya. (2014). “Health Sector Analysis Report 2013-2014.” Government printers. Nairobi, Kenya.
Government of Kenya. (2014). “Kenya Health Sector Strategic and Investment Plan (KHSSP) July 2014 – June 2018. Government Printer. Nairobi, Kenya.
Health Sector Working Group Report (HSWG) (2012). Medium Term Expenditure Framework (MTEF), 2012/13-2014/15.
Hollingsworth B. (2008). The Measurement of Efficiency and Productivity of Health Care Delivery. Health Economics, 17(10): 1107-1128.
Hussey, P., Vries, H., Romley, J., Wang, M., Chen, S., Shekelle, P. & McGlynn, E. (2009). Health Care Efficiency: A Systematic Review of Health Care Efficiency Measures. Health Research and Educational Trust, Health Services Research. 44:3
Hutchinson, P.L. & LaFond A.K. (2004). Monitoring and Evaluation of Decentralization Reforms in Developing Country Health Sectors. Bethesda, MD: The Partners for Health Reformplus Project, Abt Associates Inc.
Jervis, P. & Plowden, W. (2003). The impact of political devolution on the UK’s health services: Final report of a project to monitor the impact of devolution on the United Kingdom’s health services 1999–2002. The Nuffield Trust. London. Kirigia J., A., Emrouznejad, L. & Sambo. (2002). Measurement of Technical Efficiency
46
Kirigia J., A., Emrouznejad, L., Sambo, N., Munguti, W. & Liambila H. (2004). Using Data Envelopment Analysis to measure the Technical Efficiency of Public Health Centres in Kenya. Journal of Medical Systems, 28(2)
Kolehmainen-Aitken, R. (1998). Decentralization and Human Resources: Implications and Impact. Boston: Management Sciences for Health.
Levaggi, R. & Smith, P. (2003). Decentralization in health care: lessons from public economics. Paper Prepared for Conference on Economics and Health Policy Centre for Health Economics, University of York.
Magnussen, J. & Mobley, L.R. (1999). The impact of market environment on excess capacity and the cost of an empty hospital bed. International Journal of the Economics of Business, 6: 383–98.
Magnussen, J. (1998). The hospital sector in the 1990s. NIS. Oslo, Kummuneforlaget. Magnussen, J., Tediosi, F. & Mihályi, P. (2007). Effects of decentralization and recentralization on economic dimensions of health systems in Decentralization
in Healthcare: Strategies and Outcomes, Saltman, R.B., Bankauskaite, V. and
Vrangbaek, K. (Eds) . Berkshire, Open University Press.
Mills, A. (1994). Decentralization and accountability in the health sector from an international perspective: what are the choices? Public Administration and Development. 14:281–92.
Murkomen, O. K. (2012). Devolution and the Health System in Kenya. Strategic Thinkers and Actors Consultants Ltd., Nairobi.
47
Osei, D., George, M., Almeida, S., Kirigia, J., Mensah, A., & Kainyu H. (2005). Technical Efficiency of Public District Hospitals and Healthcentres in Ghana: A Pilot Study. Cost Effectiveness and Resource Allocation. 2005, 3:9.
Regmi, Krishna et.al., (2010). Understanding the Effect of Decentralization on Health Services: The Nepalese Experience. Journal of Health Organization and Management, Vol. 24 Iss: 4 pp. 361–382
Rondinelli, D., Nellis, J. & Cheema, G. (1984). Decentralization in Developing Countries. The World Bank. Washington, D.C.
Saltman, R.B., Bankauskaite, V. & Vrangbaek, K. (2007). Decentralization in Healthcare: Strategies and Outcomes. (eds). Berkshire, Open University Press.
Schwartz, J.B., Guilkey, D.K., & Racelis, R. (2002). Decentralization, Allocative Efficiency and Health Service Outcomes in the Philippines. Carolina Population
Center, North Carolina.
Sebastian, M. & Lemma, H. (2010). Efficiency of the Health Extension Programme in Tigray, Ethiopia: a Data Envelopment Analysis. BMC International Health and Human Rights. 2010, 10:16
Shah, A., (1998). Balance, Accountability and Responsiveness: Lessons about Decentralization. World Bank. Washington, D.C.
Sherwood, F.P. (1969) Devolution as a Problem of Organization Strategy. In Dalan, R.T., (ed)., Comparative urban research. Beverly Hills, CA, Sage.
Strumpf, K., Hutchinson, P. & Akin, J. (2001). Decentralization and Government Provision of Public and Private Goods: The Public Health Sector in Uganda. Working Paper, Measure Evaluation Project. Chapel Hill, NC: University of
48
Weber, M. (1947). The Theory of Social and Economic Organization. New York, Oxford University Press.
WHO, (2000). The World Health Organization: Health Systems-Improving Performance; World Health Organization. Geneva.
WHO, (2014). Trends in maternal mortality: 1990 to 2013. Estimates by WHO, UNICEF, UNFPA, the World Bank and the United Nations Population Division. World Health Organization. Geneva.
World Bank (1994). Colombia: Toward Increased Efficiency and Equity in the Health Sector. Can Decentralization Help. World Bank. Washington, DC.
World Bank. (2003). Decentralization of Health Care in Brazil: A Case Study of Bahia. Human Development Sector Management Unit, Brazil Country Management Unit, Latin America and the Caribbean Region. Report No. 24416-BR. Washington, D.C.
World Bank. (2012). Devolution without disruption-pathways to a successful new Kenya: Executive summary. World Bank. Washington, D.C.
49
APPENDIX I: MAP OF BOMET COUNTY
50
APPENDIX II: HEALTH OUTPUT DATA
Before devolution (2012) After devolution (2015)
AN C At te n d an ce (N ew C li en ts) OPD util isation r ate Fu ll y imm u n ize d Chi ld Cove rage T otal A d m iss ion s Rat e AN C At te n d an ce (N ew C li en ts) OPD util isation r ate Fu ll y imm u n ize d Chi ld Cove rage T otal A d m iss ion s r ate
Chepalungu 43.4 40.1 0.56 45.1 59.8 43.2 1.76 59.3
Sotik 49.4 41.3 0.79 49.4 62.1 43.3 1.92 61.2
Konoin 45.3 39.8 0.71 47.3 60.4 41.9 1.89 58.4
Bomet East 46.3 41.8 0.69 61.2 61.7 43.4 1.94 69.4
Bomet Central
51.9 41.2 0.95 64.9 66.3 42.9 2.12 67.2
County average
51
52
53
54