Contribution of Thermal Insulation in Reducing the Cooling
Load for Iraqi Building
Dr. Jamal H. Waheb
Lect. Mechanical Engineering Dept., University of Anbar [email protected]
Keywords: Thermal insulation, Energy conservation, Cooling load, Solar radiation, Renewable energy
U
Abstract
In tropical zones, like Iraq, the summer is so hot, usually higher than 45 P
o
P
C, and a special attention has to be paid to prevent extreme weather conditions and reducing the cooling load required for the building. Insulation slows the rate of heat transfer, helping keep homes warmer in winter and cooler in summer. The well-insulated home will satisfy comfortable conditions and consume less energy for heating and cooling. The aim of this study is evaluate the actual contribution of thermal insulation on the cooling load required for Iraqi building. For this purpose, an experimental study has been done to investigate the effect of thermal insulation on the building performance. The results show that average indoor temperature reaches 32 P
o
P
C in May and 34 P
o
P
C in June for sufficient insulation (insulation for all exposed walls and roof). ThePPresults also show that
the annual saving in cooling energy could reach up to 65 kWh/mP
2
P
, about (30%) compared to the conventional situation.
U
Introduction
Typical insulation materials could be used including cellulose, mineral wool, polystyrene and polyurethane. Cellulose insulation is suitable for spaces filled completely, while, a high density rigid insulation is better suited under a floor slab. Department of Energy (DOE) has recommended R-values based on the regional climate and the demand for heating and cooling [1]. It is important to note that, the1T1TUS R-value is given in unit of1T1TftP
2
P
·°F·hr/Btu and it is easy to confuse with SI R-value which is given in mP
2
P
·K/W, thus US R-values are approximately six times SI R-values. However, in this study a new insulation material has been studied in order to evaluate the insulation impact on the buildings according to thermal, economic and environmental views.
U
Previous Review
From 2004 to 2008; a series of studies have been done by a research team at the University of Technology in Baghdad [2] under a contract with the Ministry of Higher Education and Scientific Research (MHESR), in order to improve the thermal performance of the Iraqi buildings. The examination room included some environmental solutions such as thermal insulations. The design was analyzed using a computerized program Ecotect. The results showed that there is ability to reduce the electrical power by about 60% and offer inside room temperature less than 35 P
o
P
C in summer. The design also showed decreasing by 40 % of the heating energy in winter by using of thermal insulations. Another study carried out by Kalif A. et al (2013) [3] tried to calculate the effect of packaging materials on the cooling load in Baghdad. The study conducted a survey of several materials like gypsum board, wood sheathing granite and ceramic layers. A computer programming was done to estimate the amount of cooling load through the walls by using CLTD (Cooling Load Temperature Differences) style method described by ASHRAE. The U-value of materials was determined depending on the resistance method. The results showed that the percentage reduction in cooling load when using internal packaging materials ranges between 5%-12%.A study carried out by Abdulsada G. and Wasmi T. [4] using a new local thermal insulation which is the reflective carbon sheets. Many parameters are taken into account like ambient
temperature, solar radiation, orientation and duration. The results of the work gave good indication that using this insulating system in residential building has great effect on the energy consumed.
U
Experimental Work
The experimental study was carried out in the building of Mechanical Engineering Department, Al-Mustansiriyah University in Baghdad (33.3P
o
P
N, 44.3P
o
P
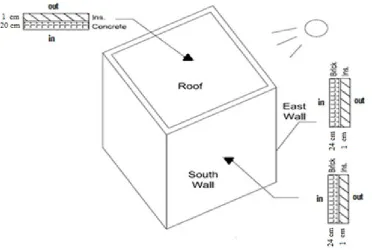
E) during the period 3 May – 4 June 2015. The selected room was at the terrace floor of the building and located at the south-east corner where both south and east walls are exposed to direct solar radiation. The dimensions of the room are (4m x 4m x 3m), as shown in figure (1).
Fig. (1): Construction of walls and roof for the selected room
The insulation is purchased from local market which is the extruded polyethylene 1 cm layer with a reflected alu-foil, as shown in figure (2).
Fig. (2): Insulation Material
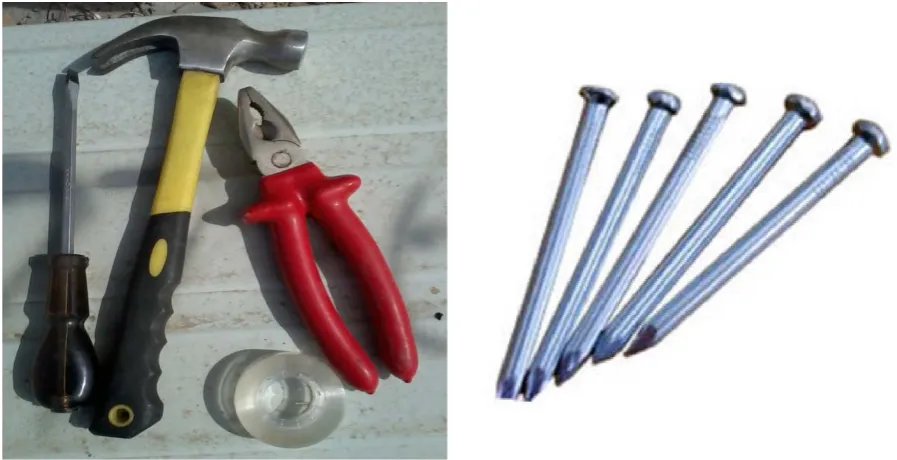
The layer of insulation is fixed to cover the wall by the means of iron nails, as shown in figure (3).
Fig. (3): Tools used to install the Insulation materials
U
Results
After the installation is finished properly, measurements were made for all effective parameters in the building. Several thermometer sensors are used in different positions to measure indoor and outdoor temperatures. Also, some sensors are embedded into the walls or material surfaces to ensure temperature reading. Surface temperature sensors are connected to data logger system (Lutron-Model BTM-4208SD). Outdoor air readings are also compared with climatic data that obtained by Iraqi Meteorological Organization and Seismology (IMOS) [5]. Measurements of solar radiation are taken using solar power meter (Lutron-Model SPM-1116SD) and measurements within the building are compared with some data sources. The instruments that used in this study are shown in figure (4).
Fig. (4): Instruments used for the project
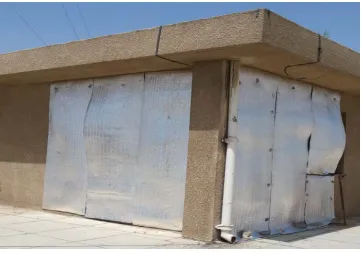
The study includes in-site measurements on selected buildings within the months May and June. In the beginning, various influences of weather and climates were investigated, because of some limitations in this study, such as wind that could reduce the effectiveness of the outdoor survey due to surface temperature shear effects. Similarly, rain may also lead to surface cooling, that dissipates thermal effects on the surface. Hence, the values used for the study were measured during typical clear weather. The temperatures were measured at every 15 minutes from (8:00 am) till (l6:00 pm) at different parts of the building with different heights. The other data were recorded every hour during the daytime. Measurements were done before and after insulation, as shown in figure (5). Readings were taken for a period of several days before the insulation and for several days after the insulation. It is advised to take more stable readings into consideration. The insulated material is covered the exposed walls (eastern and southern) as well as the roof.
(a) Room before insulating
(b) Room after insulating
Fig. (5): Measurements were done before and after insulating
U
Discussion
In order to show the results in good manner they are classified into several groups as following:
1. Meteorological Data
The method of data measurements appeared to be highly affected by the local variations of the weather. The sunshine duration affects the solar radiation and the ambient temperature accordingly in cloudiness and dust storm which appeared in May for several days.
Summer in Iraq is very hot and the ambient temperatures are in a continuous increasing, as shown in figure (6). In May, maximum temperature increases from 34 P
o
P
C at the beginning and reaches up to 39 P
o
P
C at the end of month. While for June, it begins with 38 P
o
P
C and rises up to 45 P
o
P
C.
a. May
b. June
Fig. (6): Ambient Temperature
Measurements of hourly global solar radiation incident up on horizontal plane for May and June were obtained, as shown in figure (7). It is cleared that the day length of May is about 13 hours
(5.30 AM – 6.30 PM), while the day length of June is about 14 hours (5 AM – 7 PM). The maximum solar radiation in May reaches up to 850 W/mP
2
P
, while the maximum solar radiation in June reaches up to 950 W/mP
2
P
. The average amount of solar gain in May reaches up to 750 MJ/mP
2
P
(about 7 kWh/mP
2
P
. Day), while the average amount of solar gain in June reaches up to 850 MJ/mP
2
P
(about 8 kWh/mP
2
P
. Day).
a. May
b. June
Fig. (7): Global solar radiation on a horizontal surface
The Results show that greatest values of solar radiation occurred at midday (12 AM -2 PM), where the solar rays cross the atmosphere by shortest path; while at sunrise or sunset time, the rays pass long track contaminated, hence increases the chances of exposure to the absorption and
8.00 10.00 12.00 14.00 16.00 Time (hh.mm)
30.00 32.00 34.00 36.00 38.00 40.00
Te
m
pe
ra
tu
re
(C
)
East - with East - without South - with South - without
scattering. In recent years, dust level in the air is increased in Iraq due to drought resulting from the low level of rainfall [6].
2. Internal Surface Temperature
It is very important to measure the internal temperature of the walls and ceiling, because it gives a clear perception of the amount of transmitted heat by conduction to inside, as well as the amount of accumulated heat in the construction. Generally, the temperatures of the internal surfaces in the case of a thermal insulation is lower compared with that of conventional situation and the range of reduction is about (2P
o
P
C – 6P
o
P
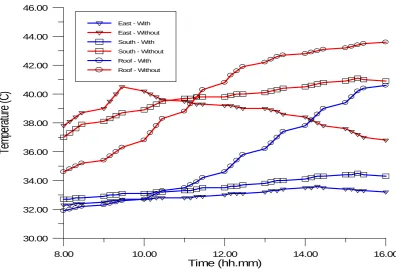
C), as shown in figures (8) and (9). It should be noted that the cases tested at different duration in summer where the impact of ambient temperature and the solar radiation are variables.
The presence of insulation makes the temperature of internal surface stable with a slightly rate of temperature gradient. On the other hand, the internal temperature of the uninsulated wall rises up to 38 P
o
P
C, hence suffers from the fluctuating rate of temperature, that leads to thermal stresses and thus to cracking, fractures and even mold.
The presence of thermal insulation is limited with the increasing of the incident solar radiation, especially at the ceiling. The thermal insulation efficiency drops in the peak hours of solar radiation (after midday) because of the lack of resistance of thermal insulation. Based on that, there is a significant need to increase the thickness of the insulating material or use of sufficient material mixed with construction, such as polyurethane to reduce the heat transmitted.
Fig. (8): Variation of internal surface temperature (5 May 2015)
8.00 10.00 12.00 14.00 16.00 Time (hh.mm)
30.00 32.00 34.00 36.00 38.00 40.00 42.00 44.00 46.00
Te
m
pe
ra
tu
re
(C
)
East - With East - Without South - With South - Without Roof - With Roof - Without
8.00 10.00 12.00 14.00 16.00
Time (hh.mm) 26.00
28.00 30.00 32.00 34.00 36.00 38.00
Te
m
pe
ra
tu
re
(C
)
Reflected carbon
Polyethelene
Ambient
Fig. (9): Variation of internal surface temperature (1 June 2015)
These results are compared with that obtained experimentally by Abdulsada G. and Wasmi T. [4]. The mentioned work was done for similar room in the building and similar ambient conditions using reflective carbon sheets as the insulation materials. The compared results for the southern wall show confidence, as shown in figure (10).
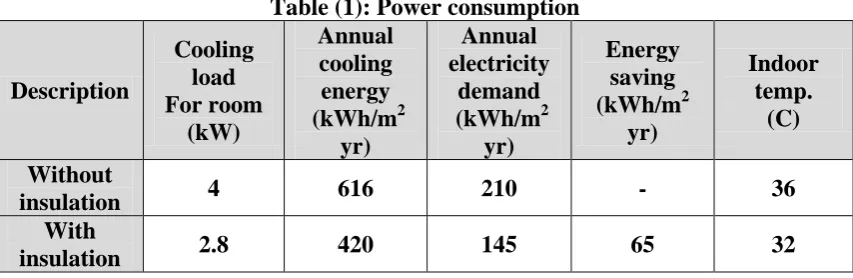
Fig. (10): Comparison of internal surface temperature for different insulators (5 May) 3. Power Consumption
The calculation of energy consumption depends on the average indoor temperature and peak outdoor conditions. Table (1) shows the energy consumption and average indoor temperature obtained in the 16 mP
2
P
test room that mentioned by this experimental work, and in absence of internal heat gain (IHG). The results show that average indoor temperature reaches about 36 P
o
P
C for conventional situation (no insulation), while it can reach 32 P
o
P
C in May for sufficient insulation (insulation for all exposed walls and roof). ThePPresults also show that the annual saving in cooling
energy could reach up to 65 kWh/mP
2
P
, about (30%) compared to the conventional situation.
Table (1): Power consumption
Description Cooling load For room (kW) Annual cooling energy (kWh/mP 2 P yr) Annual electricity demand (kWh/mP 2 P yr) Energy saving (kWh/mP 2 P yr) Indoor temp. (C) Without
insulation 4 616 210 - 36
With
insulation 2.8 420 145 65 32
U
References
[1] U.S. Department of Energy (DOE), "Insulation", USA, 2010, 36TUwww.energysavers.govU36T
[2] Sahar N., Yahya A., and Nagham A., "Thermal Simulation of Custom Designed House to Test Application of New Cooling Methods", Iraqi Journal of Architectural Engineering, Baghdad, 2008, Issue 14
[3] Kalif A., Ismael A. and Hussein N., "Comparison of the Thermal Behavior for Natural and Industrial Packaging Materials on the Cooling Load in Baghdad", Journal of Babylon University (Engineering Sciences), No.(4), Vol.(21), Pages (1450-1463), 2013
[4] Abdulsada G. and Wasmi T., "Experimental and Theoretical Study for the Performance of New Local Thermal Insulation in Iraqi Building", 13th World Renewable Energy Congress (WREC XIII), London UK, August 3-8, 2014
[5] Iraqi Meteorological Organization and Seismology (IMOS), Ministry of Transportation, Iraq, 36TUwww.meteoseism.gov.iqU36T
[6] Abdulkareem A., "Dust storms Monitoring, Prediction and Allocation of Sources", Scientific and Technical Subcommittee on the Peaceful Uses of Outer Space, Fiftieth Session, Vienna International Center, Austria, 11-22 February 2013