Advances and Applications in Bioinformatics and Chemistry
Dove
press
O r i g i n A l r e s e A r C h
open access to scientific and medical research
Open Access Full Text Article
hypergeometric analysis of tiling-array
and sequence data: detection and interpretation
of peaks
erdogan Taskesen1,2
remco hoogeboezem1
ruud Delwel1
Marcel JT reinders2,3
1Department of hematology, erasmus
University Medical Center, rotterdam,
2Delft Bioinformatics lab (DBl),
Delft University of Technology, Delft,
3netherlands Bioinformatics Centre
(nBiC), nijmegen, The netherlands
Correspondence: erdogan Taskesen Delft Bioinformatics lab (DBl), Delft University of Technology, Delft, Mekelweg 4, 2628CD, The netherlands
Tel +31 15 2785 859 email [email protected]
Abstract: Probing protein-deoxyribonucleic acid (DNA) is gaining popularity as it sheds light on molecular mechanisms that regulate the expression of genes. Currently, tiling-arrays and next-generation sequencing technology can be used to measure these interactions. Both methods generate a signal over the genome in which contiguous regions of peaks on the genome represent the presence of an interacting molecule. Many methods do exist to identify functional regions of interest (ROIs) on the genome. However the detection of ROIs are often not an end-point in research questions and it therefore requires data dragging between tools to relate the ROIs to information present in databases, such as gene-ontology, pathway information, or enrichment of certain genomic content. We introduce hypergeometric analysis of tiling-array and sequence data (HATSEQ), a powerful tool that accurately identifies functional ROIs on the genome where a genomic signal significantly deviates from the general genome-wide behavior. HATSEQ also includes a number of built-in post-analyses with which biological meaning can be attached to the detected ROIs in terms of gene pathways and de-novo motif analysis, and provides differ-ent visualizations and statistical summaries for the detected ROIs. In addition, HATSEQ has an intuitive graphic user interface that lowers the barrier for researchers to analyze their data without the need of scripting languages. We compared the results of HATSEQ against two other popular chromatin immunoprecipitation sequencing (ChIP-Seq) methods and observed overlap in the detected ROIs but HATSEQ is more specific in delineating the peak boundaries. We also discuss the versatility of HATSEQ by using a Signal Transducer and Activator of Transcrip-tion 1 (STAT1) ChIP-Seq data-set, and show that the detected ROIs are highly specific for the
expected STAT1 binding motif. HATSEQ is freely available at: http://hema13.erasmusmc.nl/
index.php/HATSEQ.
Keywords: bioinformatics, NGS analysis, ChIP-Seq, peak detection
Background
Protein-deoxyribonucleic acid (DNA) interactions, such as transcription factor-DNA bind-ing, DNA methylation, or methylation/acetylation of histone tails, can nowadays be identified with high sensitivity and specificity, using next-generation sequencing (NGS) technology. NGS rapidly replaces tiling-arrays technology because of the increased resolution with which the interactions can be measured. Both technologies generate a signal along the genome that, for instance, represents the interaction of regions with transcription factors. Typically one is interested in finding those regions in the genome where a signal significantly deviates from the overall genome-wide background signals. Previously, for tiling-array data, we developed a method called hypergeometric analysis of tiling-arrays (HAT), to detect regions of interest (ROIs). In short, HAT sets a threshold to decide whether the signal of a probe is excessive,
Advances and Applications in Bioinformatics and Chemistry downloaded from https://www.dovepress.com/ by 118.70.13.36 on 19-Aug-2020
For personal use only.
Number of times this article has been viewed
Dovepress
Taskesen et al
and then uses a sliding window approach to analyze whether a significant number of marked probes are found within that win-dow. The signal is analyzed at different scales by considering a range of different thresholds and window sizes, and the detected regions at individual scales are integrated. The detected ROIs are over all scales under control of a Family-Wise-Error (FWE),
specified by a significance level α. HAT has been successfully
applied on a range of different DNA-interaction sources, such
as chromatin immunoprecipitation (ChIP)-on-chip,1 MeDIP
(methylated DNA immunoprecipitation)-on-chip,2 H3K4me3
(trimethylation of H3 lysine 4), H3K27me3 (trimethylation of H3
lysine 27),1 and 3′-TILLING-135-K-Oryza-sativa-microarray.3
Here, we introduce HATSEQ, which is an improved version of HAT that can work on nucleotide resolution. As with HAT, hypergeometric analysis of tiling-array and sequence data (HATSEQ) is nonparametric, and independent of the coverage and resolution across the genome. Various methods with vary-ing algorithmic complexity have been developed to detect ROIs in ChIP sequencing (-Seq) data such as Model-based Analysis
for ChIP-Seq (MACS),4 FindPeaks,5 CisGenome,6 QuEST
(Quantitative Enrichment of Sequence Tags),7 and PeakSeq.8
MACS is one of the most cited methods for analyzing ChIP-Seq data. Although there are a variety of ChIP-Seq methods, the majority can only be run from the command line and require
variable degrees of data formatting and expertise to implement.9
CisGenome, however, does provide a graphical user interface (GUI) but is restricted to the windows platform. With HATSEQ, we aim to target the typical researcher who can experience dif-ficulties with the use of the command-line and in downstream analyses. After finding the ROIs with HATSEQ, one is generally interested in functional analysis of the regions. Typically this is done by relating the regions to information present in databases, such as gene-ontology, pathway information, or enrichment of certain genomic content. HATSEQ supports, through a GUI, a number of such functional analyses of the ROIs: eg, gene-mapping, motif analysis, and pathway analysis. It also outputs for the detected ROIs, FASTA files, University of California, Santa Cruz (UCSC) genome browser-tracks to enable visualization of the ROIs together with any other genomic data, and a single
circular graph (Circos)10 that illustrates all the detected genes
and their chromosomal locations.
Implementation
hATseQ: a statistical framework
to detect regions of interest
in genomic signals
HATSEQ detects ROIs in NGS data using the statistical
framework as described in HAT,1 but with read-depth at
genomic positions as an input. It is supposed that genomic positions with read-depth greater than zero may be the result of sequenced DNA pieces that were, for example, present in the immunoprecipitated chromatin sample, indicating the presence of protein-DNA binding at that particular position. To decide whether the read-depth at a genomic location is excessive, HATSEQ varies the threshold at which it con-siders the read-depth to be indicative for a genomic event. A sliding window approach is then used to analyze whether a significant number of excessive sequence-reads are found within the window for every threshold setting and for varying widths of the window (as the size of the event is not known a
priori). For each window, a P-value is determined, defined as
the probability of observing at least the number of observed
reads, x, in the window (given a random distribution of reads
over the genome). For any window position g, threshold
level t, and window width n, P(g, t, n) is computed as:
P g t n P X x g t n X c P X x g t n
P X c g t n
( , , ) ( | , , , ) ( | , , )
( | , , )
= ≥ ≥ = ≥
≥
[1]
where P(X$ x|g, t, n) is based on the hypergeometric
distri-bution of drawing, on genomic position g, at least x reads that
exceed the threshold t in a window of size n, and where N is
a fixed parameter that represents the total number of reads
that are sequenced, and K the number of reads that exceed
the threshold. For each window, the P-value is restricted
such that each window should contain at least c reads to
pre-vent evaluating window positions that are not of interest. We apply Bonferroni to correct for the number of tests performed at each threshold level, which is defined by the
number of reads (K) that exceed the threshold (t) and window
size n. The corrected P-values are subsequently defined by:
P*(g, t, n). Due to the use of various threshold values (t) and
window sizes (n), similar or partly overlapping regions are
found. In order to find a single region-of-interest at the same genomic location, these overlapping regions are integrated by joining regions with one or more overlapping reads. To determine the most important part of the ROI, we introduce
a read-depth significance score Q(g), which reports how
often reads were part of a region for a predefined significance
level (α). This score is computed as follows:
Q g S g t n I x g t n t
N t
( )=
∑
∀∑
∀ ( , , ) ( ( , , ), )⋅ [2]where
S g t n( , , )=
{
10 elseif P g t n*( , , )≤α [3]Advances and Applications in Bioinformatics and Chemistry downloaded from https://www.dovepress.com/ by 118.70.13.36 on 19-Aug-2020
Dovepress hATseQ
and
I x g t n( ( , , ))=
{
10 elseif x g( )≥t [4]Thus, the final candidate ROIs are determined by integrating the significant window positions over all thresholds. HATSEQ is optimized for NGS data analysis by: 1) incorporating a minimum allowed read-depth to prevent the detection of systematic variation; 2) incorporating a mini-mum allowed region length to prevent the detection of regions that are the result of highly correlated reads; 3) normalization of the read-depth per sample such that sum of the read-depth is 1, which makes the depth of the sequenced reads compa-rable between experiments; 4) normalization of the read-depth by using a set of reference samples; and 5) the use of multi-threaded computations (each chromosome is separately analyzed and HATSEQ exploits the use of memory mapped files that allow the analysis of any read-depth).
HATSEQ can be applied in three types of study-designs, namely: 1) one-sample analysis where only one sample is available and sequenced; 2) multi-sample analysis, where the sequenced reads of the experimental samples can be analyzed compared to the reads of one or more negative control samples; and 3) combined ChIP-Seq and ChIP-on-chip analysis where an overlap of candidate ROI between the experimental replicates can be marked.
Functionalities of hATseQ
Data processing and region identificationHATSEQ detects ROIs from mapped sequenced reads or normalized probe intensities. For the analysis of NGS data, it processes Bam or Pileup files to detect ROIs using the read-depth at base pair position. For ChIP-on-chip data it uses preprocessed files, eg, by MAT (model-based analysis
of tiling-arrays).11 As an example, both NGS data and
ChIP-on-chip files can be loaded using the GUI and simultaneously analyzed with or without controls.
Pathway analysis
HATSEQ integrates two pathway enrichment analyses based on the genes that are selected by: 1) having a selected ROI as the closest ROI; or 2) having a detected ROI in their pro-moter region (the 2000 nucleotids [nt] region upstream of the transcriptional-start-site [TSS]). Pathway annotations (gene-sets) are extracted from the Molecular Signature Database
(MSigDB).12 The enrichment of each pathway for the selected
set of genes is computed using the hypergeometric distribution and is corrected for multiple testing using False Discovery
Rate (FDR)13 or Familywise error rate (FWER).14
Motif analysis
HATSEQ gives the opportunity to find enriched motifs in sequences derived from: 1) the detected ROIs; and 2) the promoter regions (2000 nt upstream from TSS) of the genes that have a selected ROI as closest ROI. It
uses the generalized extreme value probability method,15
which detects significantly over-represented ungapped words of f ixed length. It consequently outputs the over-represented sequences that are corrected for
mul-tiple testing using FDR13 or FWER.14 Finally, for each
detected motif, the Position Weight Matrices (PWMs) are correlated with annotated PWMs from TRANSFAC (tran-scription factor database) and JASPAR and subsequently listed if the correlation is larger than 0.6.
support for different species
HATSEQ supports annotation (for eg, ROI associations) and chromosome files for the species that
are available on UCSC (http://hgdownload.cse.ucsc.edu).
Species that are available on UCSC can be chosen using the GUI, which are then automatically downloaded, or alterna-tively, species can be uploaded selectively.
statistical summaries and visualization of results HATSEQ reports the detected ROIs, including the neighbor-ing genes, and summary statistics, in tables. For example, one can extract the percentage of ROIs that are in close vicinity to the TSS of a gene, or the percentage of ROIs that contain a user defined motif. The genes for the detected ROIs can be visualized by the circular-graph, Circos, or as custom tracks in UCSC.
equipment
softwareHATSEQ is a stand-alone application that is implemented in
C++ and Matlab Mathworks. To run HATSEQ, an installation
of Matlab or the freely available Matlab Compiler Runtime (MCR) is mandatory.
hardware
HATSEQ runs on any x86–64 system with Microsoft (MS)-Windows, UNIX, Linux, or Mac OS, and a minimum of 4 GB of random access memory (RAM) is required. The analyzed ChIP-Seq examples in this manuscript were run on MS-Windows 7 with a 1.87 GHz central processing unit (CPU) and 4 GB RAM. The runtime, with default parameter settings, was approximately 10 minutes to detect ROIs in 1 million reads (1.87 GHz), an estimate that increases with sequence coverage.
Advances and Applications in Bioinformatics and Chemistry downloaded from https://www.dovepress.com/ by 118.70.13.36 on 19-Aug-2020
Dovepress
Taskesen et al
Results and discussion
Method comparison
To evaluate the performance of HATSEQ, we used two publically available ChIP-Seq data-sets (DNA binding of CCAAT enhancer binding protein alpha [C/EBPA] and trimethylation of H3 lysine 4 [H3K4me] experiment) and compared the results against two other state-of-the-art
methods: MACS (version 1.42)4 and FindPeaks (version 4).5
MACS uses a dynamic Poisson distribution to detect peaks and empirically estimates the FDR for each detected peak, whereas FindPeaks assumes a triangle based distribution in which fragments have a minimum, maximum, and a user defined median size.
The first ChIP-Seq data-set contains massively parallel sequenced DNA-fragments bound by the transcription factor C/EBPA (cell-line U937, Gene Expression Omnibus [GEO] accession: GSM722423) and is used to evaluate the results for one-sample analysis. The sequencing data of this C/EBPA experiment is aligned using BWA (Burrows–Wheeler Aligner)
(human genome build 19; hg19).16 To avoid the detection of
peaks that are the result of technical variation, we discarded genomic positions with a read-depth smaller than ten. With
MACS we detected 50,525 ROIs, using default parameters
(bandwidth of 300 nt at the 1 × 10⁻⁵ significance level).
Find-Peaks detected 75,839 ROIs using the default parameters
(tri-angle distance low =100 nt, median =200 nt, high =300 nt with
minimal allowed coverage 0.001). With HATSEQ we detected 32,735 ROIs using a bandwidth (fragment size) of 300 nt, but with FWER significance level 0.05. Eighty-seven percent of the 32,735 HATSEQ ROIs (28,413 ROIs) were also detected by either of the two other methods, and 85% (27,862 ROIs) of the HATSEQ ROIs are common among all methods (Figure 1A).
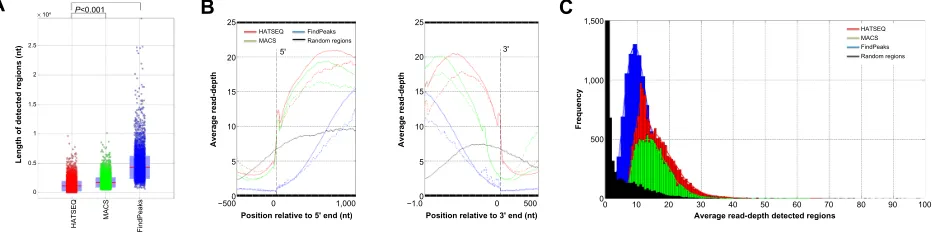
Although there was a high overlap of detected ROIs between the three methods, HATSEQ better delineates the peak boundaries in the data. This can be concluded from: 1) regions detected by HATSEQ showed on average higher read-depth (HATSEQ: 30.1, MACS: 13.1, and FindPeaks: 5; Figure 2C); 2) regions detected by HATSEQ are consistently smaller in length compared to the other methods (average region length HATSEQ: 153 nt, MACS: 350 nt, and Find-Peaks: 1,679 nt; Figure 2A); and 3) the read depth differences at the boundary of a region are more extreme for HATSEQ regions (Figure 2B). We illustrate in Figure 1B the superior behavior of HATSEQ for ChIP-seq data for a region on
A FindPeaks
MACS HATSEQ
FindPeaks MACS
HATSEQ 208 nt
416 nt
235 nt
501 nt
129 nt
357 nt
9,908 nt 186
27,862 14,432
33,359
7,866
C/EBPA experiment
Coverage
Reads
Chr 1 IL6R
FindPeaks MACS
HATSEQ 2,313 nt
2,739 nt 5,429 nt
H3K4me experiment
H3K4me background
Coverage
Reads
Coverage Reads
Chr 22 SDF2L1
365 4,322
C
B D
FindPeaks
MACS HATSEQ
1,006 7,793 487
601
1,305 590 5,330
Figure 1 Venn diagram and an illustration of a detected rOi for hATseQ, MACs, and FindPeaks.
Notes: Detectedregions of interest by hATseQ, MACs, and FindPeaks are indicated in red, green, and blue, respectively. (A) The amount of detected rOis for the C/eBPA experiment, and the overlap between the methods. (B) rOis detected by the three methods on chromosome 1 (around the promoter region of IL6R). The top part of this panel illustrates the pileup or coverage that is determined by the sequenced reads. (C) The amount of detected rOis for the h3K4me experiment and the overlap between the methods. (D) rOis detected in the neighbourhood of SDF2L1 on chromosome 22. The top panel of this figure shows a pileup of the H3K4me experiment as well as a pileup of an H3K4me background experiment (giving an indication of the amount of non-specific reads).
Abbreviations: hATseQ,hypergeometric analysis of tiling-array and sequence data; MACs, model-based analysis for ChiP-seq; nt, nucleotide; rOi, region of interest; h3K4me, trimethylation of h3 lysine 4; ChiP-seq, chromatin immunoprecipitation sequencing; C/eBPA, CCAAT enhancer binding protein alpha; nt, nucleotids.
Advances and Applications in Bioinformatics and Chemistry downloaded from https://www.dovepress.com/ by 118.70.13.36 on 19-Aug-2020
Dovepress hATseQ
chromosome 1 of the C/EBPA experiment. It can clearly be seen that HATSEQ most accurately detects the three regions
of interest, among a region close to the TSS of IL6R which
is a known target of C/EBPA.17 Remarkably, FindPeaks
detects one large region of interest, and MACS overshoots the boundaries of the three regions. Among the 4,322 ROIs that were solely detected by HATSEQ, we detected ROIs that were in close proximity of known target C/EBPA genes, such
as CD718 and ACSL.19
The second analysis involved sequence data from an H3K4me ChIP-Seq experiment (cell-line K562, data avail-able from University of Washington) in which functional loci based on the chromatin signatures can be identified, ie,
H3K4me peaks at the promoter of active genes.20 These
his-tone marks are known to generate a bimodal distribution of the signal (read-depth) which is caused by the spacing between
the histones that interact with the DNA.21 We evaluated the
results of HATSEQ, MACS, and FindPeaks for the identifi-cation of H3K4me peaks by normalizing it against a control replicate. Sequence alignment was performed using BWA
(hg19)16 with default parameter settings. HATSEQ detected
14,616 statistically significant regions of interest, MACS: 10,694, and FindPeaks: 9,471 (Figure 1C) by comparing the input versus the negative control.
The regions detected by HATSEQ that overlap with either of the two other methods (9,286 ROIs, 63.5%) again showed that HATSEQ better delineates the peaks, although less pronounced, as in the previous experiment: 1) the HATSEQ regions have higher read-depths (average read-depth: HATSEQ: 16.1, MACS: 15.5, and FindPeaks: 10.5; Figure 3C); 2) HATSEQ regions are smaller in length (average region length: HATSEQ: 1,096 nt, MACS: 1,751 nt, and FindPeaks: 4,297 nt; Figure 3A), and 3) the difference of read-depth at the border of the region is 0
HATSEQ
MACS
FindPeak
s
HATSEQ MACS FindPeaks Random regions
HATSEQ MACS FindPeaks Random regions
1 2 3
Position relative to 5' end (nt)
Length of detected regions (nt)
4 5 6
0
−500 0 300
10 20 30
Average read-depth
40 50
5' 60
Position relative to 3' end (nt)
0
−300 0 500
10 20 30
Average read-depth
40 50
3' 60
Average read-depth detected regions
00 10 20 30 40 50 60 70 80 90 100
1,000 2,000 3,000
Frequency
4,000 5,000 6,000 7,000 8,000
P<0.001
P<0.001 × 10⁴
A B C
Figure 2 rOi statistics for the C/ePBA experiment.
Notes: statisticsfor the detected rOis by hATseQ, MACs, and FindPeaks (red, green, and blue, respectively) for the C/ePBA experiment. (A) Boxplot illustrating the region length of the detected regions. (B) Average read-depth across the rOi boundaries with respect to the 5´ (left panel) and 3´ end (right panel). The average read-depths are calculated per nucleotide position after aligning the detected rOis at their 5´ and 3´ ends, respectively. The solid line represents the alignment of the 32,735, 50,525, and 75,839 rOis detected by hATseQ, MACs, and FindPeaks, respectively. The dashed line represents the alignment of the 4,322, 7,866, and 33,359 rOis that are uniquely detected by hATseQ, MACs, and FindPeaks, respectively. (C) Distribution of the average read-depth for all the detected regions using hATseQ, MACs, and FindPeaks.
Abbreviations: hATseQ,hypergeometric analysis of tiling-array and sequence data; MACs, model-based analysis for ChiP-seq; nt, nucleotide; rOi, region of interest; ChiP-seq, chromatin immunoprecipitation sequencing; C/ePBA, CCAAT enhancer binding protein alpha; nt, nucleotids.
0
HATSEQ MACS
FindPeak
s
HATSEQ MACS
FindPeaks Random regions
HATSEQ MACS FindPeaks Random regions
0.5 1 1.5
Position relative to 5' end (nt)
Length of detected regions (nt)
2 2.5
0
−500 0 1,000
5 10
Average read-depth
15
20 5'
25
Position relative to 3' end (nt)
−1.0 0 500
Average read-depth
3'
0 5 10 15 20 25
Average read-depth detected regions
00 10 20 30 40 50 60 70 80 90 100
500
Frequency
1,000 1,500
P<0.001
P<0.001 × 10⁴
A B C
Figure 3 rOi statistics for the h3K4me experiment.
Notes: statisticsfor the detected rOis by hATseQ, MACs and FindPeaks (red, green, and blue, respectively) for the h3K4me experiment. (A) Boxplot illustrating the region length of the detected regions. (B) Average read-depth across the rOi boundaries with respect to the 5´ (left panel) and 3´ end (right panel). The average read-depths are calculated per nucleotide position after aligning the detected rOis at their 5´ and 3´ ends, respectively. The solid line represents the alignment of the 14,616, 10,694, and 9,471 rOis detected by hATseQ, MACs, and FindPeaks, respectively. The dashed line represents the alignment of the 5,330, 1,305, and 601 rOis that are uniquely detected by hATseQ, MACs, and FindPeaks, respectively. (C) Distribution of the average read-depth for all the detected regions using hATseQ, MACs, and FindPeaks.
Abbreviations: hATseQ,hypergeometric analysis of tiling-array and sequence data; MACs, model-based analysis for ChiP-seq; nt, nucleotide; rOi, region of interest; h3K4me, trimethylation of h3 lysine 4; ChiP-seq, chromatin immunoprecipitation sequencing; nt, nucleotids.
Advances and Applications in Bioinformatics and Chemistry downloaded from https://www.dovepress.com/ by 118.70.13.36 on 19-Aug-2020
Dovepress
Taskesen et al
much more pronounced for HATSEQ regions (Figure 3B). Figure 1D illustrates a region on chromosome 22 in close
proximity of SDF2L1. Clearly, HATSEQ delineates the
boundaries of the peak region best. To assess the validity of the detected regions by HATSEQ, we tested the 14,616 ROIs for bimodality using the statistical dip test of
unimo-dality.22 A significant bimodal distribution (FDR #0.05)
was detected in 12,897 ROIs (88.2%). This illustrates that the large majority of detected ROIs contains the expected bimodal distribution.
Taken together, HATSEQ showed better performance in delineating peak boundaries for the detected ROIs when compared to other ChIP-Seq methodologies, such as MACS and FindPeaks. For each method we used the default settings, although transcription factor binding and histone modifica-tions can differ substantially in their properties (eg, length of the region) yet specifying the optimal parameters in an unbiased way is difficult. We also tested whether HATSEQ
can also detect ROIs in genomic areas with low-read depth by re-analyzing the C/EBPA ChIP-seq data set without remov-ing any genomic positions with read-depth smaller than ten. We detected 42,046 significant regions (instead of 32,735 ROIs) which clearly illustrates the capability of HATSEQ to detect ROIs in low-read depth genomic areas. Note that applications of HATSEQ are not limited to the presented NGS ChIP data but can be applied to other types of data,
such as MeDIP-seq,23 DNase-seq (DNase I hypersensitive
sites sequencing),24 and MBD-seq (methyl-CpG binding
domain protein sequencing).25
A case study with hATseQ
To illustrate the functionalities of HATSEQ, we used a publicly available ChIP-Seq data-set (GEO accession: GSE15353) where the DNA-fragments bound by the transcription factor
STAT1 (Signal Transducer and Activator of Transcription 1)26
were massively parallel sequenced. For transcription factor
4,05,40,659 4,05,40,662 4,05,40,667 4,05,40,683 4,05,40,735 4,05,40,741 4,05,40,923 4,05,40,960 4,05,40,992 4,05,40,994 4,05,41,006 4,05,41,014
Minimal affected region
Maximal affected region Experiment 1
Experiment 2
Experiment 3
Experiment 4
Experiment 5
Experiment 6
0 20
0 25
0 100
100
Number of reads
Read-depth significance
100
40
0
A B
D
0 2,000
1,000 0
5,000 0
5,000 0
2,000 0
1,000 5,000 4,000
0
UCSC genome browser tracks (STAT3) C Motif analysis
E Pathway analysis
Com mon in 2
Comm on in
3
Commo
n in 4
Com mon
in 5
Common in 6
1
2
3
4 5 6
7
8 9
10
11
12 13
14 15
16
17 18
19 20
21 22
x
123456
Sequence position
Bits
789 10 1
1 2
123456
Sequence position
Bits
789 0
1 2
Module 5
−log10 (P-value)
Module 84 Module 46 Module 44 Module 75 Module 2 Module 45 Dauer stat3 targets up Zhang response to Ikk inhibitor and Tnf up Boyault liver cancer subclass G5 Dn Fulcher inflammatory response lectin vs LPS dn Charafe breast cancer luminal vs basal Dn Rutella response to Hgf up Nakamura tumor zone peripheral vs central Dn Nuytten Ezh2 targets up Krige response to tosedostat 24 hr up Brocke apoptosis reversed by 116 Negative regulation of nucleobase nucleoside nucleotide and nucleic acid metabolic process Negative regulation of transcription Nucleobasenucleosidenucleotide and nucleic acid metabolic process Chr5p13
All curated gene sets Computational gene sets Gene ontology (GO) Positional gene sets
0 2 4 6 8
Figure 4 hATseQ results for the sTAT1 case study.
Notes: ThehATseQ results of the sTAT1 experiments using iFn-γ stimulated human hela s3 cells compared to seven unstimulated human hela s3 cells. (A) Bar graph plot that illustrates an rOi that is detected in the promoter of STAT3, and seen across six experiments. The blue bars depict the total number of reads per base pair position, indicated by the left y-axis. The red line illustrates the read-depth significance score Q(g), which reports how often reads were part of the statistically significant region, indicated by the right y-axis. The green bar illustrates the binding site of the expected sTAT1 motif. (C) The top enriched motifs, among the 511 rOis detected across two or more replicates. (D) Circos plot illustrating the genes, for which the closest detected rOi is detected among two or more experiments. A line connects selected genes, based on the chromosomal location with the number of experiments that an rOi is detected in. The colors indicate the chromosomal location of the genes. (E) Pathway analysis illustrates the enrichment for curated gene-sets, computational gene-sets, gene ontology and positional gene-sets (with a maximum of ten gene-sets in each category).
Abbreviations: hATseQ,hypergeometric analysis of tiling-array and sequence data; iFn, interferon; rOi, region of interest; UCsC, University of California, santa Cruz; sTAT1, signal Transducer and Activator of Transcription 1.
Advances and Applications in Bioinformatics and Chemistry downloaded from https://www.dovepress.com/ by 118.70.13.36 on 19-Aug-2020
Dovepress hATseQ
STAT1, it has been described that it binds to STAT motifs,27 and
a well-known target gene is the STAT3 gene.28 We compared
data obtained from six interferon-γ (IFN-γ) stimulated HeLa
S3 cells and compared those to seven unstimulated human
HeLa S3 cells. After the alignment using BWA,16 we detected
in total 2,502 ROIs with HATSEQ (sizes between 11 nt and
669 nt, median: 81 nt) using default parameter settings (α
#0.05 and read-depth $10). These ROIs showed significant
binding in the stimulated cells but not in the unstimulated cells, which were subsequently investigated using HATSEQ’s motif analysis. Thus, from the design of the experiment, it is expected that the detected ROIs should contain STAT bind-ing sites. The detected motifs, among the sequences of the 2,502 ROIs correspond to the STAT1 motif according to our
results (P-value ,9.1 × 10−6), and also according to MEME
(Multiple EM for Motif Elicitation)29 and TOMTOM.30 The
2,502 detected ROIs are annotated with 914 unique genes.
These 914 genes included the STAT3 gene, which was
asso-ciated with one of the most significantly detected ROI. This ROI was also strongly enriched for the STAT1 motif sequence
(P-value ,2.13 × 10−177, Figure 4A and B). However, not all
detected ROIs contained the STAT binding site. Therefore we searched for ROIs that were detected across two or more replicates. We found 511 ROIs that were consistently detected, ie, in two or more replicates (Figure 4D). The HATSEQ motif analyses on these 511 consistently detected ROIs showed a strong enrichment for the STAT binding site (Figure 4C), and it was seen in 88% of these ROIs. In addition, using HATSEQ we found 47 enriched MSigDB pathways for these
511 ROIs including a pathway that involve STAT3 and its
targets (Figure 4E).
Conclusion
In this study we present HATSEQ, a tool to analyze both tiling-array and NGS data. We applied HATSEQ to analyze a STAT1 ChIP-Sequence experiment and detected ROIs that were enriched for the STAT1 motif. In addition, we detected unknown as well as previously reported direct target genes
of STAT1: STAT2,31STAT3,28IRF1,32IL-27,33PTK2,34 and
IFNAR2.35 HATSEQ can be used for single sample analysis
or with a set of reference samples whereas the expected regions of interest can be of any size. We showed for both the C/EBPA and H3K4me ChIP-Seq experiments that HATSEQ better delineates the peak boundaries. HATSEQ is a powerful tool with an intuitive GUI that lowers the bar-rier for researchers to detect regions of interest in genomic signals, and integrates an analysis of these detected regions to enhance their functional role.
Availability
The HATSEQ program is freely available on http://
hema13.erasmusmc.nl/index.php/HATSEQ or http://www. erasmusmc.nl/hematologie/. The required Matlab Compiler Runtime (MCR) executable is provided.
Author contributions
ET designed and developed the software, analyzed and interpreted the data, and drafted the manuscript. ET, RD, and MJTR participated in the design of the study and con-tributed to the writing of the paper. RH implemented an enhanced version of the back-end and contributed to writing of the manuscript. All authors provided relevant input at different stages of the project, and read and approved the final manuscript.
Acknowledgments
This research is funded by the Center for Translational Molecular Medicine, project BioCHIP (grant 03O-102). We thank F Lesmana for her contribution in the development of the GUI.
Disclosure
The authors report no conflicts of interest in this work.
References
1. Taskesen E, Beekman R, de Ridder J, et al. HAT: hypergeometric analysis of tiling-arrays with application to promoter-GeneChip data.
BMC Bioinformatics. 2010;11:275.
2. Beekman R, Valkhof M, Erkeland SJ, et al. Retroviral integration mutagenesis in mice and comparative analysis in human AML iden-tify reduced PTP4A3 expression as a prognostic indicator. PLoS One. 2011;6(10):e26537.
3. Kim CK, Kikuchi S, Hahn JH, Park SC, Kim YH, Lee BW. Computational identification of anthocyanin-specific transcription fac-tors using a rice microarray and maximum boundary range algorithm.
Evol Bioinform Online. 2010;6:133–141.
4. Zhang Y, Liu T, Meyer CA, et al. Model-based analysis of ChIP-Seq (MACS). Genome Biol. 2008;9(9):R137.
5. Fejes AP, Robertson G, Bilenky M, Varhol R, Bainbridge M, Jones SJ. FindPeaks 3.1: a tool for identifying areas of enrichment from massively parallel short-read sequencing technology. Bioinformatics. 2008;24(15): 1729–1730.
6. Ji H, Jiang H, Ma W, Johnson DS, Myers RM, Wong WH. An integrated software system for analyzing ChIP-chip and ChIP-seq data. Nat Biotechnol. 2008;26(11):1293–1300.
7. Valouev A, Johnson DS, Sundquist A, et al. Genome-wide analysis of transcription factor binding sites based on ChIP-Seq data. Nat Methods. 2008;5(9):829–834.
8. Rozowsky J, Euskirchen G, Auerbach RK, et al. PeakSeq enables systematic scoring of ChIP-seq experiments relative to controls. Nat Biotechnol. 2009;27(1):66–75.
9. Wilbanks EG, Facciotti MT. Evaluation of algorithm performance in ChIP-seq peak detection. PLoS One. 2010;5(7):e11471.
10. Krzywinski M, Schein J, Birol I, et al. Circos: an information aesthetic for comparative genomics. Genome Res. 2009;19(9):1639–1645.
Advances and Applications in Bioinformatics and Chemistry downloaded from https://www.dovepress.com/ by 118.70.13.36 on 19-Aug-2020
Advances and Applications in Bioinformatics and Chemistry
Publish your work in this journal
Submit your manuscript here: http://www.dovepress.com/advances-and-applications-in-bioinformatics-and-chemistry-journal
Advances and Applications in Bioinformatics and Chemistry is an inter-national, peer-reviewed open-access journal that publishes articles in the following fields: Computational biomodeling; Bioinformatics; Compu-tational genomics; Molecular modeling; Protein structure modeling and structural genomics; Systems Biology; Computational Biochemistry;
Computational Biophysics; Chemoinformatics and Drug Design; In silico ADME/Tox prediction. The manuscript management system is completely online and includes a very quick and fair peer-review system, which is all easy to use. Visit http://www.dovepress.com/testimonials.php to read real quotes from published authors.
Dovepress
Dove
press
Taskesen et al
11. Johnson WE, Li W, Meyer CA, et al. Model-based analysis of tiling-arrays for ChIP-chip. Proc Natl Acad Sci U S A. 2006;103(33): 12457–12462.
12. Subramanian A, Tamayo P, Mootha VK, et al. Gene set enrichment analysis: a knowledge-based approach for interpreting genome-wide expression profiles. Proc Natl Acad Sci U S A. 2005;102(43):15545–15550. 13. Benjamini Y, Drai D, Elmer G, Kafkafi N, Golani I. Controlling the
false discovery rate in behavior genetics research. Behav Brain Res. 2001;125(1–2):279–284.
14. Hochberg Y. A sharper Bonferroni procedure for multiple tests of significance. Biometrika. 1988;75(4):2.
15. Cristianini N, Hahn MW. Introduction to computational genomics: A case studies approach. Cambridge: Cambridge University Press; 2007.
16. Li H, Durbin R. Fast and accurate long-read alignment with Burrows-Wheeler transform. Bioinformatics. 2010;26(5):589–595.
17. Zhang P, Iwama A, Datta MW, Darlington GJ, Link DC, Tenen DG. Upregulation of interleukin 6 and granulocyte colony-stimulating factor receptors by transcription factor CCAAT enhancer binding protein alpha (C/EBP alpha) is critical for granulopoiesis. J Exp Med. 1998;188(6):1173–1184.
18. Wouters BJ, Jordà MA, Keeshan K, et al. Distinct gene expression profiles of acute myeloid/T-lymphoid leukemia with silenced CEBPA and mutations in NOTCH1. Blood. 2007;110(10):3706–3714. 19. Bonora-Centelles A, Jover R, Mirabet V, et al. Sequential hepatogenic
transdifferentiation of adipose tissue-derived stem cells: relevance of different extracellular signaling molecules, transcription factors involved, and expression of new key marker genes. Cell Transplant. 2009;18(12):1319–1340.
20. Hon GC, Hawkins RD, Ren B. Predictive chromatin signatures in the mammalian genome. Hum Mol Genet. 2009;18(R2):R195–R201. 21. Wu CY, Tsai YP, Wu MZ, Teng SC, Wu KJ. Epigenetic reprogramming
and post-transcriptional regulation during the epithelial-mesenchymal transition. Trends Genet. 2012;28(9):454–463.
22. Hartigan JA, Hartigan, PM. The Dip Test of Unimodality. Ann Stat. 1985;13(1):14.
23. Sati S, Tanwar VS, Kumar KA, et al. High resolution methylome map of rat indicates role of intragenic DNA methylation in identification of coding region. PLoS One. 2012;7(2):e31621.
24. Stitzel ML, Sethupathy P, Pearson DS, et al; NISC Comparative Sequencing Program. Global epigenomic analysis of primary human pancreatic islets provides insights into type 2 diabetes susceptibility loci. Cell Metab. 2010;12(5):443–455.
25. Li N, Ye M, Li Y, et al. Whole genome DNA methylation analysis based on high throughput sequencing technology. Methods. 2010;52(3): 203–212.
26. Robertson G, Hirst M, Bainbridge M, et al. Genome-wide profiles of STAT1 DNA association using chromatin immunoprecipitation and massively parallel sequencing. Nat Methods. 2007;4(8):651–657. 27. Ehret GB, Reichenbach P, Schindler U, et al. DNA binding specificity
of different STAT proteins. Comparison of in vitro specificity with natural target sites. J Biol Chem. 2001;276(9):6675–6688.
28. Gunaje JJ, Bhat GJ. Involvement of tyrosine phosphatase PTP1D in the inhibition of interleukin-6-induced Stat3 signaling by alpha-thrombin.
Biochem Biophys Res Commun. 2001;288(1):252–257.
29. Bailey TL, Elkan C. Fitting a mixture model by expectation maximiza-tion to discover motifs in biopolymers. Proc Int Conf Intell Syst Mol Biol. 1994;2:28–36.
30. Gupta S, Stamatoyannopoulos JA, Bailey TL, Noble WS. Quantifying similarity between motifs. Genome Biol. 2007;8(2):R24.
31. Li X, Leung S, Qureshi S, Darnell JE, Stark GR. Formation of STAT1-STAT2 heterodimers and their role in the activation of IRF-1 gene tran-scription by interferon-alpha. J Biol Chem. 1996;271(10):5790–5794. 32. Chatterjee-Kishore M, van Den Akker F, Stark GR. Adenovirus E1A
down-regulates LMP2 transcription by interfering with the binding of stat1 to IRF1. J Biol Chem. 2000;275(27):20406–20411.
33. Takeda A, Hamano S, Yamanaka A, et al. Cutting edge: role of IL-27/ WSX-1 signaling for induction of T-bet through activation of STAT1 dur-ing initial Th1 commitment. J Immunol. 2003;170(10):4886–4890. 34. Xie B, Zhao J, Kitagawa M, et al. Focal adhesion kinase activates
Stat1 in integrin-mediated cell migration and adhesion. J Biol Chem. 2001;276(22):19512–19523.
35. Li X, Leung S, Kerr IM, Stark GR. Functional subdomains of STAT2 required for preassociation with the alpha interferon receptor and for signaling. Mol Cell Biol. 1997;17(4):2048–2056.
Advances and Applications in Bioinformatics and Chemistry downloaded from https://www.dovepress.com/ by 118.70.13.36 on 19-Aug-2020