The Techniques of Creating SPICE Models of Complex
Test Signals According to their Mathematical
Description at Given Time Intervals
.
Tapan Kuamr Mohanta
1, A.V.Svetlov
2, Purajit Mishra
3Assistant professor, Dept. of ECE, ICFAI Univesity,Agartala,Tripua, India1
HOD, Dept. of Radio Electronic Systems/ECE, Penza State University, Russia2
Principal, Mits, Bhubaneswar, Odissa, India3
ABSTRACT: When a step signal is applied directly to a differentiating measuring circuit, the out-put of the differentiator will give rise to voltage spikes of large amplitudes, which may damage the succeeding cascade. Thus, it was thought to apply slowly changing signals (complex test signals)to the input of the differentiating measuring circuit, as such, voltage spikes of large amplitudes will not be generated at output of the differentiator and the succeeding cascade will not be damaged. The problems of creating Spice models of complex test signal is analyzed for simulation of measuring circuits using circuit simulation programs.. The method of creating SPICE models of complex test signals in given arbitrary mathematical expressions proposed.
KEYWORDS: Complex test signals, measuring circuit, simulation,Spice-models, differentiating circuit.
I.INTRODUCTION
In the present day Hardware –software measurement systems, complex test signal can be applied to measuring circuits .For example, a complex test signal which is continuously differentiable on the borders of the measuring intervals can be applied to a differentiating measuring circuit .That signal will not cause voltage spikes of large amplitudes in the differentiating measuring circuit, which may exceed the maximum output voltage of the operational amplifier in the measuring circuit. Thus, the limitation of the amplitude of the output voltage does not exist and there is no time delay.
II. CREATING SPICE MODEL
Complex test signals can be generated using Analog to Digital converters, which is a part of multifunctional data acquisition boards of the company National Instruments. In the graphical programming environment, Lab VIEW creates the program for controlling the process of generation of voltages described by their mathematical models for specific time intervals. While simulating measuring circuits with input complex test signals, there arise problems due to the limitation of selecting standard functions accounting to most frequently used circuit simulation programs like PSpice, OrCAD, MultiSim etc [1]. The proposed method of creating Spice models of pulse signals in complex form, given in an arbitrary mathematical description is described below.
III. SPICE MODELMETHOD INCLUDES THE FOLLOWING STEPS
1. The period of the test signal (or the duration of a single test signal) is represented as a sequence of measuring and additional time intervals. Based on the conditions of the problem being solved, measurement, control or test, given the number of measuring intervals of the test signal, the signal type and parameters of each of them, constitute the mathematical description of the signal during measuring intervals.
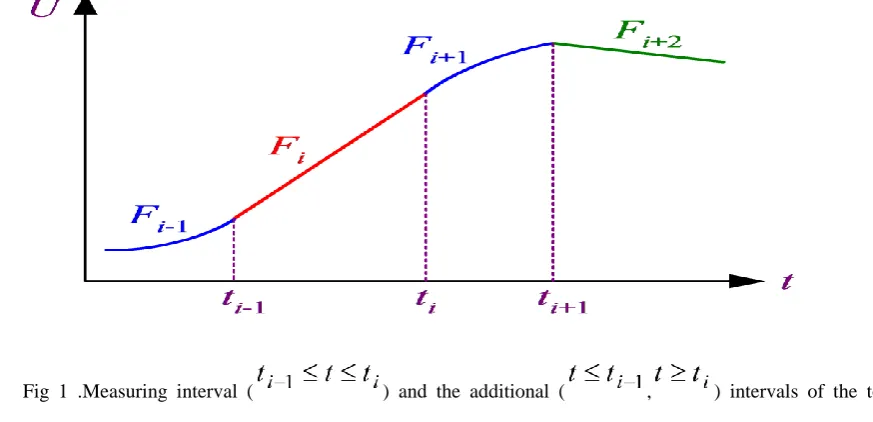
2.1 On the general borders of the measuring interval l (in fig 1: ) and intervals, preceding to it
( ) and succeeding to it( ) , the signal has to be continuously differentiable [2], i.e. conditions of equality of functions and equality of their first derivatives on the common borders of adjacent intervals have to be satisfied:
(1)
2.2 On the common border of additional intervals (in figure 1) requirements can be less strict: the signal can be piecewise and smooth, i.e. function is continuous, and its derivative is piecewise continuous:
(2)
This follows to take measures to reduce the spikes of the derivative function at the boarders of the additional intervals.
Fig 1 .Measuring interval ( ) and the additional ( , ) intervals of the test signal
, , ..., , ... , in n specified time intervals :
.
for
.
.
.
.
.
.
.
.
.
.
.
.
.
.
.
.
;
for
.
.
.
.
.
.
.
.
.
.
.
.
.
.
.
.
;
for
;
0
for
1 1 2 1 2 1 1 n n n i i i
t
t
t
t
F
t
t
t
t
F
t
t
t
t
F
t
t
t
F
t
u
(3)4.On the common boarder of the first measuring interval and the additional interval preceding to it, the system equations are formed as described in condition (1) i.e. equalities of functions and equality their first derivatives. By solving the system equations and substituting the signal parameters on the first measuring interval, the signal parameters on the preceding time interval is calculated.
5. Similarly the system equations are formed on the common boarder of the first measuring interval and the additional interval succeeding to it, which gives the signal parameters in this interval by solving the system equations. Further repetition of the described steps allows us determining signal parameters on all subsequent intervals
6. For creation of Spice-model of the pulse signal which is consistently described by mathematical functions ,
, ..., , ... , on n defined time intervals , ..., , ... , , the above functions are sampled at the respective time intervals and their results are added.
(4)
Where, , , ..., , ... , – strobe functions.
At the initial time interval from 0 to the strobe function must be of the form
(5)
At every subsequent i-th interval from to :
As strobe functions are available in Spice compatible simulation programs and can be used as a standard function [3]:
(7)
Simulation of a function is possible using a controlled voltage source (E), transfer functions of which are defined by algebraic expressions depending on the time.
A segment of test assignment written in P-Spice, for simulation of a complex test signal is shown below.
E1 1 0 VALUE={STP(T1-TIME)*F1(TIME)}
E2 2 0 VALUE={(STP(TIME-T1)-STP(TIME-T2))*F2(TIME-T1)} . . . . Ei i 0 VALUE={(STP(TIME-Ti-1)-STP(TIME-Ti))*Fi (TIME-Ti-1)} . . . . En n 0 VALUE={(STP(TIME-Tn-1)-STP(TIME-Tn))*Fn(TIME-Tn-1)} En+1 n+1 0 VALUE={V(1)+V(2)+ …+V(i)+ …+V(n)}
As an example we consider the voltage of the complex test signals represented in the given time intervals in the next mathematical expressions.
,
for
),
1
(
,
for
,
)
(
,
for
,
)
1
(
,
for
,
)
1
(
,
for
,
)
(
,
for
,
)
1
(
,
0
for
,
0
6 5 4 5 5 4 4 2 4 4 3 3 3 3 2 2 2 2 1 1 1 1 1 0 1 0 4 5 3 3 2 2 1 0t
t
t
e
A
U
t
t
t
t
t
S
U
t
t
t
e
A
U
t
t
t
e
A
U
t
t
t
t
t
S
U
t
t
t
e
A
t
t
t
u
t t t t t t t t (8)Where, , , , , , , , – are the amplitudes and the exponentially changing time constants of the voltage components respectively;
, , , , – are the voltage value at the respective time intervals , , , , ;
IV. RESULTS
The time diagram of the voltages expressed in expression (8) is shown in fig -2
The boundaries of the time intervals and the final voltage values at those intervals are indicated in the diagram.
Fig-2, Time diagram of the signal given by equation (8)
A segment of a text job modeling of this signal composed in the source language program P Spice is as follows:
E1 1 0 VALUE={STP(T1-TIME)*A1*(EXP(TIME/TAU1)-1)}
E2 2 0 VALUE={(STP(TIME-T1)-STP(TIME-T2))*(U1+S1*(TIME-T1))}
E3 3 0 VALUE={(STP(TIME-T2)-STP(TIME-T3))*(U2+A2*(1-EXP(-((TIME-T2)/TAU2))))} E4 4 0 VALUE={(STP(TIME-T3)-STP(TIME-T4))*(U3-A3*(EXP((TIME-T3)/TAU3)-1))} E5 5 0 VALUE={(STP(TIME-T4)-STP(TIME-T5))*(U4-S2*(TIME-T4))}
E6 6 0 VALUE={(STP(TIME-T5)-STP(TIME-T6))*(U5-A4*(1-EXP(-((TIME-T5)/TAU4))))} E7 7 0 VALUE={V(1)+V(2)+V(3)+V(4)+V(5)+V(6)}
VI.CONCLUSION
REFERENCES
1. John Keown. OrCAD PSpice and Circuit Analysis. – Prentce Hall. Upper Saddie River, New Jersey, 2001.
2. Granino A. Korn, Theresa M. Korn. Mathematical Handbook for Scientists and Engineers: Definitions, Theorems, and Formulas for Reference and Review. – McGraw-Hill Book Company, 1968.