Development
of
a
Water
Sustainability
Index
for
West
Java,
Indonesia
Iwan Juwana
Thesis submitted in fulfilment of the requirements for the degree of
Doctor of Philosophy
School of Engineering and Science
Faculty of Health, Engineering and Science
Victoria University, Australia
Abstract
Sustainability of water resources is essential to ensure that available water can be used by both
present and future generations. To ensure sustainability, a comprehensive knowledge of the current
conditions of water resources is necessary. Once this information is obtained, relevant programs can
be designed to improve the quality and use of water resources. A water sustainability index is a
useful tool to obtain information on the current conditions of water resources. It can also be used to
identify all factors contributing to these conditions, to assist decision makers prioritising water
issues, to design programs related to water resource improvement, and to communicate the current
status of existing water resources to the general community.
In the recent past, several indices related to water resource sustainability have been developed.
Even though there have been some successful experiences with the implementation of existing
sustainability indices, they are not fully applicable in other regions or countries, since most of these
indices have been developed for specific regions or countries. This study aims at developing a new
water sustainability index for West Java, Indonesia, which can be used as a tool to improve the
management of water resources in West Java. The development of the West Java Water
Sustainability Index (WJWSI) involved the design of the conceptual framework, the application of
Delphi technique to refine and finalise the conceptual framework, the application of WJWSI in three
West Java catchments, and finally the robustness analysis of WJWSI through uncertainty and
sensitivity analysis.
Results of WJWSI applications provided information on the current conditions of water resources, as
well as the priority of water issues, in these three catchments. This information can be used by
relevant water authorities in respective catchments to design appropriate programs to improve the
conditions of water resources. This index can be applied to all catchments in West Java and, with
some modifications, can also be applied in catchments in other provinces in Indonesia and
Declaration
I, Iwan Juwana, declare that the PhD thesis entitled ‘Development of a Water Sustainability Index for
West Java, Indonesia’ is no more than 100,000 words in length including quotes and exclusive of
tables, figures, appendices, references and footnotes.
This thesis contains no material that has been submitted previously, in whole or in part, for the
award of any other academic degree or diploma. Except where otherwise indicated, this thesis is my
own work.
Iwan Juwana
March 2012
Acknowledgments
First of all, praise be to Allah, Lord of the Worlds.
This thesis is the result of a long PhD study journey that would have not been completed without the
support from numerous outstanding people. I would like to express my deep appreciation to those
people for their support during the period of this study and thesis writing.
Professor Chris Perera has been the strongest academic support for the completion of this study.
Since the very early discussion on the topic of this study until the last day of the thesis completion,
he provided guidance, wisely and patiently, that allowed me to develop my scholarly skills. During
the discussions, he always maintained the balance of providing his valuable comments and
encouraging me to express my own thoughts and ideas. His comments on my papers during the
study have reflected not only his suggestions on the papers, but also his commitment, interest and
dedication to the academic world.
I would like to thank Dr. Nitin Muttil, my associate supervisor, for the efforts and time spent for
providing suggestions and comments on both the journal papers and the thesis report.
I would also like to express my gratitude to AusAid for the Australian Development Scholarship (ADS)
Program. The support provided by ADS prior to my departure to Australia and during my stay in
Australia has taken me to the completion this study.
I would like to thank Dr Diane Brown for copy editing my thesis according to the Australian Standards for Editing Practice (Standards D and E).
Finally, to my wife, Astri, and my 17‐month‐old son, Ayeman. I am deeply grateful for their endless
support, encouragement and for always being there, comforting my ups and downs with their
sincere love and patience. This journey would have not been as adventurous and memorable
Table of Contents
Abstract ... i
Declaration ... ii
Acknowledgments ... iii
Table of Contents ... iv
List of Tables ... vii
List of Figures ... viii
Abbreviations ... ix
Published Manuscripts ... x
CHAPTER 1: INTRODUCTION
1.1 BACKGROUND ... 1‐1 1.2 AIMS OF THE RESEARCH ... 1‐3 1.3 SIGNIFICANCE OF THE RESEARCH ... 1‐3 1.4 RESEARCH METHODOLOGY ... 1‐4 1.5 THESIS STRUCTURE ... 1‐7
CHAPTER 2: INDICATOR‐BASED SUSTAINABILITY ASSESSMENT
2.1 INTRODUCTION ... 2‐1 2.2 SUSTAINABLE DEVELOPMENT DEFINITIONS AND SUSTAINABILITY PRINCIPLES... 2‐3 2.3 SUSTAINABLE WATER RESOURCE MANAGEMENT: DEFINITIONS, CRITERIA AND GUIDELINES ... 2‐6 2.4 ELEMENTS OF INDICATOR‐BASED SUSTAINABILITY ASSESSMENT ... 2‐9 2.4.1 Selection of components and indicators ... 2‐10
2.4.2 Obtaining sub‐index values ... 2‐12
2.4.3 Weights ... 2‐18
2.4.4 Aggregation ... 2‐19
2.4.5 Robustness analysis ... 2‐23
2.5 EXISTING WATER SUSTAINABILITY INDICES ... 2‐23 2.5.1 Water Poverty Index (WPI) ... 2‐24
2.5.1.1 Selection of component and indicators ... 2‐24
2.5.1.2 Obtaining sub‐index values ... 2‐25
2.5.1.3 Weighting ... 2‐25
2.5.1.4 Aggregation... 2‐26
2.5.1.5 Final index value interpretation ... 2‐26
2.5.2 Canadian Water Sustainability Index (CWSI) ... 2‐27
2.5.2.1 Selection of components and indicators ... 2‐27
2.5.2.2 Obtaining sub‐index values ... 2‐28
2.5.2.3 Weighting ... 2‐29
2.5.2.4 Aggregation... 2‐29
2.5.2.5 Final index value interpretation ... 2‐29
2.5.3 Watershed Sustainability Index (WSI) ... 2‐30
2.5.3.1 Selection of components and indicators ... 2‐30
2.5.3.2 Obtaining sub‐index values ... 2‐32
2.5.3.3 Weighting ... 2‐32
2.5.3.4 Aggregation... 2‐32
2.5.3.5 Final index value interpretation ... 2‐33
2.5.4 Comparative analysis of water sustainability indices ... 2‐33
2.6.1.2 Obtaining sub‐index values ... 2‐36
2.6.1.3 Weighting of dimensions and indicators ... 2‐36
2.6.1.4 Aggregation of dimensions and indicators ... 2‐37
2.6.1.5 Final index value interpretation ... 2‐37
2.6.2 Environmental Sustainability Index ... 2‐38
2.6.2.1 Selection of indicators and variables ... 2‐38
2.6.2.2 Obtaining sub‐index values ... 2‐40
2.6.2.3 Weighting of variables and indicators ... 2‐40
2.6.2.4 Aggregation of indicators and variables ... 2‐41
2.6.2.5 Robustness analysis ... 2‐41
2.6.2.6 Final index value interpretation ... 2‐42
2.7 SUMMARY ... 2‐43
CHAPTER 3: DEVELOPMENT OF WEST JAVA WATER SUSTAINABILITY INDEX
3.1 INTRODUCTION ... 3‐1
3.2 CONCEPTUAL FRAMEWORK ... 3‐3
3.2.1 Identification of Components, Indicators and Thresholds ... 3‐3 3.2.2 Justification for the Selection of Components, Indicators and Thresholds ... 3‐8 3.2.2.1 Justification for the Component Water Resources and its Indicators and Thresholds ... 3‐8
3.2.2.2 Justification for the Component Water Provision and its Indicators and Thresholds ... 3‐11
3.2.2.3 Justification for the Component Capacity and its Indicators and Thresholds ... 3‐13
3.2.2.4 Justification for the Component Human Health and its Indicators and Thresholds ... 3‐14
3.3 FINAL FRAMEWORK ... 3‐16
3.3.1 The Delphi Technique ... 3‐16 3.3.2 Identification of Water‐related Stakeholders ... 3‐19 3.3.3 Design of the Questionnaires ... 3‐20 3.3.4 Method to Analyse the Responses of the Respondents ... 3‐21 3.3.5 Distribution and Collection of Completed Questionnaires ... 3‐22 3.3.5.1 Round One of the Delphi Application ... 3‐22
3.3.5.2 Round Two of the Delphi Application ... 3‐29
3.3.6 In‐Depth Interview with Key stakeholders ... 3‐33 3.4 WEIGHTING ... 3‐36
3.4.1 Equal Weighting ... 3‐37 3.4.2 Non‐equal Weighting ... 3‐37 3.4.2.1 The procedure ... 3‐38
3.4.2.2 Results and Calculations ... 3‐38
3.4.3 Weights Given by Different Respondent Groups ... 3‐41 3.5 INDEX INTERPRETATION ... 3‐44
3.6 SUMMARY ... 3‐45
CHAPTER 4: APPLICATION OF WEST JAVA WATER SUSTAINABILITY INDEX
4.1 INTRODUCTION ... 4‐1
4.2 METHODOLOGY USED FOR APPLICATIONS ... 4‐2
4.2.1 Obtaining Sub‐index Values ... 4‐2 4.2.2 Final Index ... 4‐5 4.2.3 Robustness Analysis ... 4‐6 4.3 WEST JAVA ... 4‐12
4.3.1 Climatic Conditions ... 4‐13 4.3.2 Socio‐Economic Conditions ... 4‐13 4.3.3 Water Management ... 4‐14 4.3.3.1 Water Authorities ... 4‐15
4.3.3.2 Policies and Regulations ... 4‐16
4.4.2.1 Sub‐index Values and Final index ... 4‐22
4.4.2.2 Robustness Analysis of WJWSI ... 4‐27
4.4.3 Application for Different Years ... 4‐33 4.4.4 Recommendations for Water Authorities ... 4‐37 4.5 CILIWUNG CATCHMENT ... 4‐40 4.5.1 Description of the Catchment ... 4‐40 4.5.2 Application of WJWSI for 2006, 2007 and 2008 ... 4‐42 4.5.2.1 Sub‐index Values and Final index ... 4‐42
4.5.2.2 Robustness Analysis of WJWSI ... 4‐48
4.5.2.3 Recommendations for Water Authorities ... 4‐52
4.6 CITANDUY CATCHMENT ... 4‐55
4.6.1 Description of the Catchment ... 4‐55 4.6.2 Application of WJWSI for 2006, 2007 and 2008 ... 4‐57 4.6.2.1 Sub‐index Values and Final index ... 4‐57
4.6.2.2 Robustness Analysis of WJWSI ... 4‐60
4.6.2.3 Recommendations for Water Authorities ... 4‐63
4.7 CORRELATION ANALYSIS OF INDICATORS AND SUB‐INDICATORS ... 4‐65
4.8 COMPARATIVE ANALYSIS OF RESULTS OF DIFFERENT CATCHMENTS ... 4‐68
4.9 SUMMARY ... 4‐71
CHAPTER 5: CONCLUSIONS AND RECOMMENDATIONS
5.1 SUMMARY ... 5‐1
5.2 CONCLUSIONS AND RECOMMENDATIONS TO WATER AUTHORITIES ... 5‐3
5.2.1 Conceptual Framework of WJWSI ... 5‐4 5.2.2 The Use of Delphi Technique ... 5‐4 5.2.3 In‐depth Interview with Selected Key Stakeholders ... 5‐4 5.2.4 Weights for Indicators and Sub‐indicators ... 5‐5
5.2.5 Uncertainty and Sensitivity of the Index ... 5‐5
5.2.6 Correlation of Indicators and sub‐indicators ... 5‐6 5.3 RECOMMENDATIONS TO WATER AUTHORITIES ... 5‐7 5.3.1 The Citarum Catchment ... 5‐8
5.3.2 The Ciliwung Catchment ... 5‐9
5.3.3 The Citanduy Catchment ... 5‐10
5.4 RECOMMENDATIONS FOR FURTHER RESEARCH ... 5‐11
REFERENCES ... 6‐1
APPENDICES
APPENDIX A: QUESTIONNAIRE OF ROUND ONE – DELPHI TECHNIQUE APPLICATION ... A‐1 APPENDIX B: QUESTIONNAIRE OF ROUND TWO – DELPHI TECHNIQUE APPLICATION ... B‐1 APPENDIX C: INTERVIEW GUIDE FOR IN‐DEPTH INTERVIEWS WITH KEY STAKEHOLDERS ... C‐1 APPENDIX D: WEIGHTING SCHEME QUESTIONNAIRE... D‐1
List of Tables
Table 2.1 Indicators of Water Poverty Index ... 2‐25 Table 2.2 Correlation coefficients of WPI, Falkenmark Water Stress Indicator and HDI ... 2‐26 Table 2.3 Indicators of Canadian Water Sustainability Index ... 2‐28 Table 2.4 Indicators of Watershed Sustainability Index ... 2‐31 Table 2.5 Obtaining sub‐index values for EPI parameter of WSI ... 2‐32 Table 2.6 Comparisons of CWSI, WPI and WSI ... 2‐34 Table 2.7 Interpretation of final HDI values ... 2‐38 Table 2.8 Cluster analysis based on values of ESI themes ... 2‐44
Table 3.1 Components and indicators of existing water sustainability indices ... 3‐5 Table 3.2 Regrouping of indicators of existing water sustainability indices ... 3‐6 Table 3.3 Conceptual framework of the WJWSI ... 3‐7 Table 3.4 Thresholds suggested in Round One ... 3‐27 Table 3.5 Modified WJWSI framework after Round One of Delphi application... 3‐28 Table 3.6 Framework of WJWSI as agreed after Delphi application Round Two ... 3‐33 Table 3.7 Final framework of WJWSI after the in‐depth interview ... 3‐36 Table 3.8 Weight calculation for one respondent ... 3‐40 Table 3.9 Normalised weights for 13 indicators and sub‐indicators from all respondents ... 3‐42 Table 3.10 Interpretations of sub‐indices and aggregated Index ... 3‐45
List of Figures
Figure 1.1 Thesis structure ... 1‐7
Figure 2.1 The prism of sustainability ... 2‐5 Figure 2.2 Illustration of the continuous rescaling method ... 2‐15 Figure 2.3 An example of use of the categorical scaling method ... 2‐16 Figure 2.4 Stages of aggregation of an index ... 2‐20 Figure 2.5 Comparisons of arithmetic and geometric aggregation methods ... 2‐22 Figure 2.6 The Pressure‐State‐Response (PSR) model ... 2‐31 Figure 2.7 The DPSIR model (Smeets et al., 1999) ... 2‐39
Figure 3.1 Flowchart for identification of potential components and indicators of WJWSI ... 3‐4 Figure 3.2 Percentage of responses agreed on components – Round One ... 3‐23 Figure 3.3 Percentage of responses agreed on indicators – Round One ... 3‐25 Figure 3.4 Percentage of responses agreed on thresholds – Round One ... 3‐26 Figure 3.5 Percentage of responses agreed on all components together – Round Two ... 3‐30 Figure 3.6 Percentage of responses agreed on indicators and sub‐indicators – Round Two ... 3‐31 Figure 3.7 Percentage of responses agreed on thresholds – Round Two ... 3‐32 Figure 3.8 Response of a respondent in the Revised Simos’ procedure ... 3‐39 Figure 3.9 Weights given by different groups of respondents ... 3‐43
Figure 4.1 Uncertainty and sensitivity analysis scheme for WJWSI ... 410 Figure 4.2 Distribution function for Water Availability ... 4‐11 Figure 4.3 West Java province ... 4‐13 Figure 4.4 Citarum catchment in West Java ... 4‐20 Figure 4.5 Sub‐index values of indicators and sub‐indicators for Citarum catchment ... 4‐36 Figure 4.6 Ciliwung catchment in West Java ... 4‐41 Figure 4.7 Sub‐index values of indicators and sub‐indicators for Ciliwung catchment ... 4‐47 Figure 4.8 The Citanduy catchment in West Java ... 4‐56 Figure 4.9 Sub‐index values of indicators and sub‐indicators for Citanduy catchment ... 4‐58 Figure 4.10 Scatter plot of data points of sub‐index values of Poverty and Sanitation ... 4‐68 Figure 4.11 Scatter plot of data points between sub‐index Values of Coverage and Health Impact ... 4‐68 Figure 4.12 Sub‐index values of three West Java catchments for 2008 ... 4‐70
Abbreviations
The following list of abbreviations is used frequently in the thesis. The other abbreviations, which
were used only in particular sections, are defined in those sections.
WJWSI West Java Water Sustainability Index
WPI Water Poverty Index
CWSI Canadian Water Sustainability Index
WSI Watershed Sustainability Index
HDI Human Development Index
ESI Environmental Sustainability Index
MC Monte Carlo
PSR Pressure State Response
DPSIR Driving force Pressure State Impact Response
WSP Water Service Provider
Published Manuscripts
The following manuscripts were published or under review on journals and conferences, which
materials were taken from this thesis:
Juwana, I., Muttil, N., & Perera, B. J. C. (2012). Application of West Java Water Sustainability Index (WJWSI) in Three Water Catchments. Paper in preparation for Science of the Total Environment: An International Journal for Scientific Research into the Environment and its Relationship with Humankind.
Juwana, I., Muttil, N., & Perera, B. J. C. (2012). Indicator‐based Water Sustainability Assessment – A Review. Paper under review in Science of the Total Environment: An International Journal for Scientific Research into the Environment and its Relationship with Humankind.
Juwana, I., Muttil, N., & Perera, B. J. C. (2012). Application and robustness analysis of West Java water sustainability index Citarum catchment. Paper under review in Water science and technology: a journal of the International Association on Water Pollution Research.
Juwana, I., Muttil, N., & Perera, B. J. C. (2011). Application of West Java water sustainability index in Citarum catchment. Paper presented at the 20th World IMACS/MODSIM Congress 12‐16 December 2011, Perth, Australia.
Juwana, I., Perera, B., & Muttil, N. (2010a). A water sustainability index for West Java ‐ Part 1: developing the conceptual framework. Water science and technology: a journal of the International Association on Water Pollution Research, 62(7), 1629‐1640.
Juwana, I., Perera, B., & Muttil, N. (2010b). A water sustainability index for West Java ‐ Part 2: refining the conceptual framework using Delphi technique. Water science and technology: a journal of the International Association on Water Pollution Research, 62(7), 1641‐1652.
Juwana, I., Perera, B. J. C., & Muttil, N. (2009). Application of Delphi Technique for Development of a Water Sustainability Index for West Java, Indonesia. Paper presented at the 32nd Hydrology and Water Symposium 30 November ‐ 3 December 2009, Newcastle, Australia.
Juwana, I., Perera, B. J. C., & Muttil, N. (2009). Conceptual framework for the development of West Java water sustainability index. Paper presented at the 18th World IMACS/MODSIM Congress 13‐17 July 2009, Cairns, Australia.
Chapter 1
Introduction
1.1 BACKGROUND
“In an age when man has forgotten his origins and is blind even to his
most essential needs for survival, water along with other resources has
become the victim of his indifference” (Carson, 1962, p. 50)
The importance of water to living creatures is all too evident. Human beings, for example,
cannot live without water, even for a few days. Therefore, it is of utmost importance to
maintain the sustainability of water resources, so that these resources can be utilised by
humans and others, now and in the future. To maintain and improve the quality of water
resources, an adequate understanding of current conditions of such water resources is
required.
In one of the most densely populated provinces of Indonesia, West Java, the conditions of
water resources are poor. The increase in population in the province has resulted in the
increased demand for clean water. To fulfill the demand, both surface and groundwater
resources in West Java are utilised. Both resources are dependent on rainfall. The availability
of these water resources is abundant, due to high rainfall in most areas of West Java. However,
this abundance of water is not properly managed, and has resulted in water shortages in some
areas of the province (Rahmat & Wangsaatmadja, 2007). In terms of their quality, most surface
and groundwater resources in West Java are polluted by domestic, agricultural and industrial
activities. Regular monitoring by the Environmental Protection Agency (EPA) of West Java
during the period 2004–2006 showed that water quality parameters of most rivers in West
Java did not meet the requirements of provincial and national regulations (Rahmat &
In the last decade, the provincial government of West Java has implemented various programs
to improve the performance of water resources. However, these programs have not been
successful. The quality of surface water is decreasing and the quantity of groundwater is
depleting. The main cause for the failure of these programs is lack of awareness of the people
of West Java on the importance of water resources. In general, people in West Java are not
aware that valuable water resources are deteriorating and need to be sustained (Rahmat &
Wangsaatmadja, 2007).
It is therefore important to obtain a comprehensive understanding on the current status of
water resource conditions in West Java. Once this information has been obtained, relevant
programs can be designed to improve the quality of the water resources. A water sustainability
index is a useful tool to address this situation. Such an index comprises indicators related to
the sustainability of water resources, and offers the following benefits:
(i) It can be used to identify all factors contributing to the improvement of water resources
(Chaves & Alipaz, 2007; Policy Research Initiative, 2007; Sullivan, 2002), so that the
resources can be used to fulfill present and future needs.
(ii) It can be used to assist decision makers to prioritise issues and programs related to
water resource management.
(iii) It can be used to communicate the current status of existing water resources to the
wider community (Policy Research Initiative, 2007).
In the recent past, several indices related to water resource sustainability have been
developed. They are the Water Poverty Index (WPI) by Sullivan (2002), the Canadian Water
Sustainability Index (CWSI) by the Policy Research Initiative (2007), and the Watershed
Sustainability Index (WSI) by Chaves and Alipaz (2007). Even though there have been some
successful experiences with the implementation of these sustainability indices, they are not
fully applicable in other regions or countries, since they have been developed for use in
specific regions or countries.
Therefore, a new water sustainability index, which is specifically developed with the
index will be able to not only obtain information on current conditions of water resources in
West Java, but also to prioritise water issues in water resource management in West Java. The
prioritization of water issues is especially important since such prioritization were not found in
existing documents related to water resources management in West Java. This study was
aimed at developing a water sustainability index for the West Java Province, called the West
Java Water Sustainability Index (WJWSI).
1.2 AIMS OF THE RESEARCH
The aim of this study was to develop the West Java Water Sustainability Index (WJWSI), which
can be used as a tool to assess the sustainability of West Java water resources, prioritise water
issues, and communicate water issues to the wider community. The application of WJWSI in
West Java catchments will assist decision makers in the province to have better knowledge of
the overall water resource conditions, and to prioritise water-related issues and their
respective programs towards a more sustainable water resources management. The results of
WJWSI application will also be used to increase the awareness of the wider community and to
encourage them to participate in the improvement of water resource performance in West
Java.
1.3 SIGNIFICANCE OF THE RESEARCH
In the past few decades, the increased water demand in West Java Province has resulted in
excessive groundwater extractions, both by industries and households. This situation is
worsened by the increase of surface water pollution, caused by wastewater discharges by
industries, households and agriculture. Even though these water resource deteriorations are
evident, the awareness by people in West Java is poor due to a lack of understanding about
comprehensive conditions and the importance of those water resources.
The development of a West Java Water Sustainability Index (WJWSI) is proposed in this study
to meet the need to obtain comprehensive information on the conditions of water resources
West Java, as it provides a holistic tool to assess the current status of water-related issues, as
well as providing a tool for communicating water issues in the wider community. Having
communicated this message to the wider community about the status of water sustainability
in the area, they will become more aware of the conditions and therefore willing to participate
in the improvement of water resource performance.
The applications of WJWSI in West Java catchments will give decision makers information on
current conditions of water issues in the respective catchments. Consequently, these decision
makers will be able to design and deliver better programs to improve the overall water
resource management. In the near future, the developed index can also be modified for
application in other areas in Indonesia, as well as in other countries. Modifications might be
needed to include any unique characteristics of other areas, and ensure that the unique
characteristics are included in the calculation and analysis.
Furthermore, the Delphi technique used in this study offers new insights into the selection of
components and indicators of the water sustainability index, since the Delphi technique has
not been used in the selection of components and indicators of previous water sustainability
indices.
1.4 RESEARCH METHODOLOGY
The development of the WJWSI included the following tasks:
1. Design of the conceptual framework of WJWSI
2. Fieldwork preparation
3. Delphi application and results analysis
4. Applications of WJWSI in West Java catchments
5. Robustness analysis of WJWSI
Task 1 – Design of the conceptual framework of WJWSI
The conceptual framework of WJWSI includes the identification of components, indicators and
thresholds of indicators. The components and indicators were identified, based on the
existing water sustainability indices of WPI, CWSI and WSI. The relevancy of these
components and indicators to water resources, environmental, social and economic
characteristics of West Java, and the availability of data for use in the index applications were
also considered. Once the components and indicators were identified, thresholds for the
indicators were obtained from relevant policies, regulations and guidelines.
Task 2 – Fieldwork preparation
Fieldwork in Indonesia consisted of two parts: the Delphi application and WJWSI applications
in West Java catchments. In this study, the Delphi technique was used to refine the
components, indicators and thresholds identified in the literature review (i.e. Task 1). The
preparation for the Delphi technique application included identifying stakeholders as
respondents, making initial contact with stakeholders and preparing questionnaires. The
stakeholders who participated in this study were selected from university lecturers,
governmental officials, environmental consultants and community groups. For applications of
WJWSI in West Java catchments, the preparation included identifying potential areas for
application and contact persons for collecting data related to the catchments. The
identification of contact persons is important to ensure that the required data for the WJWSI
applications are available during fieldwork.
Task 3 – Delphi application and results analysis
As indicated earlier, the Delphi technique was used in this study to seek opinions from
water-related stakeholders in West Java on the identified components, indicators and thresholds of
WJWSI. Steps undertaken in the Delphi application included revising the list of selected
stakeholders (where applicable), distributing series of questionnaires, and analysing the
information obtained through these questionnaires. In this study, the main questions for the
initial questionnaire focused on the components, indicators and thresholds emanating from
the literature review. During the questionnaire distribution, the respondents were asked about
their agreement on the components, indicators and thresholds. In addition, they were also
allowed to add, modify or remove the components, indicators and thresholds from the list.
Using the Delphi technique, questionnaires were distributed to respondents in multiple rounds
new WJWSI framework was developed and used in the next round. Due to consensus being
reached for all components and most of the indicators after two rounds of questionnaire
distribution, an in-depth interview with key stakeholders followed the Delphi technique
application.
Task 4 – Applications of WJWSI in West Java catchments
The WJWSI framework was finalised and applied in three catchments in West Java. Each
application commenced with collecting required data and information related to the WJWSI
indicators and sub-indicators. Data was collected from past studies, institutional databases and
other relevant sources. The data was used to compute the sub-index values of each WJWSI
indicator and sub-indicator. These sub-index values were then calculated and aggregated to
produce the final WJWSI value. The results of these applications were used to analyse the
performance of the catchments, so that recommendations to improve the management of
water resources in these catchments could be provided to respective catchment authorities.
Task 5 – Robustness analysis of WJWSI
Robustness analysis is an important step in index development because the inputs for
developing an index are generally based on some assumptions, which might lead to variation
in the index values as outputs (Esty et al., 2005). The robustness of WJWSI was analysed in this
study by performing an uncertainty and sensitivity analysis on the index. In general, the
uncertainty analysis focused on how the upper and lower values of thresholds, different
weighting schemes and aggregation methods affect the values of sub-indices and the final
index. The sensitivity analysis was undertaken to answer the following questions:
- Which thresholds of the indicators and sub-indicators were the most sensitive to the
changes in their upper and lower values?
- How important was the upper and lower values of the thresholds of the indicators and
sub-indicators in determining the final index value?
- Which weighting schemes or aggregation methods were more sensitive to the final index
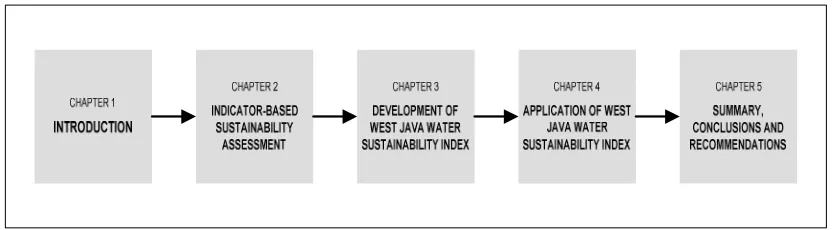
1.5 THESIS STRUCTURE
This thesis presents five chapters as shown in Figure 1.1. The growing information on
sustainable water resource management (Chapter 2) led to the development of a water
sustainability index in West Java (Chapter 3), which was then applied in three West Java
catchments (Chapter 4). Detailed explanations for each chapter are described in the following
sub-sections.
Figure 1.1 Thesis structure
Chapter 1. Introduction
This chapter presents the general overview of the overall thesis, which assists readers in
comprehending the main ideas explored in the thesis. It briefly describes the current
conditions of water resource management in West Java, as well as identifying growing studies
on sustainable water resource management. These led to the development of a water
sustainability index for West Java.
The aims of the research are clearly defined in this chapter, which highlights general objectives
of the research, and how the results can be used by relevant decision makers in West Java,
Indonesia. To emphasise the importance of the study, its significance is presented after the
aims of the research. The chapter continues with a brief methodology used in the study, where
Chapter 2. Indicator-based sustainability assessment
This chapter provides a state-of-the-art review of sustainability and water resource
management that leads to the development of WJWSI. Under the sub section on sustainability,
past studies on sustainability definitions are presented, followed by important principles and
criteria of sustainability. Under the sub section on sustainable water resource management,
criteria and guidelines for sustainable water resource management are described. These
principles, criteria and guidelines are then analysed for use during the identification of
components and indicators of WJWSI.
This chapter then discusses the indicator-based sustainability assessment. Here, general issues
on the method and a detailed explanation of elements of the indicator-based sustainability
assessment are presented. Finally, this chapter concludes by presenting the examples of three
existing water sustainability indices: the Canadian Water Sustainability Index (CWSI), Water
Poverty Index (WPI) and Watershed Sustainability Index (WSI). For each index, issues on the
selection of components and indicators, obtaining sub-index values, aggregation of indicators,
and interpretation of the final index are discussed.
Chapter 3. Development of the West Java Water Sustainability Index
This chapter focuses on development of the West Java Water Sustainability Index (WJWSI). It
comprises design elements and how the WJWSI conceptual framework is finalised. The design
of the framework discusses how the components, indicators and thresholds are identified and
selected. In addition, justification for the selection of components, indicators and thresholds is
provided.
Following discussion on the development of the conceptual framework, this chapter explores
the use of the Delphi technique to refine the conceptual framework. Here, definitions,
advantages and disadvantages of the Delphi technique are described, followed by detailed
steps of Delphi application. These steps include the identification of water-related
stakeholders as respondents, the design of questionnaires for Delphi application, the
distribution and collection of questionnaires, and analysis of the information obtained from
questionnaires. Finally, in-depth interviews with key stakeholders follow the application of
Chapter 4. Applications of West Java Water Sustainability Index
This chapter presents the application of WJWSI to three different catchments in West Java.
The applications are undertaken to provide valuable insights into the improvement of water
resource management in West Java, Indonesia.
Prior to WJWSI applications, this chapter discusses various factors related to water resource
management in West Java, which include demographic facts, socio-economic issues, and
environmental aspects of water resource management. Detailed applications of WJWSI in
Citarum, Ciliwung and Citanduy catchments are then discussed. In each application,
descriptions of the respective catchments, calculations and analysis, and relevant
recommendations to decision makers are presented. Finally, a comparative analysis of
different catchments and correlation analysis of WJWSI indicators, sub-indicators and final
index are provided.
Chapter 5. Summary, conclusions and recommendations
This chapter provides a summary of the tasks undertaken in this study, conclusions drawn
from the analysis provided in the main chapters, identified limitations of the study, and
potential areas of future research.
Chapter
2
Indicator‐based Sustainability Assessment
2.1 INTRODUCTION
Consumption, economic growth and environmental degradation impact
sustainable development in complex and often apparently contradictory
ways. The question is: how do we know whether overall we are on a
sustainable development path? If the rhetoric of policy makers committed
to sustainable development is to be judged against the reality of
performance, then means must be found to measure and monitor
sustainable development (Atkinson et al., 2007, p. 13)
The United Nations Conference on the Human Environment in 1972 sparked environmental
awareness globally. The conference also inspired the publication of the Brundtland Report,
(also known as Our Common Future), where the notion of sustainable development was first
introduced by the Brundtland Commission (Brundtland, 1987). Since the publication of this
Report, studies and efforts to define sustainability and sustainable development have been
extensively carried out by various institutions and organizations at all levels: local, national,
regional and international.
According to Harding (2002), sustainability is the ultimate goal of sustainable development. If a
project development includes sustainability in its goals, the sustainability status of issues
related to the project needs to be assessed. The assessment should be completed during the
planning and evaluation stages. At the planning stage, sustainability assessment ensures that
project design follows sustainability guidelines. At the evaluation stage, assessment monitors
In the past few decades, there have been extensive efforts on measuring sustainability. One
example is the development of assessment tools based on sustainability indicators. Several
individuals and organisations have suggested various indicators for assessing sustainability.
Some authors have developed general sustainability indicators, such as the Environmental
Sustainability Index (Esty et al., 2005), Corporate Sustainability Indicators (Spangenberg &
Bonniot, 1998), the Barometer of Sustainability (Prescott‐Allen, 2001), Environmental Pressure
Indices (Jesinghaus, 1999), Taking Sustainability Seriously (Portney, 2003), Sustainability
Indicator Systems (Spangenberg & Bonniot, 1998) and Pressure‐State‐Response (PSR) based
sustainability indicators (Spangenberg & Bonniot, 1998). Some sustainability indicators are
field‐specific, such as indicators for environment (Esty et al., 2005), agriculture (Parris, 1998;
Van Ittersum et al., 2008), fossil fuel (Ediger et al., 2007) and water resources. Indicators for
water resource sustainability, for example, are the Water Poverty Index – WPI (Lawrence et al.,
2003), Canadian Water Sustainability Index – CWSI (Policy Research Initiative, 2007) and
Watershed Sustainability Index – WSI (Chaves & Alipaz, 2007). All these indices have the same
goal to measure sustainability, which can further be used to assist decision makers and other
stakeholders achieve sustainability.
This chapter focuses on the review of water resource sustainability using the indicator‐based
approach. In its early sub‐sections, the chapter discusses major definitions of sustainable
development proposed by various individuals and institutions. These definitions re‐affirm the
definition of sustainable development in the Brundtland Report (Brundtland, 1987), which
highlighted the concerns for future generations. Based on these definitions, more specific
concepts of sustainability are then presented through a discussion of sustainability principles
and criteria.
Having completed the discussion on sustainability definitions, principles and criteria; this
chapter proceeds with the review of existing definitions, principles and guidelines on
sustainable water resource management. Later, these definitions, principles and criteria are
used as the basis for the identification of components and indicators in the development of a
water sustainability index for West Java, Indonesia.
obtaining sub‐index values, weighting schemes for components and indicators, aggregation of
components and indicators, robustness analysis of the index, and interpretation of the final
index value.
To provide an in‐depth understanding of how such indicators are applied in actual cases, three
existing water sustainability indices are discussed: the Water Poverty Index (WPI), Canadian
Water Sustainability Index (CWSI) and Watershed Sustainability Index (WSI). For each of these
indices, issues related to the following are discussed: selection of components and indicators,
obtaining sub‐index values, weighting of components and indicators, aggregation of
components and indicators, and classification of the aggregated index value. Similarities and
differences are studied with the aim of using these concepts to develop the WSI for West Java,
Indonesia.
Finally, in the last section of the chapter, the Human Development Index ‐ HDI (Rodriguez,
2010) and the Environmental Sustainability Index ‐ ESI (Esty et al., 2005) are discussed to
provide analysis on the applications of the indicator‐based assessment approach in areas other
than water resources. The ESI and HDI were selected as they have been widely used for years
by various institutions (Cooke et al., 2004; Cui et al., 2004; Erker, 2003; Mohanty & Ray, 2002;
Reed et al., 2006; Samuel‐Johnson & Esty, 2002; Stapleton & Garrod, 2007; Thapa, 1995) to
measure human development and environmental sustainability issues respectively.
2.2 SUSTAINABLE DEVELOPMENT DEFINITIONS AND SUSTAINABILITY PRINCIPLES
Liverman (1988) states that efforts to measure sustainable development can only be achieved
when this concept is clearly defined. Since it was introduced in 1987 (Brundtland, 1987), there
have been extensive studies to define sustainable development. The first definition of
sustainable development was proposed by the Brundtland Commission (Brundtland, 1987),
which defined sustainable development as:
…development that meets the needs of the present without compromising the
ability of future generations to meet their own needs. (Brundtland, 1987, p. 87)
This definition was followed by other definitions, such as the following:
…to maximize simultaneously the biological system goals (genetic diversity, resilience,
biological productivity), economic system goals (satisfaction of basic needs,
enhancement of equity, increasing useful goods and services), and social system goals
(cultural diversity, institutional sustainability, social justice, participation). (Barbier,
1987)
…meeting human needs while conserving the Earth’s life support systems and reducing
hunger and poverty. (Palmer et al., 2005, p. 5)
Even though the above definitions are presented in different forms, the messages are
comparable. These definitions urge human actions to care for present and future
environments, while at the same time utilising natural resources to fulfill human needs. The
Brundtland definition focuses on the balance of present and future generations, while the
other two definitions further address the need for concern for environmental, social and
economic interests.
These definitions on sustainable development were further explained by the growing studies
on sustainability principles. One of the most well‐known sustainability principles is the “triple
bottom line approach”, which includes the environmental, economic and social aspects of
sustainability (Cui et al., 2004; Ekins et al., 2003; Farsari & Prastacos, 2002). Spangenberg
(2004) proposes similar principles labeled as challenges, namely environmental, social and
institutional challenges. The environmental challenge emphasises the degradation of natural
resources for human use; the social challenge highlights the unequal distribution of wealth and
poverty; and the institutional challenge focuses on peace and security.
Other sustainability principles are presented in different forms. Parkin (2000) introduced the
capital flow concept, which stated that any development for achieving sustainability needs to
manage different capital flows. These capital flows are natural, human, social, manufactured
and financial. Any development proposal has to contribute to improving, or at least
Spangenberg & Bonniot (1998) labeled their sustainability principles “sustainability
dimensions”. These dimensions are packed in the so‐called “prism of sustainability”, as
presented in Figure 2.1. This prism, reflecting sustainability, has four dimensions, which are
institutional, environmental, social and economic. Each dimension is then further explored to
identify relevant indicators. For example, for the institutional dimension, the sustainability
indicators are participation, justice and gender balance. For the environmental dimension,
resource use and state indicators are identified. For the social dimension, the indicators are
health care, housing, social security and unemployment. Finally, for the economic dimension,
the indicators are Gross National Product (GNP), growth rate, innovation and competitiveness
(Spangenberg & Bonniot, 1998).
Apart from the indicators of individual dimensions, the prism of sustainability also offers a
framework to identify the inter‐linkage indicators between dimensions. The inter‐linkages can
be two, three or even four dimensional, which seek to compromise and synergise dimensions.
Indicators based on two‐dimensional inter‐linkages are illustrated in Figure 2.1. For example,
the Human Development Index (HDI) indicators are derived from the inter‐linkage between
economic and social dimensions. Similarly, distribution of access to environmental resource
and transport intensity are indicators derived from the interaction of environment and social
dimensions. Furthermore, the inter‐linkage of environment and economic dimensions has
resulted in indicators such as jobs, services and resource intensity of production (Spangenberg
& Bonniot, 1998).
2.3 SUSTAINABLE WATER RESOURCE MANAGEMENT: DEFINITIONS, CRITERIA AND
GUIDELINES
As the complexity of issues related to water resources has increased, there have been
extensive studies (Ashley et al., 2004; Giuppponi et al., 2006; Loucks & Gladwell, 1999; Loucks
et al., 2000; Mays, 2006; Policy Research Initiative, 2007; Starkl & Brunner, 2004) to combine
the concept of sustainability with water resource management issues. By applying
sustainability principles, it is expected that available water resources can be responsibly
utilised, not only by the current generation, but also by future generations. Loucks & Gladwell
(1999) emphasise the importance to re‐examine current water resource planning and
management approaches to achieve more sustainable water resources. This approach needs
to be more integrated, not only in terms of the issues, but also in terms of the stakeholders. In
relation to the issues, all economic, environmental, ecological and social interests need to be
addressed in the planning of water‐related programs. For the stakeholders, contributions from
different sectors, such as academic, engineering, economy and politics, need to be integrated.
Nardo et al. (2005) note that in measuring sustainability, defining what will be measured is
important. Thus, to develop a water sustainability index, a clear understanding of the
sustainability is required. Once sustainability is clearly defined, different indicators can be
appropriately identified. Loucks & Gladwell (1999) define water resource sustainability as:
…water resource systems designed and managed to fully contribute to the
objectives of society, now and in the future, while maintaining their
ecological, environmental, and hydrological integrity. (Loucks & Gladwell,
Other authors have defined water resource sustainability as:
…the ability to provide and manage water quantity so as to meet the present
needs of humans and environmental ecosystems, while not impairing the
needs of future generations to do the same. (Mays, 2006, p. 4)
…the ability to use water in sufficient quantities and quality from the local
to the global scale to meet the needs of humans and ecosystems for the
present and the future to sustain life, and to protect humans from the
damages brought about by natural and human‐caused disasters that affect
sustaining life. (Mays, 2006, p. 4)
…a process which promotes the coordinated development and management
of water, land and related resources, in order to maximize the resultant
economic and social welfare in an equitable manner without compromising
the sustainability of vital ecosystems. (GWP‐TAC, 2000, p. 1)
These definitions on water sustainability urge any water‐related decision maker and/or other
stakeholders to consider every impact of their water‐related programs on both present and
future generations. Considerations on purely technical criteria are no longer sufficient as the
complexity and uncertainty of water‐related issues intensify. Inclusion of environmental,
economic and social criteria is critical to address such complex and uncertain water‐related
problems (Loucks & Gladwell, 1999).
The above definitions also clearly indicate that sustainable water resource management can
only be achieved through the integration of water‐related issues and stakeholders. Savenije &
Van der Zaag (2002) highlight the importance of Dublin principles on integrated water resource
management, which state that:
1. Water is an essential resource, to be used and managed appropriately.
2. All relevant stakeholders should be involved in the development and management of
3. The central role of women in the provision, management and protection of water
resources is recognized and acknowledged.
4. Economic value of water in all uses should be emphasized and taken into account in the
decision making.
Mays (2006) accentuates three domains of integrated water resource management, which
include scope, scale and governance. Scope covers social and developmental issues related to
water resources, its related sectors, gender empowerment, poverty eradication and fairness
among the community. Scale ranges from local to national, and also possibly the river basin
level. Governance needs to include public sector, business community and wider community
representation.
The need for the integration of water‐related issues is also noted by Loucks & Gladwell (1999).
They state that water sustainability endorses water‐related programs to be directed towards a
more integrated or holistic approach. Water‐related projects can no longer be emphasised
from a purely technical view, ignoring social and economic concerns (Loucks & Gladwell, 1999).
Towards a better understanding of water sustainability principles, Loucks & Gladwell (1999)
provide water sustainability guidelines, which include the importance of water infrastructure,
environmental quality, economics and finance, institutions and society, human health and
welfare, as well as planning and technology. In line with these guidelines, Mays (2006)
introduces seven requirements to ensure the sustainability of water resource systems. They
are basic water needs to maintain human health; minimum standard of water quality; basic
water needs to maintain ecosystem health; long‐term renewability of available water
resources; accessible data on water resources for all parties; institutional schemes to resolve
water conflict; and democratic water‐related decision making.
Jakeman et al. (2005) introduce issues to be addressed in integrated water resource
management, which include water supply and demand, poverty alleviation and subsistence
production, agricultural land use, and environmental issues such as erosion and forest
maintenance. All these issues are essential because they can be used as the basis for
Loucks & Gladwell (1999) emphasise the flexibility and resilient characteristics of water
sustainability. Flexibility is defined as the ability of the system to adapt due to changes of
demand and purpose in the future. Resilience is defined as the ability to recover, with
appropriate treatment, after the occurrence of unpredictable damage. The current criteria
may no longer be fully applicable in the future due to these unpredictable changes. Reliable
sustainable water resource management is required to be flexible due to these changes, and
still function effectively in protecting water resources and maintaining human needs (Loucks &
Gladwell, 1999).
To summarise, the main characteristic of water resource sustainability lies in the attitude of
key stakeholders to constantly review and re‐examine their approaches to address the
changing issues of water resources. At all times, in all plans and processes, water stakeholders
need to strive for decisions that fulfill economic, environmental and social demands (Loucks &
Gladwell, 1999).
2.4 ELEMENTS OF INDICATOR‐BASED SUSTAINABILITY ASSESSMENT
In general, the indicator‐based sustainability assessment seeks to identify indicators to
measure sustainability. An indicator is a measure, either qualitative or quantitative, of facts or
conditions of particular issue(s). If the indicators are observed regularly, they can analyse
changes during the observed period (Nardo et al., 2005). Some indicators might be grouped to
form a component, or particular indicator(s) might be further explained by having sub‐
indicators. A group of indicators and/or components, which are combined together, is called
an index or composite indicator. Nardo et al. (2005) emphasise that ideally an index should
measure multi‐dimensional ideas that cannot be explained by one indicator.
To apply the indicator‐based sustainability assessment, common elements to be considered
include component and indicator selection, obtaining sub‐index values of components and
indicators, weighting of components and indicators, aggregation of components and
indicators, and robustness analysis of the index. The components and indicators provide a
must have common unit values. The values of the indicators in common units are known as
sub‐index values. After all the sub‐index values of the indicators are obtained, they can be
aggregated to a single index value. In the aggregation, the indicators might be assigned equal
or non‐equal weights. The robustness analysis of the index is conducted to study the
uncertainty of inputs on the index.
2.4.1 Selection of components and indicators
Components and indicators are the main elements in an index. Therefore, in developing an
index, selection of components and indicators is extremely important. Components and
indicators for an index are commonly selected through a literature review on previous
sustainability frameworks and existing sets of components and indicators (Chaves & Alipaz,
2007; Policy Research Initiative, 2007; Sullivan & Meigh, 2007). Generally, an initial set of
components and indicators is identified, based on those reviews. This initial set is then refined
through discussion with key stakeholders (Policy Research Initiative, 2007; Sullivan & Meigh,
2007).
Liverman & Hanson (1988) suggest the following characteristics for the selection of indicators:
- Sensitive to change in time
A reliable indicator must be observable throughout the particular time series of data;
otherwise the indicator will not be able to provide information on how the issues related
to the indicator have changed over time.
- Sensitive to change across space or within groups
An indicator should reflect the changes occurred across space or within groups. If not, the
indicator will be less useful to measure a condition. The Gross National Product (GNP) is
an example of an economic indicator which is not sensitive to change within groups. The
GNP value may increase even though for the majority of community groups the economic
condition worsens. In this case, such an indicator might be replaced by one that measures
the distribution of income.
- Predictive or anticipatory
With regard to sustainability, reliable indicators should be able to predict or anticipate the
signs of unsustainable conditions. Then, once the signal is received, the indicators can be
traced to identify the main causes for the unsustainable signal.
The water stress indicator by Falkenmark (1989), for example, is an indicator which can
provide an early signal, if water availability in a particular area is under threat. As this
indicator is derived from two variables – population and available fresh water – further
analysis can demonstrate which variable has caused the stress to water resources. Once
specific causes of the unsustainable condition are identified, appropriate action to
address these causes can be deployed.
- Reference or threshold values available
Indicators which have been identified will be less useful when reference or threshold
values to assess the indicators are not available. Therefore, if the data or reference value
is not available for an indicator, the indicator might have to be replaced by a ‘similar’
indicator, for which its data is available.
In developing countries, this is a major concern as required data to assess the identified
indicators might not be available or inaccurate (West Java Environmental Protection
Agency, 2008). Therefore, it is important that during the indicator selection process, the
issue of data availability is included as one of the selection criteria.
- Unbiased
Biases in the selection of sustainability indicators may occur due to various reasons, such
as the existing knowledge of the index developer, political interests, and the background
given in the existing literature. It might not be possible to eradicate these biases.
Therefore it is important, for the index developer, to identify the potential sources of
biases and take necessary measures to minimise them.
- Appropriate data transformation
For most indicators, the identified indicator is not the raw data. Therefore, to obtain the
value for the indicator, appropriate data transformations or calculations are needed. It is
important to carefully develop or adopt the appropriate method for transforming the
data into the meaningful indicator value.
- Integrative
The importance of integrative or composite indicators is to provide the signs on relative
conditions that are not sustainable. Senior decision makers need to be informed on the
conditions based on these signs, which will be analysed to trace the main causes that lead
to conditions that are not sustainable.
Some concerns regarding the importance of indicator selection are presented by Nardo et al.
(2005), who emphasise the quality of basic data for indicators and procedures to carry out the
selection of indicators. The concerns for quality of basic data include their relevance, accuracy,
timeliness, accessibility, interpretability and coherence. The concerns for procedures include
design of the theoretical framework, obtaining sub‐index values, linkage to other indicators
and robustness analysis.
2.4.2 Obtaining sub‐index values
In general, the identified indicators for an index have their own units. For example, the Water
Availability indicator of the Canadian Water Sustainability Index (CWSI) has the unit of
m3/cap/year. The amount of available water for one person per year in a certain area
(presented in m3/cap/year), is known as the actual value of Water Availability indicator. As the
actual values of indicators of an index are presented in different unit values, they cannot be
aggregated or compared. The indicators can only be aggregated or compared when they have
the same unit value. The values of indicators, which have the same unit, are known as sub‐
index values. Different methods to obtain the sub‐index value of indicators are currently
available. The selection of the most appropriate method will be based on properties of the
data and the purpose of developing the index (Nardo et al., 2005). Special attention and