Type of the Paper (Article)
Classification of Google Play Store Application
Reviews Using Machine Learning
Abdul Karim1, Azhari Azhari1, *, Meshrif Alruily2, Hamza Aldabbas3, Samir Brahim Belhaouri4 and Ali Adil Qureshi5
1 Department of Computer Science and Electronics, University Gadjah Mada, Yogyakarta, Indonesia; [email protected]; [email protected]
2 Faculty of Computer & Information Sciences, Jouf University, Sakaka City, Saudi Arabia; [email protected]
3 Prince Abdullah bin Ghazi Faculty of Information & Communication Technology, Al-Balqa Applied University, Al-Salt, Jordan; [email protected]
4 Division of Information & Computer Technology, College of Science & Engineering, Hamad Bin Khalifa University, Doha, Qatar ; [email protected]
5 Department of Computer Science, Khwaja Fareed University of Engineering & Information Technology, Rahim Yar Khan, Pakistan; [email protected]
* Correspondence: [email protected]
Abstract: Google play store allow the user to download a mobile application (app) and user get inspired by the rating and reviews of the mobile app. A recent study analyzes that user preferences, user opinion for improvement, user sentiment about particular feature and detail with descriptions of experiences are very useful for an application developer. However, many application reviews are very large and difficult to process manually. Star rating is given of the whole application and the developer cannot analyze the single feature. In this research, we have scrapped 282,231 user reviews through different data scraping techniques. We have applied the text classification on these user reviews. We have applied different algorithms and find the precision, accuracy, F1 score and recall. In evaluated results, we have to also find the best algorithm.
Keywords: Machine Learning; Natural Language Processing; Text Mining; Semantic Analysis; Scraping; Google Play Store; Rating
1. Introduction
Mobile Applications plays a very vital role in our daily life as people experience. Now a day's android app is being used by everyone, people use different android apps, like (Messaging, social media, gaming, and browsers), etc. This online market provides a place for mobile users free and paid access over a million applications of mobiles that are referred to as “mobile apps”.
On the Google Play store website, users can choose from over a million mobile apps for various mobile devices but sometimes the downloaded apps are not useful enough, keeping this mind. App store allows the user to search, buy and deploy software app on few clicks. This platform allows the user that can share his reviews. However, many limitations that we analyze and develop using the user reviews information. In the First step, it’s required a lot of effort to be
analyzed app stores with a huge quantity of reviews. A current study found that IOS user gives 22 reviews every day on one app. Famous social media app Facebook gets more than 4000 reviews daily. Secondly, the quality of the review is wisely innovative ideas from helpful advice to insulting comments. Through different patterns and trends, high-quality information will be derived, High-quality information is a statistical pattern learning which is derived from the patterns and trends through various mediums. The way of structuring the input text the text mining use generally parsing, deriving patterns within the prearranged data, subsequent
insertion into a database, along with the accumulation of some original linguistic features and to end with interpretation and assessment of the output. High-quality text mining is generally an arrangement of interest, innovation, and significance. Typically, text mining task includes entity relation modelling for example to learn the relationship with named entities, summarization of
documents, sentiment
analysis, and creation of
granular taxonomies,
concept/entity extraction, text
categorization, and text
clustering.
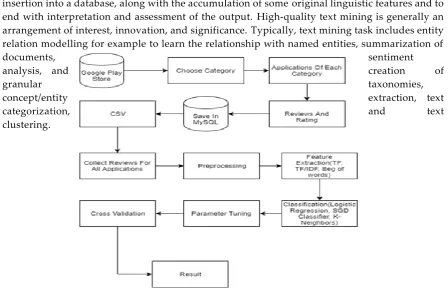
Figure 1. Flow of Google Play Store Application Reviews Classification
In linguistics, semantic analysis is the process of the level of phrases, paragraphs, sentences, clauses for writing to their independent language meanings and for relating syntactic structures. The feature removing the cultural and linguistic are involved in semantic analysis. The elements of idiom and figurative language, currently being cultural, and so are frequently changed to comparatively invariant meanings in semantic analysis. Semantics, even though applicable to pragmatics, is different because the former deals using a sentence or word alternative in just about any circumstance, whereas pragmatics believes that the one of a kind or significance produced from circumstance or tone. In various terms, semantics is all about loosely pragmatics and coded meanings; the significance encoded keywords that are subsequently translated using by the user.
2. Related Work
ways features into capabilities that are simple and purposeful. They've compared due to peer-reviewed examined with the 7 applications extracted from Apple App Store (IOS) and also Google PlayStore. This manner, the consumer opinion can be examined by the program developer of filter inspection and a feature that isn't associated with They remember up to 73 per cent and have the accuracy up to 91 per cent. The results show that the summaries that are generated also have features from the reviews and also are routine [1].
In 2013, Liu, Sarkar, and Chakraborty discuss the analysis of reviews for using android apps and their features (Liu. et al., 2013). They use reviews of two recent apps, one from Brain and Puzzle category and second from the personalization category. They extracted 600 reviews. Different tools like SAS 12.1 are used to perform sentiment analysis and SAS Enterprise Miner TM 7.1 is used for summarizing the reviews. After this, they apply rule-based models for testing datasets [2]. The result shows the following statistic:
• For widget app 86% precision on positive and 94% precision negative directory.
• For game app 94% on positive and 90% on negative.
Thus, after comparing the statistical model and rule-based model; they conclude that the rule-based model is a more precise and effective way for making analysis.
In 2013, (Pappas et al., 2013) describe the sentiment analysis of user reviews that is for one class collaborative fighting over TED Talks. Authors focus on the rating score of the reviews commented by the user. They also see how one class collaborates with the second class. For multimedia recommendations on TED discussions, they propose a sentiment-conscious nearest-neighbour model (SANN), which uses user reviews and comments. They propose that the SANN model has been experimentally shown to overcome some of the difficulties of associative filtering assignment of a class and to improve large-scale multi-passive infrastructure. Additionally, they have established robustness to sound and exhibited suitable learning abilities with value to the amount of available user-generated text
[3]
. In 2012, (Vinodhini et al., 2012) discuss sentiment analysis and opinion mining. They analyze different community problems. Their main topic for the survey is 'sentiment analysis and its challenges'. They deduce that it has a variety of applications in information systems and their classifiers are dependent on domain or topic. Thus, they conclude that none of the classification models is efficient in performance. Various types of classification algorithms are joining an effective way to reduce their disadvantage and advantage from each other's merits. Then finally increase the sentiment classification routine[4]
.3. Data
3.1. Dataset Description
Mobile applications are a part of our lives. Half-million applications were introducing in 2011 and in October 2012, 0.675 million applications were accessible on the Google Play store. Therefore, in this article, we collect the data from the Google play store by scrapping.
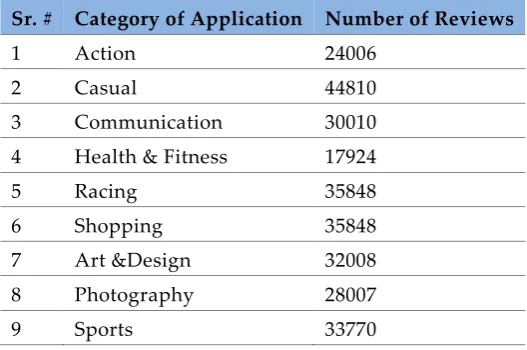
Table 1. Data Information after Scrapping from Google Play Store Sr. # Category of Application Number of Reviews
1 Action 24006 2 Casual 44810 3 Communication 30010 4 Health & Fitness 17924 5 Racing 35848 6 Shopping 35848 7 Art &Design 32008 8 Photography 28007 9 Sports 33770
3.2. Dataset Visualization
Dataset scrapped from the Google play store consists of Mobile Application reviews that visualized in FIGURE 2.
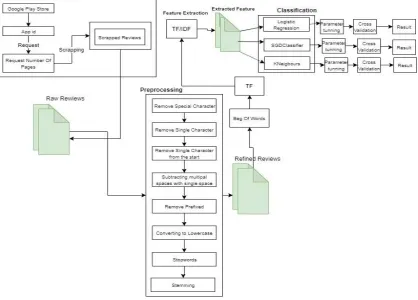
Figure 3. Mechanism of Google Play Store Application Reviewing using Machine Learning Models
4. Methodology
First, we select Application Categories that are Action, Casual, Communication, Health & Fitness, Racing, Shopping, Art & Design, Photography, and Sports. Fetch 24006, 44810, 30010, 17924, 35848, 35848, 32008, 28007 and 33770 reviews with their rating according to each category. We fetch the number of reviews and enter the required pages according to the comments. We collect a total of 282,231 reviews in the Google Playstore. To fetch the data, first, we used to request a library. Requests library allows the user to send HTTP/1.1 requests using Python. With that, using simple Python libraries we add various content like form data, headers, multipart files, and parameters. This library allows users to process response data of python similarly. The second we had used their library. There is a special sequence of characters of Regular Expression that helps the user match or find with others string or sets of the string, using a s pecialized syntax detained in a pattern. At third, we had used the Beautiful Soup (Richardson et al., 2007). This is a library of python, which is used to extract data from the HTML and XML files. This library works very rapidly and saves lots of programmer time. And in the end, we had used the OS library. To fetch reviews, we used to enter the application id and number of pages. There are 40 reviews inside one page. Such whatever we have to fetch comments we will enter the same number of pages [6].
this is a library that provides machine learning algorithms like classification, regression, clustering, model validation, etc.
[7]
. Steps of text classification model in python are as follows:• Import the data.
• Feature Extraction.
• Convert the text into numbers.
• Training sets(data) and testing sets(data).
• Training text classification model and predicting sentiments.
• Model evaluating.
4.1. Feature Extraction
Once the information is imported by us, the text from the information is processed. This text includes kinds of figures, letters, and spaces that are unwanted. We remove spaces within this article, figures, and all characters. For this function, we utilize various libraries to carry out different processing tasks and get started deleting all of the non-repeated personalities like unique characters, figures, etc. Following this function, we'll delete the very exact characters. For
instance: should we eliminate information from “asif" it will be taken out from the previous word we receive will be deducted out of ”asif" along with the only character "s". All the characters on each side of the space could be converted to a single area. Replacing a letter is going to result. We utilize a couple of areas to be replaced by the \ _ [a-zA-Z] + s + regular expression. Replacing a single letter with a single space will result in multiple spaces, which is not ideal. We use the \ _ + regular expression again to replace one or more places with one space. After obtaining the information in a binary format we now receive the information in binary format, and together with the letter "B" inserted before every series. Regex ^ b \ s removes "b" by the start of the series. After this work, we flip the information into a situation so the very exact conditions but situations are handled. For to shorten words to your dictionary root origin, we will do the same. By way of instance, out of "apple" into "apple".
4.2. Converting Text to Numbers
Machines Understand computer language machine cannot understand only numeric data(numbers). Largely, different statistical techniques and method like machine learning can be dealing with numbers. However, we convert the text. Different approaches the text changes into a numeric form.
Commonly used strategies are given below:
• The Bag Of Words Model
• Word Embedding Model
We utilize a bag of words model to convert text into numbers.
4.2.1 . Bag of Words
The first parameter is max_features, which is set to 1500. The reason is that when we convert the words into numbers the approach is using we are it is a bag of words approach, in this approach all unique words in the documents are converted into features.
Each record contains over 1000 unique words. However, there are no parameters for classifying files into files with frequency. We place the parameter that was max_future to 1500 so we utilize 1500 phrases. The next parameter used is min_df, which can be set to 5. This usually means that we contain. Likewise, we place max_fd into 0.7. This means that we only include words that occur in at least 5 papers and contain a maximum of 70% of documents. we just contain about which words which happen. The cause for this is that it doesn't offer the files with information. In the instance of opinion analysis, we eliminate the expression to stop words. Words that are closed do not include helpful info. We utilize (Bird et al., 2004) a transformation function which puts text files into properties that are numerical
[8]
.4.2.2. TF and TF/IDF
In the bag of Words, we converted text to numbers. But it has one problem it Assigns the score into a word on the base of documents. We resolve This dilemma by using TF/IDF.TF/IDF indicates how often there is a word Imported into files. A word TF/IDF expression frequency multiplies with the inverse document frequency.
4.3. Training and Testing Sets
We split our data into Testing and training places. For this purpose, we utilize the train evaluation divide from sklearn.model_selection library. Therefore, data can be divided into 80%, 20% testing and training set.
5. Results and Discussion
5.1. Analysis of Logistic Regression Using TF/IDF
Table 2: Results of Logistic Regression Using TF/IDF
Application Name TF/IDF of Logistic Regression
Precision Recall F1-score Accuracy
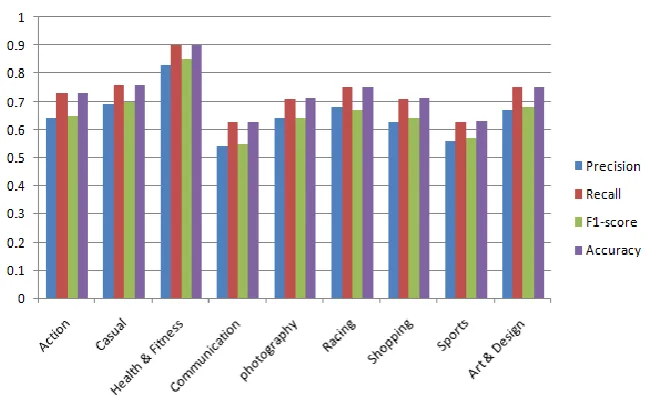
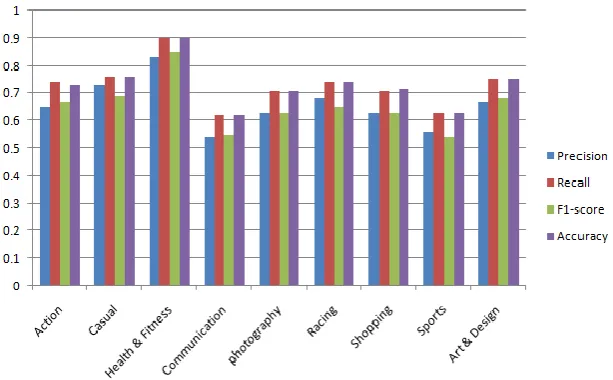
Action 0.64 0.73 0.65 0.73 Casual 0.69 0.76 0.7 0.76 Health & Fitness 0.83 0.9 0.85 0.9 Communication 0.54 0.63 0.55 0.63 Photography 0.64 0.71 0.64 0.713 Racing 0.68 0.75 0.67 0.75 Shopping 0.63 0.71 0.64 0.714 Sports 0.56 0.63 0.57 0.632 Art & Design 0.67 0.75 0.68 0.75
Also, we have bar chart visualization of the Logistics Regression algorithm in which series1 shows the precision, series2 shows the Recall, series3 shows the F1 score, and series4 shows the accuracy as shown in Figure 4.
Figure 4. Results of logistic Regression with TF/IDF
5.2. Analysis of SGD Classifier Using TF/IDF
Table 3. Results of SGD Classifier Using TF/IDF.
Also, we have bar chart visualization of SGD Classifier algorithm in which series1 shows the precision, series2 shows the Recall, series3 shows the F1 score, and series4 shows the accuracy as shown in Figure 5.
Figure 5. Results of SGD Classifier using TF/IDF
5.3. Analysis of K-Neighbor Classifier Using TF/IDF
The k-nearest neighbour algorithm (k-NN) is a non-parametric strategy employed for classification and regression in pattern recognition. We've made a total of 282,231 reviews from the Google play store. A logistic regression algorithm has been applied by us on various parameters regarding TF/IDF. Locate the truth of classification of each class application and in information find accuracy, recall, and F1 score all parameters we use to gauge the accuracy of the dataset are displayed in Table 4.
Application Name TF/IDF of SGD Classifier
Precision Recall F1-score Accuracy
Table 4. Results of K-Neighbor Classifier Using TF/IDF
Application Name TF/IDF of K-Neighbors Classifier
Precision Recall F1-score Accuracy
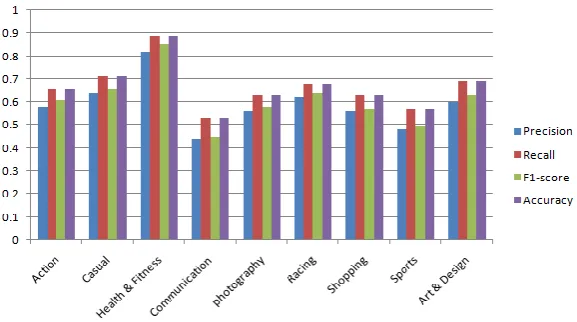
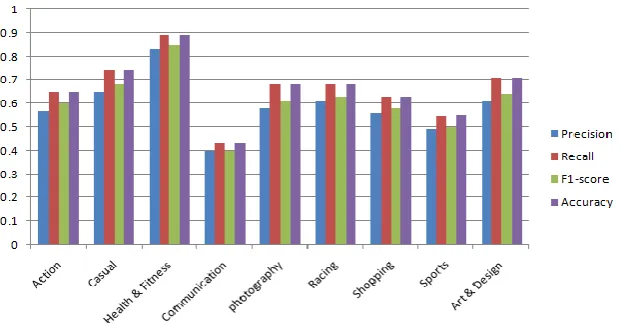
Action 0.58 0.66 0.61 0.66 Casual 0.64 0.71 0.66 0.71 Health & Fitness 0.82 0.89 0.85 0.89 Communication 0.44 0.53 0.45 0.53 Photography 0.56 0.63 0.58 0.63 Racing 0.62 0.68 0.64 0.68 Shopping 0.56 0.63 0.57 0.63 Sports 0.48 0.57 0.5 0.57 Art & Design 0.6 0.69 0.63 0.693
Also, we have bar chart visualization of K-Neighbors Classifier algorithm in which series1 shows the precision, series2 shows the Recall, series3 shows the F1 score, and series4 shows the accuracy as shown below in Figure 6.
Figure 6. Results of K-Neighbor Classifier Using TF/IDF
5.4. Analysis of Logistic Regression Using Bigrams
Table 5. Results of Logistic Regression Using Bigrams
Application Name Bigram of Logistic Regression
Precision Recall F1-score Accuracy
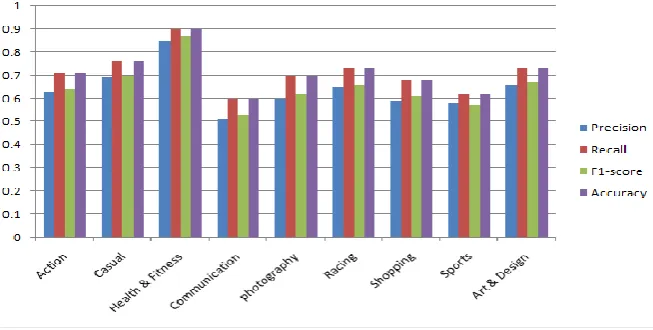
Action 0.65 0.72 0.66 0.72 Casual 0.69 0.76 0.7 0.76 Health & Fitness 0.86 0.9 0.87 0.9 Communication 0.52 0.61 0.54 0.61 photography 0.6 0.7 0.63 0.7 Racing 0.64 0.74 0.66 0.74 Shopping 0.61 0.7 0.63 0.7 Sports 0.59 0.64 0.59 0.64 Art & Design 0.66 0.73 0.68 0.73
Also, we have bar chart visualization of the Logistics Regression algorithm in which series1 shows the precision, series2 shows the Recall, series3 shows the F1 score, and series4 shows the accuracy as shown in Figure 7.
Figure 7. Results of Logistic Regression Using Bigrams
5.5 Analysis of SGD Classifier Using Bigrams
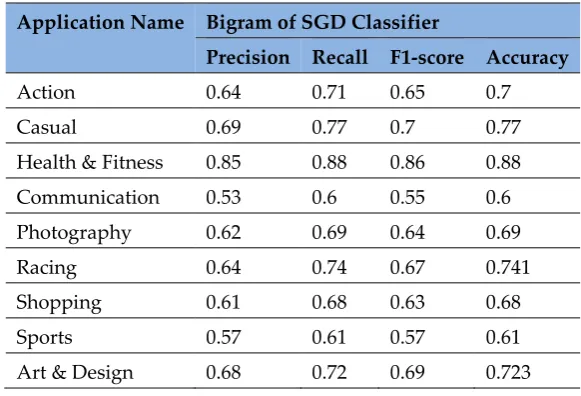
Table 6. Results of SGD Classifier Using Bigrams
Application Name Bigram of SGD Classifier
Precision Recall F1-score Accuracy
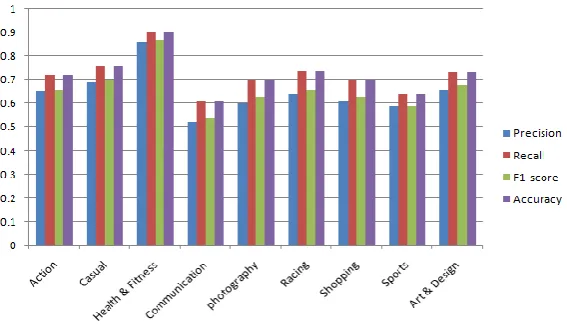
Action 0.64 0.71 0.65 0.7 Casual 0.69 0.77 0.7 0.77 Health & Fitness 0.85 0.88 0.86 0.88 Communication 0.53 0.6 0.55 0.6 Photography 0.62 0.69 0.64 0.69 Racing 0.64 0.74 0.67 0.741 Shopping 0.61 0.68 0.63 0.68 Sports 0.57 0.61 0.57 0.61 Art & Design 0.68 0.72 0.69 0.723
Also, we have bar chart visualization of SGD Classifier algorithm in which series1 shows the precision, series2 shows the Recall, series3 shows the F1 score, and series4 shows the accuracy as shown in Figure 8.
Figure 8. Results of SGD Classifier Using Bigrams
5.6 Analysis of K-Neighbor Classifier Using Bigrams
Table 7. Results of K-Neighbor Classifier Using Bigrams
Application Name Bigram of K-Neighbors Classifier Precision Recall F1-score Accuracy
Action 0.57 0.65 0.6 0.65 Casual 0.65 0.74 0.68 0.74 Health & Fitness 0.83 0.89 0.85 0.89 Communication 0.4 0.43 0.4 0.43 Photography 0.58 0.68 0.61 0.68 Racing 0.61 0.68 0.63 0.68 Shopping 0.56 0.63 0.58 0.63 Sports 0.49 0.55 0.5 0.554 Art & Design 0.61 0.71 0.64 0.71
Also, we have bar chart visualization of K-Neighbors Classifier algorithm in which series1 shows the precision, series2 shows the Recall, series3 shows the F1 score, and series4 shows the accuracy as shown in Figure 9.
Figure 9. Results of K-Neighbor Classifier Using Bigrams
5.7 Analysis of Logistic Regression Using Trigrams
Table 9. Results of Logistic Regression Using Trigrams
Application Name Trigram of Logistic Regression
Precision Recall F1-score Accuracy
Action 0.63 0.71 0.64 0.71 Casual 0.69 0.76 0.7 0.76 Health & Fitness 0.85 0.9 0.87 0.9 Communication 0.51 0.6 0.53 0.6 photography 0.6 0.7 0.62 0.7 Racing 0.65 0.73 0.66 0.732 Shopping 0.59 0.68 0.61 0.68 Sports 0.58 0.62 0.57 0.623 Art & Design 0.66 0.73 0.67 0.73
Also, we have bar chart visualization of Logistics Regression algorithm in which series1 shows the precision, series2 shows the Recall, series3 shows the F1 score, and series4 shows the accuracy as shown in Figure 10.
Figure 10. Results of Logistic Regression Using Trigrams
5.8 Analysis of SGD Classifier Using Trigrams
Table 8. Results of SGD Classifier Using Trigrams
Application Name Trigram of SGD Classifier
Precision Recall F1-score Accuracy
Action 0.62 0.69 0.64 0.69 Casual 0.68 0.76 0.7 0.76 Health & Fitness 0.83 0.9 0.86 0.9 Communication 0.51 0.6 0.53 0.6 Photography 0.6 0.7 0.63 0.7 Racing 0.58 0.66 0.6 0.66 Shopping 0.61 0.68 0.62 0.68 Sports 0.53 0.59 0.55 0.593 Art & Design 0.67 0.72 0.69 0.722
Also, we have bar chart visualization of SGD Classifier algorithm in which series1 shows the precision, series2 shows the Recall, series3 shows the F1 score, and series4 shows the accuracy as shown in Figure 11.
Figure 11. Results of SGD Classifier Using Trigrams
5.9 Analysis of K-Neighbor Using Trigrams
The non-parametric method that's a k-nearest neighbour algorithm (k-NN) is a non-parametric method that's employed for classification and regression in pattern recognition. We've made a total of 282,231 testimonials from the Google play shop. A regression algor ithm has been implemented by us. Locate the accuracy of classification of every application's and in the advice that is statistical find accuracy, recall, and F1 score is displayed in Table 10.
Table 9. Results of K-Neighbor Using Trigrams
Precision Recall F1-score Accuracy
Action 0.54 0.64 0.57 0.64 Casual 0.6 0.52 0.55 0.52 Health & Fitness 0.83 0.9 0.85 0.9 Communication 0.46 0.54 0.47 0.54 Photography 0.59 0.68 0.62 0.681 Racing 0.61 0.7 0.64 0.703 Shopping 0.55 0.63 0.57 0.631 Sports 0.47 0.55 0.49 0.552 Art & Design 0.62 0.71 0.64 0.71
Also, we have bar chart visualization of the K-Neighbors Classifier algorithm in which series1 shows the precision, series2 shows the Recall, series3 shows the F1 score, and series4 shows the accuracy as shown in Figure 12.
Figure 12. Results
of K-Neighbors Classifier Using
Trigrams
Comparative Results and Analysis
Table 10. Comparative analysis of proposed Machine Learning Algorithms using TF/IDF
Application L o g is ti
c Re
g re s si o n Pre ci si on SG D C la ss if ie r Pre ci si on K -N ei g hbors Pre ci si on L o g is ti
c Re
g re s si o n Re ca ll SG D C la ss if ie r Re ca ll K -N ei g hbors Re ca ll L o g is ti
c Re
g re s si o n F 1 Sc o re SG D C la ss if ie r F 1 Sc o re K -N ei g hbors F 1 Sc o re L o g is ti
c Re
Category
Action 0.64 0.65 0.58 0.73 0.74 0.66 0.65 0.67 0.61 0.73 0.73 0.66 Casual 0.69 0.73 0.64 0.76 0.76 0.71 0.7 0.69 0.66 0.76 0.76 0.71 Health &
Fitness 0.83 0.83 0.82 0.9 0.9 0.89 0.85 0.85 0.85 0.9 0.9 0.89 Communi
cation 0.54 0.54 0.44 0.63 0.62 0.53 0.55 0.55 0.45 0.63 0.62 0.53 Photograp
hy 0.64 0.63 0.56 0.71 0.71 0.63 0.64 0.63 0.58 0.713 0.711 0.63
Racing 0.68 0.68 0.62 0.75 0.74 0.68 0.67 0.65 0.64 0.75 0.741 0.68 Shopping 0.63 0.63 0.56 0.71 0.71 0.63 0.64 0.63 0.57 0.714 0.712 0.63
Sports 0.56 0.56 0.48 0.63 0.63 0.57 0.57 0.54 0.5 0.632 0.63 0.57 Art &
Design 0.67 0.67 0.6 0.75 0.75 0.69 0.68 0.68 0.63 0.75 0.75 0.693
Table 11. Comparative analysis of proposed Machine Learning Algorithms using Bigrams
Application Category L o g is ti c R eg re ss io n Pre ci si o n SG D C la ss ifi er Pre ci si o n K -N ei g hbors Pre ci si o n L o g is ti c R eg re ss io n Re ca ll SG D C la ss ifi er Re ca ll K -N ei g hbors Re ca ll L o g is ti c R eg re ss io n F 1 S co re SG D C la ss ifi er F 1 S co re K -N ei g hbors F 1 S co re L o g is ti c R eg re ss io n Acc ur ac y SG D C la ss ifi er Acc ur ac y K -N ei g hbors Acc ur ac y
Action 0.65 0.64 0.57 0.72 0.71 0.65 0.66 0.65 0.6 0.72 0.7 0.65 Casual 0.69 0.69 0.65 0.76 0.77 0.74 0.7 0.7 0.68 0.76 0.77 0.74 Health &
Fitness 0.86 0.85 0.83 0.9 0.88 0.89 0.87 0.86 0.85 0.9 0.88 0.89
Communi
cation 0.52 0.53 0.4 0.61 0.6 0.43 0.54 0.55 0.4 0.61 0.6 0.43 Photograp
hy 0.62 0.62 0.58 0.7 0.69 0.68 0.63 0.64 0.61 0.7 0.69 0.68
Racing 0.64 0.64 0.61 0.74 0.74 0.68 0.66 0.67 0.63 0.74 0.741 0.68 Shopping 0.61 0.61 0.56 0.7 0.68 0.63 0.63 0.63 0.58 0.7 0.68 0.63 Sports 0.59 0.57 0.49 0.64 0.61 0.55 0.59 0.57 0.5 0.64 0.61 0.554 Art &
Design 0.66 0.68 0.61 0.73 0.72 0.71 0.68 0.69 0.64 0.73 0.723 0.71
Table 12. Comparative analysis of proposed Machine Learning Algorithms using Trigram
Action 0.63 0.62 0.54 0.71 0.69 0.64 0.64 0.64 0.57 0.71 0.69 0.64 Casual 0.69 0.68 0.6 0.76 0.76 0.52 0.7 0.7 0.55 0.76 0.76 0.52 Health &
Fitness 0.85 0.83 0.83 0.9 0.9 0.9 0.87 0.86 0.85 0.9 0.9 0.9 Communi
cation 0.51 0.51 0.46 0.6 0.6 0.54 0.53 0.53 0.47 0.6 0.6 0.54 Photograp
hy 0.6 0.6 0.59 0.7 0.7 0.68 0.62 0.63 0.62 0.7 0.7 0.681 Racing 0.65 0.58 0.61 0.73 0.66 0.7 0.66 0.6 0.64 0.732 0.66 0.703 Shopping 0.59 0.61 0.55 0.68 0.68 0.63 0.61 0.62 0.57 0.68 0.68 0.631
Sports 0.58 0.53 0.47 0.62 0.59 0.55 0.57 0.55 0.49 0.623 0.593 0.552 Art &
Design 0.66 0.67 0.62 0.73 0.72 0.71 0.67 0.69 0.64 0.73 0.722 0.71
This online marketplace provided free and paid access to users. On the Google Play store, users can choose from over a million apps from various predefined categories. In this research, we have scraped 506259 reviews from 14 different categories of Google play store application. Evaluated the results by using different machine learning algorithms like Logistic Regression algorithm on different parameters concerning Bigram. That can check the semantics of reviews about some applications form users that their reviews are good, bad, normal and so on. Calculation of Bigram using different parameters like precision, recall, accuracy and F1 score the concluded results compared to the statistical result of these algorithms. After comparison, analyzed that the logistic regression algorithm is the best algorithm for checking the semantic
analysis of any Google application user’s reviews as shown in the above comparative analysis.
6. Conclusion and Future Work
Today’s world Google play store has become the major hub for downloading and uploading
Android application. The Android application users download these applications for their personal use. Each user of the application has their own experience with the application. Users download and use these applications and express the experience of the application in the shape of comments or reviews, also give a rating to this application on the scale of 0 -5. In this research work, we have scrapped 251661 user reviews through different data scraping techniques in an evaluated result of this research, we have applied text classification on our dataset after preprocessing. In our research to find the accuracy, recall, precision, F1 score we are usin g different machine learning algorithms. After a comparison of the different attributes, we have also found the best algorithm which has the best accuracy.
In the future, increase the category of applications and increase the number of reviews. Compare the logistic regression algorithm accuracy results with other different algorithms. Generate clusters and check the relationship between reviews and ratings of the application that can analyze each application more precisely.
[1] Guzman, E., &Maalej, W. (2014, August). How do users like this feature? a fine grained sentiment analysis of app reviews. In Requirements Engineering Conference (RE), 2014 IEEE 22nd International (pp. 153-162). IEEE.
[2] Liu, J., Sarkar, M. K., & Chakraborty, G. (2013, May). Feature-based Sentiment analysis on android app reviews using SAS® text miner and SAS® sentiment analysis studio. In Proceedings of the SAS Global Forum 2013 Conference (Vol. 250).
[3] Pappas, N., & Popescu-Belis, A. (2013, July). Sentiment analysis of user comments for one-class collaborative filtering over ted talks. In Proceedings of the 36th international ACM SIGIR conference on Research and development in information retrieval (pp. 773-776). ACM.
[4] Vinodhini, G., & Chandrasekaran, R. M. (2012). Sentiment analysis and opinion mining: a survey. International Journal, 2(6), 282-292.
[5] Pal, M. (2005). Random forest classifier for remote sensing classification. International Journal of Remote Sensing, 26(1), 217-222.
[6] Richardson, L. (2007). Beautiful soup documentation. Townsend, J. T. (1971). Theoretical analysis of an alphabetic confusion matrix. Perception & Psychophysics, 9(1), 40-50.
[7] Pedregosa, F., Varoquaux, G., Gramfort, A., Michel, V., Thirion, B., Grisel, O., ... &Vanderplas, J. (2011). Scikit-learn: Machine learning in Python. Journal of machine learning research, 12(Oct), 2825-2830.
[8] Bird, S., &Loper, E. (2004, July). NLTK: the natural language toolkit. In Proceedings of the ACL 2004 on Interactive poster and demonstration sessions (p. 31). Association for Computational Linguistics.
[9] Ng, A. Y., & Jordan, M. I. (2002). On discriminative vs. generative classifiers: A comparison of logistic regression and naive bayes. In Advances in neural information processing systems (pp. 841-848).
[11] Ramos, J. (2003, December). Using tf-idf to determine word relevance in document queries. In Proceedings of the first instructional conference on machine learning (Vol. 242, pp. 133-142).
[12] Leung, K. M. (2007). Naive bayesian classifier. Polytechnic University Department of Computer Science/Finance and Risk Engineering.
[13] Rish, I. (2001, August). An empirical study of the naive Bayes classifier. In IJCAI 2001 workshop on empirical methods in artificial intelligence (Vol. 3, No. 22, pp. 41-46).
[14] Agarwal, A., Xie, B., Vovsha, I., Rambow, O., &Passonneau, R. (2011, June). Sentiment analysis of twitter data. In Proceedings of the workshop on languages in social media(pp. 30-38). Association for Computational Linguistics.
[15] Hughes, A. J., Daniel, S. E., Kilford, L., & Lees, A. J. (1992). Accuracy of clinical diagnosis of idiopathic Parkinson's disease: a clinico-pathological study of 100 cases. Journal of Neurology, Neurosurgery & Psychiatry, 55(3), 181-184.
[16] Gao, C., et al., Semantic trajectory compression via multi-resolution synchronization-based clustering. Knowledge-Based Systems, 2019.
[17] Santo, K., et al., Mobile phone apps to improve medication adherence: a systematic stepwise process to identify high-quality apps. JMIR mHealth and uHealth, 2016. 4(4): p. e132.
[18] Barlas, P., I. Lanning, and C. Heavey, A survey of open source data science tools. International Journal of Intelligent Computing and Cybernetics, 2015. 8(3): p. 232-261.
[19] Sachs, J.S., Recognition memory for syntactic and semantic aspects of connected discourse. Perception & Psychophysics, 1967. 2(9): p. 437-442.
[20] Alhersh, T., Belhaouari, S. B., & Stuckenschmidt, H. (2019). Action recognition using local visual descriptors and inertial data. Paper presented at the European Conference on Ambient Intelligence.
[21] Kausar, N., Samir, B. B., Abdullah, A., Ahmad, I., & Hussain, M. (2011, November). A review of classification approaches using support vector machine in intrusion detection. In International Conference on Informatics Engineering and Information Science (pp. 24-34). Springer, Berlin, Heidelberg.
statistical encoding method. In 2016 International Joint Conference on Neural Networks (IJCNN) (pp. 1224-1228). IEEE.
[23] Samir Brahim Belhaouari, Hamada Al-Absi, “Probabilistic Correlation Template Matching
and C-k-NN classification based on Wavelet Features for Robust Generic Object Detection:
An application to face and breast cancer “, submitted to Journal Computers in Biology and
Medicine, August 2018.
[24] Samir Brahim Belhaouari, “A new enlightenment about gaps between primes”,Submitted to Hardy-Ramanujan Journal,16 January 2019.
[25] Wasserman, A. I. (2010, November). Software engineering issues for mobile application development. In Proceedings of the FSE/SDP workshop on Future of software engineering research (pp. 397-400).
[26] Gamal, D.; Alfonse, M.; M. El-Horbaty, E.-S.; M. Salem, A.-B. Analysis of Machine Learning Algorithms for Opinion Mining in Different Domains. Mach. Learn. Knowl. Extr. 2019, 1, 224-234.
[27] Tayfur, G.; Singh, V.P.; Moramarco, T.; Barbetta, S. Flood Hydrograph Prediction Using Machine Learning Methods. Water 2018, 10, 968.
[28] Zydney, J. M., & Warner, Z. (2016). Mobile apps for science learning: Review of research. Computers & Education, 94, 1-17. Thrane, T. (1980).
[29] Referential-semantic analysis: aspects of a theory of linguistic reference. McIlroy, S., Ali, N., & Hassan, A. E. (2016). Fresh apps: an empirical study of frequently-updated mobile apps in the Google play store. Empirical Software Engineering, 21(3), 1346-1370.
[30] Kakabadse, A., & Korac‐Kakabadse, N. (2000). Leading the pack: future role of IS/IT
professionals. Journal of Management Development.
[31] Abernathy, J. L., Beyer, B., Downes, J. F., & Rapley, E. T. (2019). High-Quality Information Technology and Capital Investment Decisions. Journal of Information Systems.
[32] Abran, A. (2015). Software project estimation: the fundamentals for providing high quality information to decision makers. John Wiley & Sons. Fillmore, C. J., & Baker, C. (2010).
[35] Li, X., Zhang, B., Zhang, Z., & Stefanidis, K. (2020). A Sentiment-Statistical Approach for Identifying Problematic Mobile App Updates Based on User Reviews. Information, 11(3), 152.
[36] Talukdar, S., Singha, P., Mahato, S., Pal, S., Liou, Y. A., & Rahman, A. (2020). Land-Use Land-Cover Classification by Machine Learning Classifiers for Satellite Observations—A Review. Remote Sensing, 12(7), 1135.
[37] Song, J., Kim, D. J., & Kang, K. M. (2020). Automated Procurement of Training Data for Machine Learning Algorithm on Ship Detection Using AIS Information. Remote Sensing, 12(9), 1443.
[38] Grbčić, L., Lučin, I., Kranjčević, L., & Družeta, S. (2020). A Machine Learning-based Algorithm for Water Network Contamination Source Localization. Sensors, 20(9), 2613.
[39] Nam, S.; Lee, H.C. A Text Analytics-Based Importance Performance Analysis and Its Application to Airline Service. Sustainability 2019, 11, 6153.
[40] Saura, J.R.; Reyes-Menendez, A.; Bennett, D.R. How to Extract Meaningful Insights from UGC: A Knowledge-Based Method Applied to Education. Appl. Sci. 2019, 9, 4603.
[41] Tao, Y.; Zhang, F.; Shi, C.; Chen, Y. Social Media Data-Based Sentiment Analysis of Tourists’
Air Quality Perceptions. Sustainability 2019, 11, 5070.