© 2014, IJCSMC All Rights Reserved
609
Available Online atwww.ijcsmc.com
International Journal of Computer Science and Mobile Computing
A Monthly Journal of Computer Science and Information Technology
ISSN 2320–088X
IJCSMC, Vol. 3, Issue. 3, March 2014, pg.609 – 615
RESEARCH ARTICLE
Estimation and Detection of Blood Pressure
Using Smart Phones without Using Cuff
V.Sathya
1, R.Mohan Raj
2¹PG Scholar, Department of Electronics and Communication Engg, Anna University, Tamil Nadu ²Assistant Professor, Department of Electronics and Communication Engg, Anna University, Tamil Nadu
1
[email protected]; 2 [email protected]
Abstract— Smart phones are very popular in today’s life. Cameras with high resolution, High end processors and built-in sensors such as accelerometer, orientation sensor and light-sensors are equipped in today’s phones. Motivated by this statistic and the diverse capability of smart phones, we focus on utilizing them for biomedical applications. Blood pressure is a significant vital sign; blood pressure monitoring has a great significance to determine the health status of patients. In this project blood pressure, Temperature and heart beat are estimated by using sensors and the result is viewed in smart phones by using GSM and if any abnormal result is showed then the result is send to the particular mobile number through SMS. An application is created in smart phone to view the result in waveform. We estimate the systolic and diastolic pressure. It would be useful to have a device which can measure all vital signs in such an event. Transmission of the vital signs measured using the smart phone can be a life saver in critical situations.
Keywords— Blood Pressure, Finger Pulse, Vascular Transit Time, Cuffless, Temperature, Heart Beat, GSM
I. INTRODUCTION
When sudden dizziness occurs during unexpected situations it is very necessary to measure the vital signals of a human. The only information that we know at these situations are the most common symptoms of low blood pressure. Blood pressure depends on factors such as the amount of blood in the body, the flexibility of the arterial walls, the heart pumping rate and the resistance to blood flow because of the size of the arteries. The blood pressure of a human varies continuously due to anxiety, physical activity, emotions and medication. The body has unique mechanisms to regulate a person’s blood flow; the heart rate increases to pump more blood whenever a person’s blood pressure decreases, and to increase the blood pressure the arterial walls get contract. Blood pressure is generally measured using a mercury sphygmomanometer. We hereby propose a mobile phone-based blood pressure estimation technique by using external sensors. In other words, we replace the traditional cuff and stethoscope traditionally used for blood pressure measurement. The blood pressure estimation phase involves calculation of pulse pressure, systolic and the diastolic pressure using the data measured.
II. METHODOLOGY
A. Pulse Detection
© 2014, IJCSMC All Rights Reserved
610
approximated based on the amount of blood in the person for his age, calculated from ET. In the case of loss of blood or deficiency of blood due to abnormality the accuracy may change. The VTT was analysed based on the audio and video samples measured together. VTT can be derived for every single pulse in the data set. However, the VTT can change on every pulse since there is a continuous variation of pressure in a human throughout the day. By using this method for a single VTT value the systolic pressure was determined but the probability of erroneous results was high.B. Heart Rate Calculation
In my proposed System, Heart Beat can be estimated using heart beat sensor. It provides a simple way to study the heart's function. The flow of blood through Finger is monitored by this sensor. The amount of blood in the Finger changes with time when the heart forces blood through the blood vessels in the Finger. The signal is amplified then inverted and then filtered in the circuit. The heart rate can be determined with the help of graph and some details of the pumping action of the heart can be seen on the graph. Place the finger over the sensor so the following observations are made.
The capillaries are rich in blood during a systolic pulse; more light was absorbed by the blood, results in a low reflective index and darker frame intensities. Likewise most of the light was reflected leads to bright frames during a diastolic pulse. The change in intensity of light passed through the finger creating an alternative pattern of waves. These changes in intensity with time were used to obtain the pulse of a person
FIG 1 Identification of Peaks: Sys represents Systolic Pressure
At the start of the heartbeat the blood flowing through the Finger rises as shown in the graph. This is caused because of the contraction of the ventricles forcing blood into the arteries. After the first peak, a second smaller peak is observed. This is caused because of the shutting of the heart valve, which raises the pressure in the arteries and the earlobe at the end of the active phase.
C. Blood pressure Calculation
The
Blood Pressure can be calculated using following EquationsCO=SV x HR
SV=EDV-ESV
CO=(EDV-ESV) x HR
BP=CO x RESISTANCE
© 2014, IJCSMC All Rights Reserved
611
D. Temperature Calculation
The LM35 (Temperature Sensor) Output given as Input to LM358 for amplification purpose. The amplified analog Output from LM358 given as Input to the ADC and the corresponding Digital Output is read in the screen.
E. LM35 Sensor
The LM35 series are precision IC temperature sensors. The output voltage is linearly proportional to the Celsius temperature. This has an advantage over linear temperature sensors calibrated in °Kelvin. In order to obtain convenient Centigrade scaling there is no need to subtract large constant voltage from its output. There is no need for any external calibration to provide typical accuracies of ±1⁄4°C at room temperature and ±3⁄4°C over a full −55 to +150°C temperature range. Low cost is assured because of calibration at the wafer level. Interfacing to readout or control circuitry become easy due to the linear output, the low output impedance and precise inherent calibration. It can be used with plus and minus supplies or with single power supplies. It draws only 60 μA from its supply, this sensor has very low self-heating, less than 0.1°C in still air. This sensor is rated to operate over a −55° to +150°C temperature range, while the LM35C is rated for a −40° to +110°C range (−1 0° with improved accuracy). It is available in hermetic TO-46 transistor packages, while the LM35D, LM35CA, and LM35C are also available in the plastic TO-92 transistor package. The LM35D sensor is also available in an 8-lead surface.
F. Features
Linear + 10.0 mV/°C scale factor 0.5°C accuracy
Calibrated directly in ° Celsius
Rated for full −55° to +150°C range
Suitable for remote applications Low cost due to wafer-level trimming Less than 60 μA current drain
Operates from 4 to 30 volts Low self-heating, 0.08°C in still air
G. Applications
As other IC temperature sensors, the LM35 can also be applied easily .It can be cemented to a surface. Its temperature will be within about 0.01°C of the surface temperature. This presumes that the ambient air temperature is almost the same as the surface temperature; When the air temperature were much higher or lower than the surface temperature, the actual temperature of the LM35 die would be at an intermediate temperature between these two temperatures. This is particularly true for the TO-92 plastic package. Here the copper leads are the principal thermal path to carry heat into the device. Its temperature might be closer to the air temperature than to the surface temperature. To minimize this problem, Make sure that the wiring to the LM35 is held at the same temperature as the surface of interest.
H. LM358-Single Supply Dual Operational Amplifiers
© 2014, IJCSMC All Rights Reserved
612
I. Block Diagram
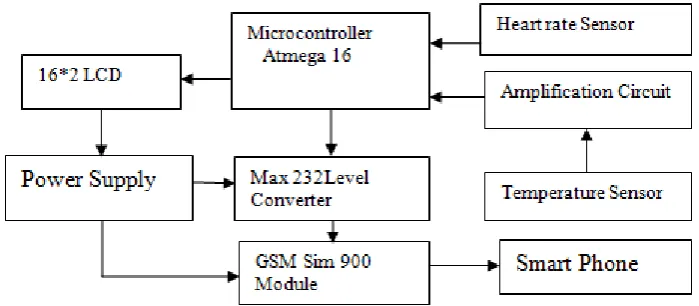
FIG 2 Block Diagram of Estimation of BP Using Sensor and Mobile Phone
The block diagram consists of Power supply, Atmega 16 microcontroller, 16*2 LCD, Max 232 Level Converter, GSM sim900 module, Heart rate sensor and Temperature Sensor and Amplification Circuit and smart phone.
These sensors are integrated with IC and the software used is embedded c. These sensors sense the parameters and by using GSM the values are sending to any smart phone. An application is created in high end processor smart phone for showing the result in waveform and also in reading format. The software used may be java, android like high end processor supporting languages. If any abnormal value is received then that values are send to the particular mobile number through SMS.
J. GSM
SIM900 is very compact in size and easy to use as plug in GSM Modem.GSM/GPRS RS232 Modem is built with SIMCOM Make SIM900 Quad-band GSM/GPRS engine, it works on frequencies 850 MHz, 900 MHz, 1800 MHz and 1900 MHz. It is designed with RS232 Level converter circuitry and it allows us to directly interface PC Serial port .The baud rate can be configurable from 9600-115200 through AT command. Initially Modem is in Auto baud mode. This Modem is having internal TCP/IP stack to enable as to connect with internet via GPRS. It is suitable for SMS as well as DATA transfer application in M2M interface. This modem needs only 3 wires (Tx, Rx, and GND) except Power supply to interface with microcontroller/Host PC. Connect wide range of unregulated power supply (4.2V -13V) with the help of the built in Low Dropout Linear voltage regulator. Using this modem, it is possible to send & Read SMS, connect to internet via GPRS through simple AT commands.
K. Features
High Quality Product
Normal operation temperature: -20 °C to +55 °C Quad-Band GSM/GPRS 850/ 900/ 1800/ 1900 MHz
Input Voltage: 5V-12V DC
Built in RS232 Level Converter (MAX3232) Configurable baud rate
SMA connector with GSM L Type Antenna.
Inbuilt Powerful TCP/IP protocol stack for internet data transfer over GPRS.
Audio interface Connector
L. Specifications
Point to point MO and MT
SMS cell broadcast
FTP/HTTP
© 2014, IJCSMC All Rights Reserved
613
MMS
Java (cooperate with IA Solution)
Embedded AT
Text and PDU mode
Software features
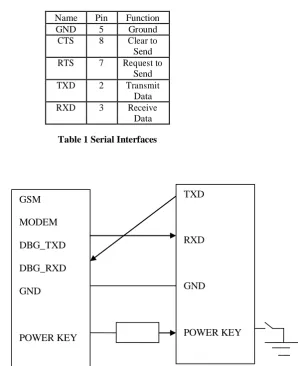
Table 1 Serial Interfaces
FIG 3 GSM Modem and Controller Connection
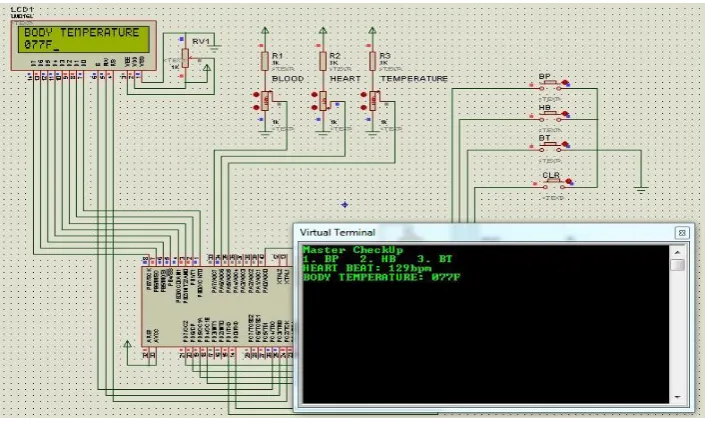
III.SIMULATION
The inputs are given with the help of potentiometer (varying resistor) to the Atmega16 microcontroller. The ADC in Atmega16 micro controller converts the analog signals into digital signals. These are done on the proteus simulation software. The controller c code is build using AVR Studio compiler software. This compiler converts c code into hex code. These hex codes are loaded in Proteus.The hardware part of this project is designed to measure human temperature, pressure and heart beat. Also the measured parameter is send to specific mobile number. Since all these biological analog signals are in milli volts, they have to be amplified. For amplification we use in build amplifier in the ADC port of Atmega16 controller.
Name Pin Function
GND 5 Ground
CTS 8 Clear to
Send
RTS 7 Request to
Send
TXD 2 Transmit
Data
RXD 3 Receive
© 2014, IJCSMC All Rights Reserved
614
FIG 4 Screen Shot for Blood Pressure Output
FIG 5 Screen Shot for Temperature Output
IV.CONCLUSION
© 2014, IJCSMC All Rights Reserved
615
REFERENCES
[1]C. Scully, J. Lee, J. Meyer, A. Gorbach, D. Granquist, Fraser, Y. Mendelson, and K. Chon, “Physiological parameter monito ring from optical recordings with a mobile phone,” IEEE Trans. Biomed. Eng., vol. 99, no. 5, pp. 749–898, 2011.
[2]J. E and L. Martin, “Investigating a smartphone imaging unit for photoplethysmography,” Physiol. Meas., vol. 31, no. 11, pp. N79–N83, 2010.
[3]S. Lv, Y. Lu, and Y. Ji, “An enhanced IEEE 1588 time synchronization for asymmetric communication link in packet transport network,” Commun.Lett., vol. 14, no. 8, pp. 764–766, 2010.
[4]Bluez: Bluetooth Stack for Android. [Online]. Available http://source.android.com/porting/bluetooth.html. [5]L. S. Bickley, Bate’s Guide to Physical Examination and History Taking, 8th ed. Baltimore, MD: Lippincott Williams & Wilkins, 2002.
[6]Heart Sounds Types and Locations. [Online]. Available: http://en.wikipedia.org/wiki/Heart_sounds.
[7]K. Banitsas, P. Pelegris, T. Orbach, D. Cavouras, K. Sidiropoulos, and S. Kostopoulos, “A simple algorithm to monitor hr for real time treatment applications,” in Proc. Int. Conf. Inf. Technol. Appl. Biomed., Nov. 2009,pp. 1–5.
[8]G. K. Palshikar, “Simple algorithms for peak detection in time-series,” in Proc. 1st Int. Conf. Adv. Data Anal., Business Anal. Intell., 2009.
[9]J.Y.A. Foo, C. S. Lim, and P.Wang. (2006). “Evaluation of blood pressure changes using vascular transit time,” Physiol. Meas. [Online]. 27(8), p. 685, Available: http://stacks.iop.org/0967-3334/27/i=8/a=003.
[10]J. N. Cohn, S. Finkelstein, G. McVeigh, D. Morgan, L. LeMay, J. Robinson, and J. Mock. (1995). “Noninvasive pulse wave analysis for the early detection of vascular disease,” Hypertension. [Online]. 26(3), pp. 503–508, Available: http://hyper.ahajournals.org/cgi/content/abstract/26/3/503.