Coordination of Process Integration and
Exergoeconomic Methodology for Analysis
and Optimization of a Pulp and Paper Mill
M. Fani
1, A.A. Mozafari
1;and B. Farhanieh
1Abstract. By simultaneously applying pinch technology and the exergoeconomic method to a complex process system, benecial and energy-ecient measures are identied. The \three-link-model" exergoeco-nomic methodology optimizes the design and operability of a system. In this work, contrary to traditional exergoeconomic methods, a reversed method is used. The approach proposed for the optimization of such a complex system is to iteratively optimize subsystems. Since the reversed exergoeconomic method is used, assumptions considered by Tsatsaronis (based on four assumptions for calculating the cost-optimal exergetic eciency and relative cost dierence) are not applicable and new assumptions are to be considered. Unlike traditional exergoeconomic methods, the product exergetic specic cost is considered to be known and the objective will be to maximize the exergetic cost of the fuel. Heat ows costs are calculated with the assistance of a Pinch analysis. The strength of the combination of a Pinch analysis and the exergoeconomic method is elucidated in a case study applied to the Mazandaran wood and paper industry. Replacement of the pressure valve and Direct Cyclone Contact Evaporation (DCCE) is proposed, while by selection of the optimum decision variable and applying Pinch technology simultaneously, the recoverable black liquor could be increased by 7% and energy consumption decreased by 12%.
Keywords: Pinch technology; Exergoeconomic methodology; Process system; Optimization; Pulp and paper.
INTRODUCTION
The pulp and paper industry is under increasing pres-sure to reduce its impact on the environment and its energy consumption. When modeling a system, it is very important to know where to introduce the system boundaries. Dierent results may be obtained, based on the boundaries chosen.
Pinch technology is a method to improve Heat Exchanger Networks (HEN), only improving the struc-ture of a HEN under specic conditions. One key to good energy eciency is the exchange of heat in the most eective way between components within the system, thereby cutting the need for additional heating or cooling [1]. The application of process integration tools and methods in the pulp and paper industry dates back to the 1990's when Pinch analyses of pulp and
1. Department of Mechanical Engineering, Sharif University of Technology, Tehran, P.O. Box 11155-9567, Iran.
*. Corresponding author. E-mail: [email protected] Received 23 July 2007; received in revised form 21 May 2008; accepted 24 November 2008
paper mills were rst made. It was not until the late 1990's and early 2000's that process integration became more widely used as a tool for energy analysis and retrot application in the pulp and paper industry [2]. Noel generalized the use of a Pinch analysis in pulp and paper mills in 1995 by applying the Pinch analysis to steam, water and liquor streams and, also, direct heat exchangers for the retrotting of existing heat changer networks [3,4].
In 1999, Lombardo et al. [5] practiced Pinch and exergy analysis on a Kraft pulp and paper mill retrotting. However, only indirect heat exchangers were considered and the exergy analysis was applied to each unit individually. The Department of Heat and Power Technology at Chalmers University of Technol-ogy in Sweden is a pioneer in the retrotting of the pulp and paper industry and also in application of the Pinch analysis to pulp and paper mills [6-10].
Paris et al. have applied MILP (Mixed Integer Linear Programming) and Pinch technology to a pulp and paper mill and energy and exergy recovery oppor-tunities have been examined to improve integration of
the utility system. The MILP optimization targeting method has been applied to identify the best energy conversion options and to optimize production of com-bined heat and power [11].
Exergoeconomics combine exergy analysis and economic principles to provide the system designer with information not available through conventional energy analysis and economic evaluations, but crucial to the design and operation of a cost-eective system. A general methodology for this kind of analysis was presented by Tsatsaronis in 1985 [12] which was later called the exergoeconomic accounting technique [13]. In recent years, a dierent direction of developments in exergoeconomics has been taken and presented by Tsatsaronis et al. [14-18], Valero et al. [19-22], Fragopoulos [23] and Spakovsky [24]. Tsatsaronis introduces an iterative exergoeconomic optimization procedure based on exergoeconomic variables (relative cost dierence, exergoeconomic factor and exergetic eciency) and minimization of the product cost of each system; components are treated in thermoeconomic iso-lation. In the case of pulp and paper making processes, the problem, due to the high number of simultaneous products, is more complex compared to cogeneration systems producing only heat and power. Few studies have proceeded to systems which produce products other than heat and power [25-28]. No studies have applied exergoeconomics to pulp and paper processes (energy use and recovery processes).
APPLYING REVERSED EXERGY
COSTING METHOD TO RECOVERY LINK Exergy improvement potential is a measure for deter-mining system performance, showing how much and how easy the system could be improved for optimiza-tion purposes [26].
Pot = Irr(1 ") + Efl; (1)
where:
Irr =XEF
X
EP; (2)
" =EEntp
nts =
EP
EF; (3)
Efl =XErejected to the environment: (4)
It is formed by three contributions: Absolute potential (Irr), relative potential (1 ") and environmental potential (Efl). The relative potential (1 ") is a mea-sure showing the system potential for improvement; if the eectiveness is very low, the relative potential approaches its maximum value, so in principle the system could be improved from inside itself. In order
to optimize a system, it is necessary to preferably ap-proach the blocks with the higher exergy improvement potential.
Exergoeconomic traditional sequential costing methods deal with energy systems; systems which convert one certain type of energy into another. Con-versely, process systems produce certain products from certain raw materials.
Decomposition strategies have been proposed to reduce the complexity of complete systems. A `three-link-model' energy/mass structure for process systems is proposed by Zhang et al. [25]; a rigorous quantitative mathematical energy/mass model which is suitable for any process system. This study is based on a `reversed costing' strategy for computing recoverable energy/mass costs in recovery subsystems.
This model makes it possible to divide whole sys-tems into main subsyssys-tems and recovery subsyssys-tems, optimizing each subsystem separately and improving the total system towards an optimum state. The `energy/mass recovery' link recovers raw materials needed for main subsystems in addition to energy.
In many systems, production costs are being reduced by the recovery of whole or parts of rejected streams. With the development of technology and changes in economical conditions and environment constraints, it has become possible to recover rejected energy/mass more and more eectively. The cost of recoverable exergy depends on the extent of recovery. Therefore, only the reversed exergy costing principle is available. The money balance equation for the recovery link is as follows [25]:
X
j
cOjEOj+
X
i
cDjEDj+
X
j
ZRj
=X
i
cEjEEj+
X
i
cRiERi: (5)
The exergy-mass-economic model for the recovery link is shown in Figure 1.
Equation 5 diers from a conventional money balance. In this equation, the unknown term, cOj
is not at the right side of the equation, but at the left side. First, the quantity of the recycled exergy, ERi, and the recovered export exergy, EEi, as well
as their costs, cRi and cEj, respectively, should be
determined.
`Reversed costing' means that the cost of the recoverable exergy EO depends on the cost of the
recovery driving exergy EDand the exergies recovered
from the energy-recovery subsystem, ER and EE.
Factor cDwill be calculated from the energy-conversion
link by using a sequential costing method.
The next step is determination of cEand cR. Two
Figure 1. Recovery link exergy-mass-economic model.
1. If cE is the specic cost of power, its cost is the
same as the market cost of the same ow;
2. If cEis the specic cost of heat, it can be calculated
with the assistance of a Pinch analysis. cR is the
same as the market price of the same material. These principles connect the energy use subsys-tem to the energy/mass recovery subsyssubsys-tem and have a great inuence on the optimization results. The cost of the irreversible, euent and total exergy losses of each unit and their exergoeconomic improvement potential is then calculated with the following expressions:
Cirr;U = Irr ctte;U; (6)
Cefl;U = Efl ctte;U; (7)
PotecU = Cirr;U(1 ") + Cefl;U; (8)
where: ctte;U =
PIN
i=1EUici
Ette;U : (9)
CALCULATING HEAT FLOW COST
For calculating cE by Pinch technology, rst
energy-use link warm and cold streams are identied from mass and energy balance process simulations. The heat carrying streams are listed. Composite curves have to be drawn; minimum hot and cold utility requirements can be evaluated from composite curves and network capital cost has also to be calculated. In the next step, all warm and cold streams plus the \recovered stream" from the recovery link (the cost of which has to be calculated) are identied. Minimum hot and cold utility requirements and network capital cost will again be evaluated. The specic cost of a recovered stream
is evaluated as follows:
cE =(Qmin;1 QEmin;2) ceD E
(network capital cost2 network capital cost1)
EE (10):
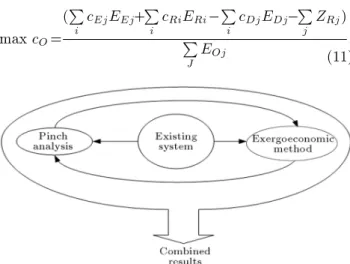
COORDINATION OF EXERGOECONOMIC METHOD AND PINCH TECHNOLOGY Bengtsson et al. have proposed a structure for combin-ing Pinch technology and the MIND method [6]. The proposed procedure for combining Pinch technology and the MIND method is iterative. In this study, a similar structure is proposed for combining Pinch tech-nology and the exergoeconomic method (see Figure 2). The iterative procedure may be accomplished by using the exergoeconomic analysis to determine an investment opportunity for dierent alternatives. OPTIMIZATION OF SYSTEM
The objective of this study is to minimize the total cost of mass and energy consumption, exergy destruction and the investment equipment for the whole system. Apart from investment and maintenance costs, the system's essential costs consist of electricity, steam and raw material costs. Therefore, the goal is to reduce their consumption. Exergoeconomic and Pinch methodology is applied for optimization, where Pinch analysis is applied to the whole system. In this study, since the energy/mass recovery subsystem is the most energy consuming subsystem, exergoeconomics are applied only to this subsystem. According to the reversed costing strategy proposed by Zhang et al. [25], the goal is to get the maximum cost of the recoverable mass, EO, at the minimum driving exergy, ED. The
objective function of exergoeconomic optimization is: max cO=
(P
i cEjEEj+
P
i cRiERi
P
i cDjEDj
P
j ZRj)
P
J EOj
: (11)
cO is the coordinating variable of the energy-use link
and mass/energy recovery link. Mass/energy recovery link optimization is done under the boundary con-straint, EO, which produces the optimization results
of ED and the new value of cO. Iteratively, an
optimization of the whole system and forward recovery link will be done. The feasible coordinating rules are:
(cOj)k+1= (cOj)k; (12)
(EOj)k+1= (EOj)k: (13)
The convergence judgment rules are:
j(cOj)k+1 (cOj)kj ": (14)
Because of system complexity and the unavailability of input data and functions required, especially for black liquor, mathematical techniques cannot be used for optimization.
The usual approach to the optimization of such a complex system is to iteratively optimize subsys-tems. An alternative to this approach is an it-erative exergoeconomic optimization technique pro-posed by Tsatsaronis, which consisting of seven steps [13].
Among the most important parameters in such an optimization are cost-optimal values for exergetic eciency and the relative cost dierence. Tsatsa-ronis [13] has proposed an approach, based on four assumptions, for calculating the cost-optimal exergetic eciency and relative cost dierence for a component isolated from the remaining system components. In this study, since a reversed exergoeconomic method is used, the assumptions considered by Tsatsaronis are no longer valid and new assumptions have to be considered. These assumptions are as follows:
1. The exergy ow rate of fuel, _EF, and the unit
cost of product, cP, remain constant for the kth
component:
_EF;k= constant; (15)
and:
cP;k= constatnt: (16)
2. Every system component investment cost increases with its capacity and exergetic eciency. The total capital investment of the kth component can be represented by:
TCIk = Bk
"k
1 "k
nk _Emk
F;k; (17)
where: "k = EEP;k
F;k:
Parameter Bk and exponents nk and mk are
con-stant. These parameters are calculated by use of a purchased-equipment cost and least square method. 3. Annual levelized operating and maintenance costs attributed to the kth component are considered as:
ZOM
k = k(TCIk) + !k _EF;k+ Rk: (18)
The coecient kfor such a system is considered as
0.1; !k is a constant that accounts for the variable
operating and maintenance costs associated with the kth component and denotes the O & M cost per unit of the product exergy; is the average annual time of plant operation at the nominal load; and Rk includes all the remaining operating and
maintenance costs that are independent of the total capital investment and the exergy of the product. The last two terms on the right side (!k _EF;k and
Rk) may be neglected since they are small compared
with the remaining term.
4. This study tries to optimize an established system, ZCI
k = 0, by which Equations 19 to 21 are obtained:
Zk= ZkCI+ ZkOM= ZkOM
= k(TCIk) + !k _EP;k+ Rk: (19)
Thus, cost rate will be obtained as:
_Zk= k(TCIk) + !k _EF;k+Rk: (20)
By use of Equation 20: _Zk= kBk
"k
1 "k
nk _Emk
F;k
+ !k _EF;k+Rk: (21)
The objective function to be maximized expresses the cost per exergy unit of product for the kth compo-nent. Accordingly:
Maximize cF;k= cP;k _E_EP;k _Zk
F;k : (22)
So:
Maximize cF;k= cP;k"k Ek1 mBkk
F;k
"k
1 "k
nk
+ !k+ Rk
_EF;k: (23)
During each iteration of optimization parameters ; k; ; !k and Rk remain constant. "k is the only
The maximum cost per exergy unit of fuel is obtained by dierentiating the above equation and setting the derivative to zero:
dcF;k
d"k = 0: (24)
Finally, Equation 25 is achieved, which has to be solved by numerical methods (contrary to direct exergoeco-nomic methods) for "OPT
k :
kBknk
_E1 mk
F;k cP;k =
(1 "OPT k )nk+1
("OPT k )nk 1
: (25)
Another useful and important variable for optimization is the relative cost dierence:
rk= cP;kc cF;k
F;k ; (26)
or:
rk= cP;k _EP;kc cF;k _EP;k
F;k _EP;k : (27)
Equations 28 and 29 are used for eliminating _EP;k:
_EP;k= _EF;k+ _ED;k+ _EL;k; (28)
cP;k _EP;k= cF _EF;k+ _Zk: (29)
So:
cP;k _EF;k= cF;k _EF;k+ cP;k _EL;k+ cP;k_ED;k+ _Z:
(30) Finally, the following relation is achieved:
rOPT
k = cP;kE_F;k1
cP;k( _ED;k+ _EL;k)+ _ZOPT 1
: (31)
Tsatsaronis' priority for optimization of components in the iterative exergoeconomic optimization technique is ( _Zk + CD;k) [13]. The optimization proposed in this
study species its priority based on exergoeconomic and exergetic improvement potentials. Components with small exergoeconomic improvement potential, but acceptable exergetic improvement potential, have to be replaced. Components with high exergoeconomic and exergetic improvement potential are the best com-ponents for improvement and modication. Compo-nents which have very low exergoeconomic improve-ment potential are not worth any capital investimprove-ment. Components with low exergoeconomic and exergetic improvement potential and high exergetic eciency are considered optimum.
CASE STUDY Mill Description
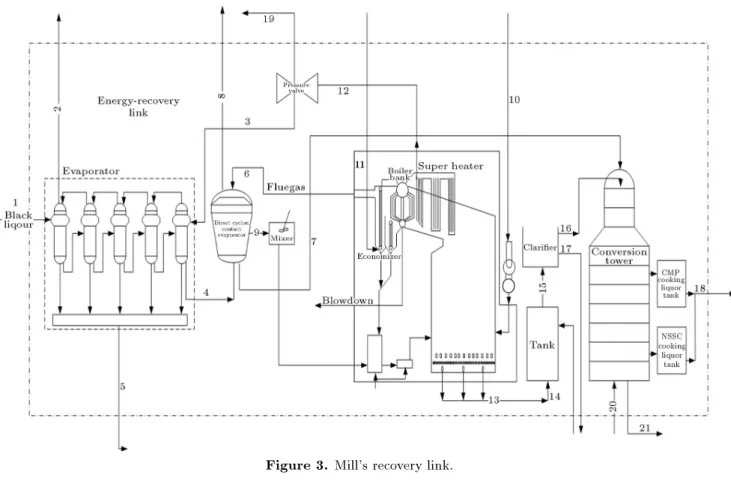
The paper mill under consideration is an Iranian pulp and paper mill with a capacity of 600 tons/day. This mill is a Chemical Thermal Mechanical Pulp (CTMP) integrated mill. The euent that is to be evaporated is from the CMTP plant, amounting to 137.9 tons/h, with a Dry Solid (DS) content of 5%, which is evaporated to a nal content of 63% DS before incineration in the recovery boiler.
Evaporation of the euent means that the it is divided into two fractions, clean condensates and residue with a high content of dry substance, containing both organic and inorganic material. The residue can be combusted in the recovery boiler and condensates can be reused in the process, thereby increasing the eciency of the mill. The recovery link is shown in Figure 3.
The following assumptions have been considered during a simulation of the recovery link:
System operates under steady state conditions. Ideal-gas mixture principles are applied to air and
combustion products.
Combustion in the recovery boiler chamber and conversion tower is complete.
Except for the recovery boiler, all components oper-ate without heat loss.
Applying Pinch to Heat Exchanger Network The main aim is to make a survey of the excess heat in the system, with unchanged live steam consumption, therefore some parts of the system are excluded. These parts are steam consumers such as paper machines, digesters and cold streams whose heat demands, due to process conditions, have to be met with steam. The heat supplied from incinerating the euent residue is neglected because the heating value is poor. Table 1 summarizes the cold and hot streams chosen for the formation of cold and hot composite curves.
For streams containing ber, water and/or liquor, cp, is calculated by use of the following relations:
cp= (0:005 + 1:092
Tin+ Tout
2
consistency=100 + (1 consistency)4:178; (32)
where consistency is dened as [29]: consistency = _m _mber
ber+ _mwater: (33)
After computing streams Tin; Tout; cp and _m, the hot
Figure 3. Mill's recovery link.
Table 1. Summary of cold and hot streams. Cold Streams Hot Streams Inlet chips
Black liquor White liquor
Fresh water Euent Process water Blow steam
Evaporator inlet Evaporator condensate Boiler make up water
Process pulp*
* Only pulps whose temperature has to increase considerably.
minimum temperature driving force for heat transfer from hot to cold streams (Tmin) of 25C, selected
according to the process constraints and investment criteria of the mill. Figure 4 shows the Mazandaran mill's cold and hot composite curve.
APPLYING EXERGOECONOMIC METHOD TO THE MILL
An exergetic and exergoeconomic system analysis is performed to determine all mass, exergy, exergy de-struction, exergetic cost, exergy destruction cost, com-ponent investment cost ow rates, comcom-ponent exergetic eciencies and system total cost.
Figure 4. Mill's cold and hot composite curve.
Selection of the independent variables for char-acterizing design options is very important. All important variables that aect the performance and cost eectiveness of the system must be included. Independent variables whose values are amenable have to be distinguished; only decision variables may be varied. Decision variables for cogeneration systems have been presented and introduced, but since the system under consideration is a process system, se-lection of its decision variables is not the same as energy systems. Choosing decision variables is dicult, especially because some variables aect the product cost without inuencing the eectiveness of the system ne details, thus, variables of minor importance should
not be included. Compounded methodology is used for the identication of decision variables that aect the cost and exergetic eciency of the system. This methodology combines recent available exergoeconomic techniques with new qualitative and quantitative crite-ria [30].
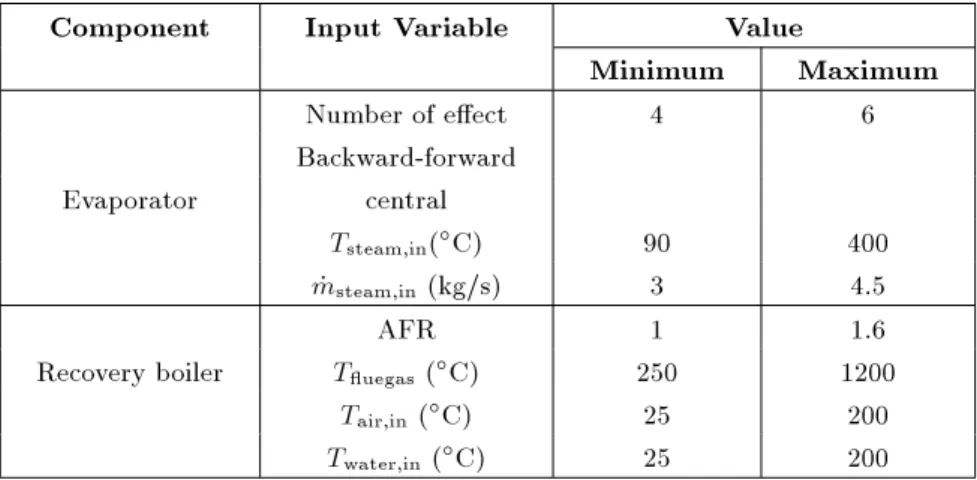
Table 2 shows decision variables and their limits for the system under consideration.
OPTIMIZATION
Tsatsaronis has proposed an iterative optimization pro-cedure for complex systems, consisting of the following steps [13]:
For components, particularly the ones having a relatively high value of the sum ( _Zk + _CD;k), "k
and rk, the calculation for one decision variable
changes, while other decision variables are kept constant, where:
"k ="k " OPT k
"OPT
k 100; (34)
rk= rk r OPT k
rOPT
k 100: (35)
The eects of the decision variables are examined on the objective function. If, in comparison with the previous design, this value has been improved, it may be decided to proceed with another iteration. However, if the value of the objective function is not better in the new design than in the previous one, some design changes may either be revised or a previous step be repeated.
Repetition of the above steps for the other decision variables.
Among design guidelines, some are very useful when considering a recovery link. These are:
Maximizing the use of cogeneration of power and process steam, this can be interpreted as the use of a turbine instead of a pressure valve.
Minimizing the mixing of streams with dier-ent temperatures, DCCE (Direct Cyclone Contact Evaporation) can be replaced by an indirect heat exchanger.
Minimizing the use of combustion or preheating the reactants and minimizing the use of excess air.
The use of these guidelines can reduce the total number of iterations required.
In this study, exergoeconomic and exergetic im-provement potential are used instead of ( _Zk+ _CD;K),
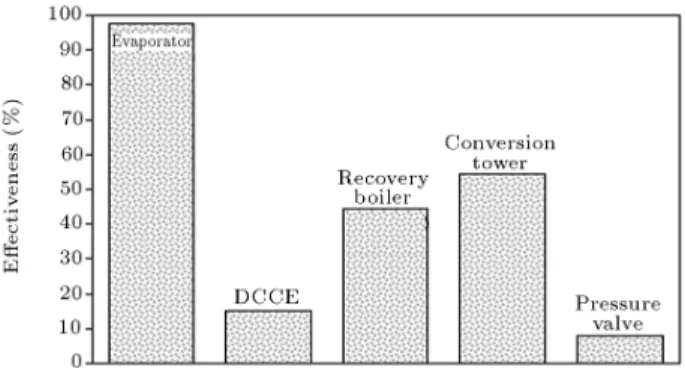
specifying the order of component modication. Fig-ures 5 and 6, respectively, show the exergetic and exergoeconomic improvement potential of the compo-nents and exergetic eciency at initial decision variable values.
These gures give ideas about conditions when encountering dierent components. For example, the evaporator is optimum, however decision variable changes can improve its function. DCCE and pressure valve replacement is proposed, while the recovery boiler and conversion tower can be modied. It should be noted that the conversion tower low eciency and
Figure 5. Exergetic and exergoeconomic improvement potential of components at initial decision variable values.
Table 2. Decision variables of all components and their limit. Component Input Variable Value
Minimum Maximum Number of eect 4 6 Backward-forward
Evaporator central
Tsteam,in(C) 90 400
_msteam,in (kg/s) 3 4.5
AFR 1 1.6
Recovery boiler Tuegas(C) 250 1200
Tair,in(C) 25 200
Figure 6. Exergetic eciency of components at initial decision variable values.
exergetic and exergoeconomic improvement potential are related to the combustion nature.
After dening component priorities, based on exergetic and exergoeconomic improvement potentials, the relative deviations of the actual values from the cost optimal values for the exergetic eciency and relative cost dierences are calculated [13]. The design is modi-ed to rmodi-educe the values of "k and rk. If conicting
design changes are suggested from the evaluation of dierent components, the design changes with higher exergoeconomic improvement potential values prevail.
Subsequent gures show the inuence of some decision variables on dierent components, "k and
rk. For better perception, absolute values of "k are
used in theses gures. It should be noted that some variables have a great inuence on some components like "k and/or rk, but little or even no inuence on
other components. Figure 7 shows an impression of the recovery boiler's ue gas temperature on the recovery boiler, DCCE and conversion tower, "k.
Since a pressure valve performance is not depen-dent upon decision variables under consideration, it is not included in these gures.
Since DCCE's delta exergetic eciency is notice-ably higher than other components, its replacement is
Figure 7. Recovery boiler's ue gas temperature inuence on recovery boiler, DCCE and conversion tower, "k.
suggested. Besides, an evaporator has the highest exer-getic eciency and the lowest improvement potential. Therefore, the selection of decision variable values is based on the recovery boiler and conversion tower, "k
and rk.
As seen in Figures 7 to 13, the recovery boiler and conversion tower optimum decision variable values are close, leading to an easier selection of decision variables. Figures 12 and 13 show the relative cost dierence versus decision variables in some components. The decision variables, inuence on DCCE and the recovery boiler's "k is also shown in Figures 7 to 11.
It is deduced from Figure 7 that probably the best ue gas temperature is at the point where the recovery boiler curve cuts the conversion tower curve. Based on professional research [31], the best ue gas outlet temperature for recovery boilers in pulp and paper mills is about the same. It should be noted that delta exergetic eciency and the delta relative
Figure 8. Recovery boiler's fraction of stoichiometric air in the lower inuence on recovery boiler, DCCE and conversion tower, "k.
Figure 9. Evaporator's inlet steam mass ow rate inuence on recovery boiler, DCCE and conversion tower, "k.
Figure 10. Evaporator's inlet steam temperature inuence on recovery boiler, DCCE and conversion tower, "k.
Figure 11. Recovery boiler's inlet air temperature inuence on recovery boiler, DCCE and conversion tower, "k.
cost dierence minimum point is not necessarily the optimum point. However, Figure 8 shows very small change in the recovery boiler, DCCE and conversion tower delta exergetic eciency. The proposed value for recovery boilers' LFA is about 1.2 to 1.4 [31]. This gure indicates that optimization iteration is in very good agreement with professional research.
Figure 9 shows that the best value is proportional to the black liquor mass ow rate. The results in Figure 10 are very acceptable, since the best evaporator inlet temperature is 20 to 30 degrees above the inlet stream, 90-100C.
A slight change in the recovery boiler, DCCE and conversion tower delta exergetic eciency versus the recovery boiler inlet air temperature is shown in Figure 11. However, from a graphical optimization method (which it is not discussed in this paper) it can be deduced that the best value for the inlet temperature is about 200C.
Figure 12. Recovery boiler's ue gas temperature inuence on DCCE's delta relative cost dierence and recovery boiler's inlet air temperature inuence on recovery boiler's delta relative cost dierence.
Figure 13. Inuence of evaporator's inlet steam mass ow rate on recovery boiler delta relative cost dierence.
This contradiction is due to the heat exchanger network and the impression of the inlet stream cost on the objective function. This result coincides with the consequences in Figure 12.
After choosing the best value in each iteration, the objective function is calculated. If, in comparison with the previous iteration, this value has been improved, it will proceed to the next iteration, otherwise changes should be revised and the iteration repeated. As explained before, the objective value is the value of Cfuel for the recovery link for which the black liquor
cost has to be maximized.
In the next step, Pinch technology is applied to the heat transfer network, and the design is optimum when the annual levelized costs associated with the network are minimum and the recovery link objective values are maximum. With 3 to 4 iterations, the design optimum is achieved.
Figure 14 shows the objective value in some iterations.
Figure 14. Variation of objective values with number of iterations.
CONCULUSION
The present study shows that the existing design con-sumes 23% more energy than the gross root design. By retrotting the existing design, about 15% reduction in the energy consumption is possible. However, opti-mization of the heat exchanger network and recovery link together will lead only to 12% reduction in energy consumption. From components, exergetic eciency, exergetic improvement potential and exergoeconomic improvement potential gures, it is concluded that DCCE and the pressure valve should be replaced by more ecient components. The best values for other decision variables are as indicated in Table 3. These values are achieved after 14 iterations. By applying these values, the mass ow rate of recoverable black liquor increases by almost 7%.
ACKNOWLEDGMENT
The authors would like to gratefully acknowledge the support of the MWPI (Mazandaran Wood and Paper Industry) engineering team for their valuable collabo-ration during the development of this research work.
Table 3. Optimized decision variables.
Component Input Variable Value Number of eect 5 Backward-forward Central Evaporator central
Tsteam,in (C) 97
_msteam,in (kg/s) 4.15
AFR 1.2 Recovery boiler Tuegas(C) 459
Tair,in(C) 112
Twater,in(C) 73
NOMENCLATURE
B constant
c exergy specic cost (US $/kW) C cost of a stream (US $)
cp heat capacity (kJ/kgK)
D exergy destruction (kW)
e specic exergy (kW/kg)
E exergy (kW)
EF L euent exergy losses (kW) Irr irreversible exergy losses (kW)
m constant
_m mass ow rate (kg/s)
n constant
Pot exergy improvement potential (kW) Potec exergoeconomic improvement potential
($/s)
Qmin minimum hot and cold utility
requirement (kW) r relative cost dierence
R remaining operating and maintenance costs ($)
T temperature (K) or (C)
TCI total capital cost ($) Z equipment cost (US $/s) Greek Symbols
coecient
! constant
average annual operating time of plant (s)
" exergetic eciency Subscripts
1 pinch analysis without stream from recovery link
2 pinch analysis with stream from recovery link
D recovery driving, destructed
E recovered export
efl euent exergy losses
F fuel
i exergy form
irr irreversible exergy losses
j unit number
J rejected
k component and number of iterations
ntp net produced
nts net supplied
O recoverable
P product
R recycled
tte total input
U unit
Superscripts
CI capital investment
OM operating and maintenance
OPT optimum
REFERENCES
1. Smith, R. \Chemical process design and integration", John Wiley & Sons, Chichester, UK (2005).
2. CIT International Energy Analyses Report \Process integration in the pulp and paper Industry", Chalmers University, Sweden (March 2004).
3. Noel, G. \Project design in energy eciency using pinch analysis", Pulp and Paper Canada, 99(12), pp 103-105 (1998).
4. Noel, G. \Pinch technology study at the Donohue Clermont newsprint mill", Pulp and Paper Canada, 97(7), pp. 254-258 (1995).
5. Lombardo, G., Guillet, F., Muratore, E. and Vi-inikainen, S. \Exergy and pinch analyses of kraft pulp mill", Computer and Chemical Engineering, 27, pp. 1268-1277 ( 1999).
6. Bengtsson, C., Karlsson, M., Berntsson, T. and Soder-storm, M. \Co-ordination of pinch technology and the MIND method applied to Swedish board mill", Applied Thermal Engineering, 22, pp. 133-144 (2002). 7. Bengtsson, C., Nordman, R. and Berntsson, T.
\Uti-lization of excess heat in the pulp and paper industry-a cindustry-ase study of technicindustry-al industry-and economic opportuni-ties", Applied Thermal Engineering, 22, pp. 1069-1081 (2002).
8. Algehed, J., Stromberg, J. and Berntsson, T. \Energy-ecient pre-evaporation of bleach plant ltrates", TAPPI Journal, 83(9), pp. 841-849 (2002).
9. Algehed, J., Wising, U. and Berntsson, T. \Energy-ecient evaporation in future pulp and paper mills", Proc of 7th Conference in New Available Technologies, Stockholm (2002).
10. Berglin, N. and Berntsson, T. \CHP in the pulp and paper industry using black liquor gasication: Ther-modynamic analysis", Applied Thermal Engineering, 18, pp. 947-961 (1998).
11. Brown, D., Marwchal, F. and Paris, J. \A dual representation for targeting process retrot application to a pulp and paper process", Applied Thermal Engi-neering, 25, pp. 1067-1082 (2005).
12. Tsatsaronis, G. and Winhold, M. \Exergoeconomic analysis and evaluation of energy-conversion plants", Energy, 10, pp. 69-80 (1985).
13. Bejan, A., Tsatsaronis, G. and Moran, M., Thermal Design and Optimization, John Wiley & Sons, Inc., USA (1996).
14. Tsatsaronis, G. \Exergoeconomic: Is it only a new name?", Chemical Engineering Technology, 19, pp. 163-169 (1996).
15. Paulus, D.M. and Tsatsaronis, G. \Auxiliary equations for the determination of specic exergy revenues", Energy, 31, pp. 3235-3247 ( 2006).
16. Cziesla, F., Tsatsaronis, G. and Gao, Z. \Avoidable thermodynamic ineciencies and costs in an externally red combined cycle power plant", Energy, 31, pp. 1472-1489 (2006).
17. Tsatsaronis, G. and Park, M.H. \On avoidable and unavoidable exergy destructions and investment costs in thermal systems", Energy Conversion and Manage-ment, 43, pp. 1259-1270 ( 2002).
18. Tsatsaronis, G. \Denition and nomenclature in ex-ergy analysis and exergoeconomics", Enex-ergy, 32, pp. 249-253 ( 2007).
19. Lazano, M.A. and Valero, A. \Theory of exergetic cost", Energy, 43, pp. 939-960 (1993).
20. Valero, A., Lazano, M.A., Serra, L. and Torres, C. \Application of exergetic cost theory to CGAM problem", Energy, 43, pp. 365-381 (1994).
21. Valero, A., Serra, L. and Uch, J. \Fundamentals of exergy cost accounting and thermoeconomics. Part I. Theory", Transactions of the ASME, Journal of En-ergy Resource Technology, 128, pp. 1-8 (2006). 22. Valero, A., Serra, L. and Uche, J. \Fundamentals of
exergy cost accounting and thermoeconomics. Part II. Applications", Transactions of the ASME, Journal of Energy Resource Technology, 128, pp. 9-15 (2006). 23. Frangopoulos, C.A. \Application of the
thermoeco-nomic functional approach to the CGAM problem", Energy, 19, pp. 323-342 (1994).
24. Spakovsky, M.R. \Application of engineering func-tional analysis and optimization of the CGAM prob-lem", Energy, 19, pp. 343-364 (1994).
25. Zhang, G., Hua, B. and Chen, Q. \Exergoeconomic methodology for analysis and optimization of process systems", Computer and Chemical Engineering, 24, pp. 613-618 (2000).
26. Rivero, R., Rendon, C. and Gallegos, S. \Exergy and exergoeconomic analysis of a crude oil combined distillation unit", Energy, 29, pp. 1909-1927 (2004). 27. Fiorini, P. and Sciubba, E. \Modular simulation and
thermoeconomic analysis of multi-eect distillation desalination plant", Energy, 32, pp. 459-466 (2007). 28. Jianbo, L. \Energy balance and economic benets
of two agro-forestry systems in Northern and South-ern China", Agriculture Ecosystems and Environment, 116, pp. 255-262 (2006).
29. Perry, R.H. and Green, D.W. Perry's Chemical Engi-neer's Hand Book, MacGraw-Hill, USA (1997). 30. Vieira, L.S., Donatelli, J.L. and Cruz, M.E.
\Integra-tion of an iterative methodology for exergoeconomic improvement of thermal systems with process
simu-lator", Energy Conversion and Management, 45, pp. 2495-2523 (2004).
31. Adams, T.N., Frederick, W.J. and Grace, T.M., Kraft Recovery Boilers, TAPPI Press, USA (1997).