Sharif University of Technology
Scientia IranicaTransactions A: Civil Engineering www.scientiairanica.com
Proposition of a new method for quick assessment of
maximum beam ductility in steel moment frame under
higher mode eects
M. Gerami and N. Siahpolo
Department of Earthquake Engineering, Semnan University, Semnan, Iran.
Received 19 August 2014; received in revised form 9 June 2015; accepted 6 September 2015
KEYWORDS Rotation ductility; Higher mode eects; Target ductility; Increasing load analysis;
Nonlinear time history analysis.
Abstract. A simple equation to estimate maximum beam ductility (b) of regular steel
structures under ordinary (i.e. without near fault eect) earthquakes is proposed. This equation is a function of period, number of span, and global ductility. The proposed procedure enables the rapid assessment of beam plastic rotation of existing buildings and direct deformation-controlled seismic design of new ones. To prepare rational databank, a considerable number of steel MRFs with dierent geometric congurations were analyzed using nonlinear static and dynamic procedures (NSP and NDP). The NSP is used to evaluate the plastic hinge sequencing, force, and deformation demands over the height of frames. However, the NDP is applied to prepare databank of demands. The proposed relation is based on nonlinear regression of the results of thousands of NDPs. The result of the study shows that b is signicantly higher than interstory and global
ductility. Furthermore, the higher modes eect is completely sensible on increase of rotation ductility in upper stories of high-rise buildings. Finally, the ability of calculating b with
acceptable precision is the advantage of the proposed relation. The result of the proposed relation, then, could be compared with acceptance criteria of FEMA356 and, therefore, the performance level would be indicated.
© 2016 Sharif University of Technology. All rights reserved.
1. Introduction
In seismic resistant design procedure, applied defor-mation demands to the ductile members are men-tioned as the controlling parameter. Regarding the approximations in the seismic demand predictions, the main goal of new seismic codes for design purposes is proper distribution of strength and stiness between the structural elements in such a way that the inelastic behavior is limited to predetermined regions (plastic zones or protected zones). This attitude insures the
*. Corresponding author. Tel.: +98 61 236 33345372; Fax: +98 61 236 33345826;
E-mail addresses: [email protected] (M. Gerami); [email protected] (N. Siahpolo);
hysteric energy dissipation during seismic events and prevents the brittle and undesired failures. In this regard, the need to have comprehensive information about the inelastic dynamic response of structure under earthquake is clearly sensible. This information should be so complete to make it possible to ensure fullling of the predetermined seismic design provisions and should be so simple to be applicable by professional engineers. The results obtained from inelastic assessment of struc-tures against seismic events could be applied in both economic loss and life-safety hazard evaluations. These two denitions are key elements in modern seismic codes.
It is clear that one of the energy absorption sources in building structures under severe earthquake is the inelastic deformation. Previous investigations
demonstrate that the energy dissipated by nonlinear deformations is several times greater than elastic condi-tion, which is called ductility. In a simple classicacondi-tion, the ductility of Steel Moment Resisting Frames, SM-RFs, has denitions, including global (roof) ductility, interstory ductility (intermediate ductility), element ductility, and section ductility. What is usually referred to in most seismic codes is global and interstory ductil-ity. In Multi-Degree Of Freedom Systems (MDOFSs), the global ductility capacity of the structure can be calculated by means of the global capacity curve or Equivalent Single-Degree Of Freedom Systems, ESD-OFSs [1]. Ductility demands are restricted to specic values in many modern performance-based design reg-ulations in order to prevent collapse. Several studies show that the global ductility has a direct relationship with element ductility, in which for a given global ductility demand, the peak inelastic element ductility could be determined via practical formulation [2,3]. Although several studies exist which attempt to make a correlation between global and interstory demands, lack of studies that directly establish a relationship between global and local (element) ductility demands is the fundamental motivation of this paper. It is important to notice that most of the articles have mainly focused on SDOF systems. For instant, two methods are available for calculating the peak response of SDOF systems. The rst one is so-called equal-displacement rule (maximum inelastic equal-displacement is almost equal to peak elastic displacement). Studies show that this rule is applicable for the structures with a period larger than the characteristic period [4,5]. The second approach is based on the concept of equivalent linearization [6,7]. The main dierence of the present article and previous papers is that for the rst time an explicit equation is proposed as a function of struc-tural features and level of inelasticity for calculating maximum beam ductility. For this purpose, the main aim of this study is to increase awareness of inelastic dynamic response of SMRF and to introduce methods for measuring maximum local seismic demands of these structures using the maximum information about global and interstory demands (estimated through prescribed target ductility). In addition to reviewing SMRFs seismic demands, the local behavior speci-cations and element ductility (especially beam local ductility) demands are investigated.
The elementary focus of this study is on the para-metric assessment of inelastic behavior and demands of regular ductile SMRF structures without stiness degradation and strength loss subjected to ordinary ground motions. Hence, a family of 36 regular steel MRFs is subjected to an ensemble of 10 ordinary motions scaled to dierent intensities to accommo-date dierent global ductility levels. In addition to investigation of member plastic deformation demands,
making relation between maximum roof ductility and beams rotation ductility demands is the other ob-jective of this study. In this regard, the inelastic deformation demands of columns and beams have been investigated and analyzed by means of Nonlinear Static Procedure (NSP) and Nonlinear Dynamic Procedure (NDP). Then, a discrete beam plastic rotation formula has been proposed as a function of global MDOF or equivalent SDOF target ductility, period, and number of spans. This formula provides quick assessment of beam plastic rotation for the performance-based design purpose without utilizing any complex NDP. A nonlinear regression has been used to extract practical formula. The main features of the proposed method are: (1) It treats ductility as an input variable; (2) For the purpose of MDOFs evaluation, in fact, it uses an ESDOFSs (this system is used just to prepare 5%-damped elastic displacement response spectrum); and (3) It recognizes the inuence of geometrical values of SMRFs. Thus, to achieve the aforementioned goals, this study attempts to quantify higher mode eects on maximum local ductility demands of the studied MDOF frames. For this purpose, an ESDOFSs system was dened for each of the original MDOFs frames and the practical equation for predicting the maxi-mum beam rotation ductility (b) was quantied.
This modication is used to correlate the ductility of ESDOFSs with MDOFs. To account for the level of inelasticity, for each frame and under each earthquake, the global target ductilities () of values of 3.0, 5.0, and 7.0 have been considered. To provide statistical databank, 1260 nonlinear time history analysis was implemented.
2. A literature review
Many practice codes adopt procedures for estimating displacement demands of building structures which use equivalent SDOF systems (FEMA273 1997, FEMA 356 2000, ATC40 1996, and FEMA440 2004). The method-ologies are resulted from several studies on investi-gating the dierences between the MDOFs responses and the equivalent SDOFs. After the Northridge earthquake (1994), several studies were conducted to prepare better understanding of the nonlinearity eects on structures and making a simple method to introduce these eects of the analysis and design pro-cedures [1,8,9]. Veletsos and Vann (1971) studied the relation between the responses of SDOFs and MDOFs for the rst time [10]. In Nassar and co-workers' study (1992), nonlinear static analysis was conrmed as a capable tool for estimating the relation between local and global ductility demands of the structure. Moreover, they concluded that for considering higher modes participation and due to the focus of energy loss on some sensitive elements of the structure, it
is required to revise the method of obtaining SDOFs strength [11]. Seneviratna (1995) showed that except for the structures with very short periods, the max-imum interstory ductility of MDOFs frame is more than that of the rst mode equivalent SDOFs [12]. Humar and Rahgozar's study showed that for high ductility levels, the displacement ductility demand in most stories of MDOFs might has a signicant increase in comparison with ductility of the equivalent SDOFs system. They also concluded that the lowest story in most structures is critical story. However, the higher stories can show higher ductility levels due to interference of higher modes [13]. Gulkan and Akkar (2002) dened a relation for calculation of drift spectrum. They showed that the regulations governing response spectrum and fundamental mode of structure could be combined to calculate the story drift with error of %10 for shear frames with a period less than 2 sec under the near eld earthquakes [14]. In Gupta and Krawinkler (2000), in addition to the investigation of system inelastic demands through nonlinear static analysis and nonlinear time history analysis (NDP), the relation between interstory drift and interstory plastic drift demand was challenged. Furthermore, the relation between global, interstory, and local (at the level of an element) demands was introduced [2,3]. In the last decades, the maximum displacement prole, which expresses the physical relation between the maximum interstory drift ratio and maximum oor displacement, has been an interesting subject of sev-eral studies. The majority of previous studies have focused on the establishment of a correlation between these demands, especially in the elastic range [15-17]. Only a few of them have focused on its inelastic phase [18-22]. The statistical relationship between the curvature ductility demands of columns and the global displacement ductility demands of Reinforced Concrete (RC) frame structures, when subjected to earthquakes, was examined by Zhou et al. They proposed rst-degree linear relationship between curvature ductility of columns and structural displacement ductility in RC frame structures [23]. Thus, the detailed review of technical literature in the recent years indicated that the focus of most studies has been on the global and interstory demands. Furthermore, the approximation of element ductility demand by global and interstory ductilities has less been considered. Moreover, for associating elastic behavior of SDOFs with the inelastic ductility demand of MDOFs under higher mode eects, the geometric properties of structures (such as span number, story number, and period) and their inelastic behavior properties (such as target ductility) have less been considered. These are all issues inspiring the present study. The advantage of the proposed equation for predicting beam ductility demand is that the results could be used in quick performance assessment
of available building on the basis of FEMA356 and ASCE/SEI 41-13 [24,25].
3. Structural modeling 3.1. Model design procedure
The structures used in this study are regular two-dimensional steel frames with moment-resisting sys-tems that are investigated in 1, 2, 4, 7, 10, 15, 20, 25, and 30 stories and 1, 2, 3, and 5 spans (36 frames). Although it was found from previous studies that the number of spans has a negligible eect on the seismic response of the frames, in this study, this eect is considered in obtaining the formulae. The interstory height and span length of the frames are equal to 4 m and 5 m, respectively. It should be noticed that a bay width of 4 to 6 m is the prevalent case of practice in Iran, but quite low compared with American practice. In the calculation of story masses (which are assumed constant and concentrated in master joints of the oors), dead load plus 20% of live load has been used. Gravity loads on the beams of frames of this study are assumed equal to 50 kN/m. The yield strength of material is set equal to 235 MPa. The frames were loaded according to Iranian loading structure code no. 6 and Iranian code of practice for seismic resistant design of buildings (Standard No. 2800-05) and designed by AISC-LRFD05 specica-tions [26-28]. The rule of \strong column-weak beam" has been considered in the design of frames. Only the bare steel frame was included in the analysis, i.e. the interaction between the slab and composite beams was not included. Concentrated plastic hinges that could form at both ends of the frame members were modeled the inelastic response. These plastic hinges were assigned a bi-linear hysteretic behavior with the strain-hardening ratio of 0.03 (see Figure 1). For the column, the axial-exural interaction behavior was assigned to plastic hinges. The panel zone of the beam-column connections was assumed to be sti and strong enough to avoid any shear deformation, distortion, or yielding under strong earthquakes. The columns were xed at the ground level. The P - eects (geometric
Figure 1. Force-deformation curves used for plastic hinges modelling based on FEMA356 [24].
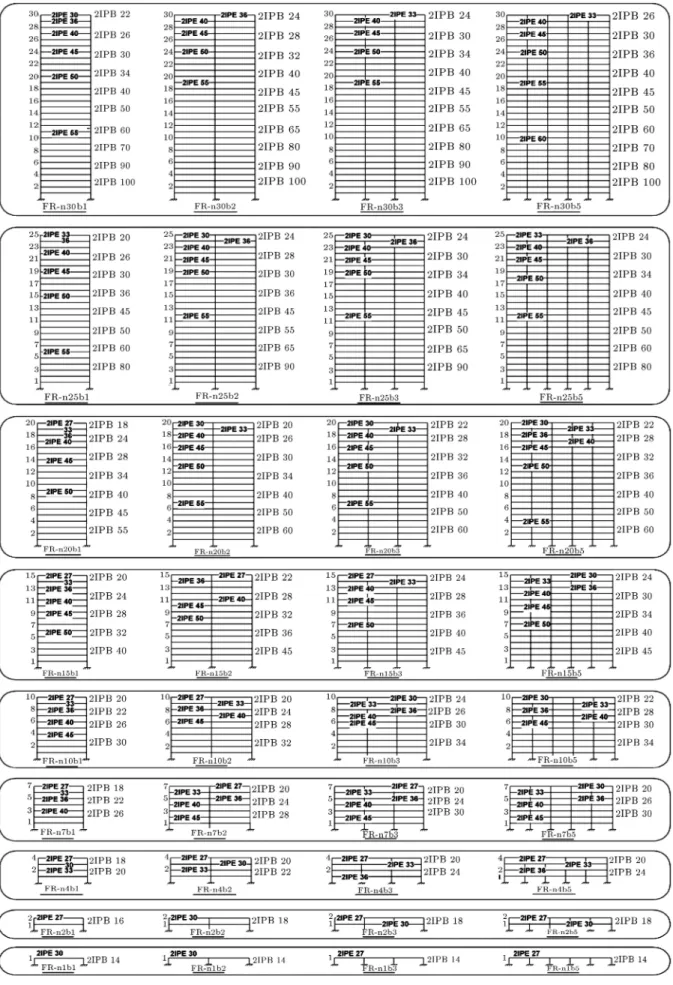
nonlinearity due to lateral load and deformation) were accounted for in the analysis. To design all frames, soil condition type (according to Standard No. 2800 Iran) was selected which is almost same as the soil type D of FEMA356. Furthermore, site hazard level was assumed as a very high-risk category on the basis of Standard No. 2800 Iran denition (spectrum design base acceleration is 0.35 g). The conguration of the frames together with their design results is shown in Figure 2.
3.2. Nonlinear Static Procedures (NSP)
After all frames were designed according to the results of the Linear Static Procedure (LSP), the aforemen-tioned hinges were assigned to all yielding-expected members. In order to follow the NSP after the LSP, a gravity analysis is necessary at the beginning of the NSP. Hence, all frames were loaded by dead load plus 20% of live load. The lateral load pattern according to FEMA356 was then applied to each model. The following equation illustrates the aforementioned load pattern:
Cvx= wxh k x
Pn
i=1wihki: (1)
In Eq. (2), k is 2 for T 2:5 sec and k is 1.0 for T 0:5 sec. For intermediated value, linear interpola-tion shall be used to calculate k. Other parameters of Eq. (2) have been dened in section 3.3.1.3.2 of FEMA356. Conventionally, NSP is implemented to calculate ductility capacity ratios, overstrength, and design methodology reduction factors. Nevertheless, in this study, the NSP is used to calculate global yielding point of each MDOF model and to evaluate the eect of higher modes and MDOF on hinge sequencing and inelastic demands (force and deformation). It should be noticed that after calculating capacity curve for each structure, this curve is idealized with two crisscross lines. To produce an idealized bilinear curve, the area
under real and idealized curves shall be the same. Also, both curves must intersect with each other at 60% of global yield of structure (0.6 Vy). To perform
this idealization, a simple code has been developed by authors in Matlab software. It is clear that the developing idealized curve needs an iteration.
3.3. Ground motions used in this study and nonlinear time history (NDP)
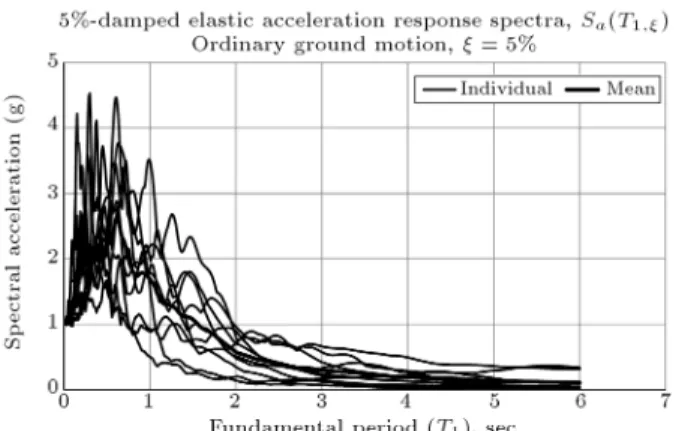
For the nonlinear time history analysis of this study, a set of 10 ordinary (far-fault) ground mo-tions, selected from PEER-NGAwest2 (http://nga-west2.berkeley.edu) program, were employed. It should be mentioned that the term ordinary excludes earth-quakes which have distinct long pulse period in their ground velocity time history. In other words, the eects of forward directivity are not a subject of this study. However, it should be noticed that a parallel study is ongoing to extend this methodology to pulse-like ground motions. The important features of the selected ground shakings such as peak ground acceleration, PGA, closest distance to causative fault, the moment magnitude, station IDs, and the predominant period are presented in Table 1. Furthermore, the 5%-damped pseudo-acceleration response spectra is depicted in Figure 3. In this gure, a thick line is a median spectrum. It should be mentioned that although there are several similar studies which have used more sets of ground motions, the authors believe that using 10 sets of earthquakes is enough; because in this study, the numbers of frame cases and ductility ratios cover this deciency.
In addition, a preliminary analysis shows that for the ordinary ground motions, suing this number of earthquakes leads to accurate and reasonable results. For the rst mode and all modes with cumulative mass participation factors exceeding 90%, Rayleigh equivalent damping was dened 5%. To perform NDP, time steps and sub-steps have been considered
Table 1. Earthquake characteristics. Record
no.
Earthquake
name Year
Station
name PGA (g) Mw R (km) TP (sec)
1 San Fernando 1971 Castaic 0.32 6.60 24.90 0.35
2 Imperial Valley 1992 El Centro Array #6 0.32 6.95 44.60 0.56
3 Loma Pieta 1989 Aloha Ave 0.51 6.90 13.00 1.10
4 Landers 1992 Joshua 0.28 7.30 11.60 0.70
5 Northridge 1994 Inglewood Union Oil 0.10 6.70 44.70 0.45
6 Kobe 1995 HIK 0.14 6.10 95.72 0.60
7 Manjil 1990 Qazvin 0.13 7.37 49.97 0.16
8 Northridge 1994 CDMG13122 0.10 6.70 72.32 0.38
9 Tabas 1978 Ferdows 0.10 7.35 91.14 0.24
Figure 3. 5%-damped elastic acceleration response spectra.
0.005s and 1000, respectively. In all analyses, P-Delta eect has been included in the NDP. All elements have been designed with high ductility, and therefore, force-deformation curve for ductile elements has been used to model plastic hinges in beams and columns. Nonlinear dynamic response of structures has been calculated by Drain2DX software [29]. To process selected records and drawing of elastic and inelastic response spectrums and other strong ground motion parameters, Seismosignal software was used [30]. 4. Equivalent SDOF systems of MDOF frames In this study, the quantication of seismic demands for an MDOF system is conducted through a com-parative evaluation of inelastic dynamic response of MDOF frames and their equivalent SDOF systems and presenting modication factors to the response of SDOF systems. Thus, for each of the MDOF frames, an equivalent SDOF system was dened. The properties of these equivalent SDOF systems were set such that the weight of the SDOF system was the same as the total weight of the original MDOF frame and the period of vibration and damping ratio of SDOF system was the same as the fundamental mode properties of the MDOF frame. The main reason of the dierence between the response of an inelastic MDOF frame and its equivalent SDOF system is the contribution of higher modes to the response of MDOF system. However, other structural characteristics such as the global mode of deformation, distribution of strength and stiness over the height of the structure, structural system redundancy, mode of failure at both element and global levels, and nally the torsional eects can also cause the dierence of responses between MDOF systems and their equivalent SDOF ones.
5. Methodology
According to what have been mentioned in section 4, in this paper, for each MDOFs, an equivalent
SDOFs is introduced. This system is used for two purposes. The rst one is to produce 5%-damped elastic displacement response spectrum. Secondly, the inelastic response of this system is required to set the demands ductility of ESDOFSs with a predened target ductility ratio. This issue is needed because the abonnement of both MDOFs and their corresponding SDOFs are the equal target ductility ratios. Previ-ous studies demonstrate that the inelastic dynamic responses are directly related to earthquake intensity and the selection of earthquake records. Therefore, a suitable approach is needed for both selecting and scaling. Most of the recent seismic codes, such as Standard No. 2800-05, suggest that at least three sets of ground shakings should be selected for inelastic dynamic analysis (each set consists of two orthogonal records for the same event). Thus, the response of the model is the maximum response resulted from each set of earthquake. In addition, it is possible to select 7 sets of earthquakes in which the geometric mean could be used as the nal inelastic response. This methodology is in line with other seismic codes such as FEMA356 and ASCE07-05. Moreover, there are some methods to scale earthquake by seismic codes to design new structures or to assess existing structures. For instance, regarding Standard No. 2800-05, the SRSS response spectra of records should be 1.4 times greater than uniform hazard design spectrum in a specic period range (always 0.2T to 1.5T). In another method, matching the demand spectrum response versus design spectrum is used. In this study, the new scaling method has been proposed. In this method, adjusting MD-OFs roof ductility with the predened target ductility through test and trial on the earthquake scale factor was used. In other words, the iteration in MDOF systems was conducted on earthquake scale factor. The iterative procedure continues until the global displacement ductility ratios in MDOF systems are within 1% tolerance error, equal to the target ductility. By using this scaling method, dependence of the result to the ground motion content disappears. Hence, the comparison between local and global ductilities will develop the possibility of proposing a practical formula for estimation of maximum elastic and inelastic roof displacement, maximum interstory drift ratio, and peak interstory ductility. The eects of period (T ), number of spans (b) (frames with dierent spans), and target ductility () have directly been considered in evaluations.
After all, In order to set the SDOF ductility demands, an iterative procedure was conducted on lateral yield strength (Fy) of ESDOFSs. In this
methodology, for each SDOFs, an initial value of yield strength is selected. Then, according to elastic stiness and initial Fy, the yield displacement, y, is calculated.
for each of the ESDOFSs and the maximum demand displacement, max, is recorded. It should be
men-tioned that in this case, the scaled records resulted from the MDOFs iteration procedure are implemented for ESDOFSs analysis. Therefore, the demand ductility ratio is dened as a ratio of maxto y. If this value is
close to the preselected target ductility, the procedure is stopped; else, the initial guess of Fy changes until
the convergence criteria are established. This method is named as a constant ductility approach. The basic dierence between the methods of this study and the previous studies is in the application of ductility. In this study, the global (roof) ductility is used as a level of inelastic behavior while previous studies used the interstory ductility ratios.
6. Verication
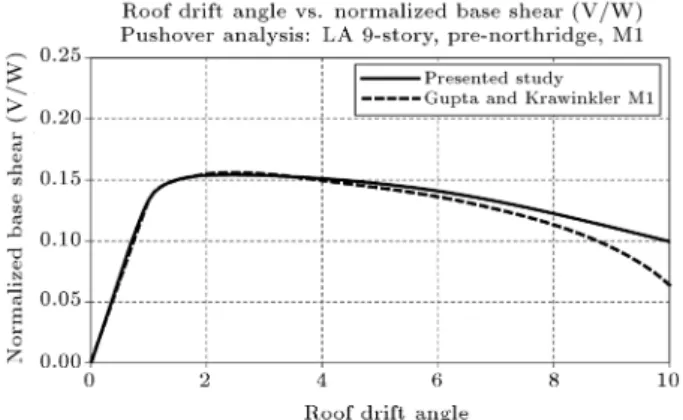
Modeling verication is an important step in each study. This issue becomes critical if the research is a numerical study and it needs a signicant database. Obviously, if the modeling assumptions and assembling have some certain errors, the results would be inac-curate. In order to prevent this issue, in this study, all models have been produced on the basis of the 9-storey structure shown in Figure 4. This building was
designed by Brandow and Johnson Associates for the SAC Phase II Project. This building is 45.73 m by 45.73 m in plan, and 37.19 m in height with 3.96 typical oor-to-oor heights. Five spans in each direction with 9.15 m of length was selected. Steel perimeter Moment Resisting Frames (SMRF) are applied as the lateral force-resisting system. The interior spans contain simple connections and the exterior bay has moment-resisting connections. The steel wide-ange sections were used as columns with 345 MPa yield strength. On rst, third, fth, and seventh levels at 1.83 m, column splices are located. These splices have seismic capability to carry bending and uplift forces. The pinned connections were used as column bases. To restrain the structure from horizontal displacement, the concrete frame walls were placed at ground level. The oor system is made of steel wide-ange beams in acting composite interaction with the concrete slab. The ground-level seismic mass is 965 tons. The rst, second through eighth and ninth level masses are 1010, 989, and 1070 tons, respectively. Therefore, the mass of the entire structure is 9000 tons. While the SAC9 structure is regular in plan, so in this paper, only the two-dimensional model consists of the perimeter N S SMRF. Half of the seismic mass is therefore assigned to the frame. To model, the M1 model developed by
Figure 5. Verication of the models of the presented study with SAC9 steel moment-resisting frame [8].
Gupta and Krawinkler was used [8]. The eect of P - is included. Nevertheless, other eects, such as panel zone eects, are neglected. The M1 model is based on the bare frame in which beams and columns extend from centerline to centerline. The reason for the selection of simple M1 models is that this study focuses on producing rational database to carry out the dierent demand evaluation studies. The dependence of resulted database to several modeling assumptions must be reduced. In addition, it should be easy enough to use the results in prevalent practical design proce-dures. The pushover curve resulted from Gupta study and 2D-model adopted by Drain2DX in this study are presented in Figure 5. The comparison between two depicted graphs shows a sucient accuracy in modeling phase of this study.
7. Result and discussion
7.1. The formation sequence of plastic hinge resulted from NSP
The prevalent aim of seismic design of SMRFs struc-tures is to determine the relative strength of elements in such a way that the plastic hinges are mainly formed in beams with sucient distance from the connection point (protected zone), and to possibly avoid plastic formation in columns. Experiences have shown that in most cases, there would be no insurance for the whole energy of a severe earthquake to be dissipated through making plastic hinges in beams. On the other hand, in most designed structures, it is observed that the panel zone has been yielded in shear before the beams reach their yield strength. For familiarization of the plastic hinges sequences of frames, in this part of the study, the results of NSP analysis are evaluated. All models have been pushed until they reach the mechanism (this value equals the overall drift angle of 10%). Figure 6 presents the order and sequence of plastic hinge formation in beams and columns for 2-, 7-, 15-, and 25-story frames with 3 spans. The results show that controlling \strong column-weak beam" rule does not prevent plastic hinge
formation at the columns. By increase in the number of stories, the hinge formation has penetrated into the in-terior beams of the stories; this issue conrms that force demands of frame elements are inuenced by the height of the structure. Furthermore, increasing the number of stories leads to accumulation of plastic hinges in the interior columns of the structure and reduction of imposing forces to the exterior ones. Moreover, the accumulation of plastic hinge will be directed to the higher stories that is indicative of the higher mode eects on the inelastic demands of higher stories in high-rise structures. This is in agreement with Gerami and Abdollahzadeh (2014) based on reference [31]. 7.2. Maximum inelastic local rotation
demands resulted from NSP
The ductility demand in the elements is dened by rotation in elastic and plastic levels. However, the line between these two rotations is dened as yield rotation. In simple words, plastic rotation of a section of elements, p, is dened as follows:
p= u y; (2)
where, u is the ultimate rotation demand, which is
calculated by NSP or NDP, and y is yield rotation.
Based on FEMA356 specications for steel structures, if the inection point of structural deformation is assumed at the middle of the height of elements, the proposed equation for calculation of yield rotation will be:
y= M 2 yL
3 (My+ M2) EI: (3)
In the above equation, y is yield rotation; M2 is the
maximum moment of the other end of the member (M2 < My); L is the length of the element; E is
the module of elasticity; I is moment of inertia about major axis; and My is the yield moment which is
the plastic module (Z) multiplied by steel yield stress (Fy). In FEMA356, it is assumed that M2 equals My.
This assumption is reasonable and true for beams in moment resisting frame. However, it should be noted that Eq. (3) yields non-conservative values for ductility demand while using NDP. The above equations to calculate maximum yield rotation capacity of beam and columns are:
yb= M6EIyLb
b ; (4)
yc= M6EIyLc c 1 P Pyc ; (5)
where the indices b and c refer to beam and column, respectively. In addition, Pyc is the yield axial force
capacity.
Figure 6. The sequence of plastic hinges resulted from NSP for 2-, 7-, 15-, and 25-story frames with 3 spans.
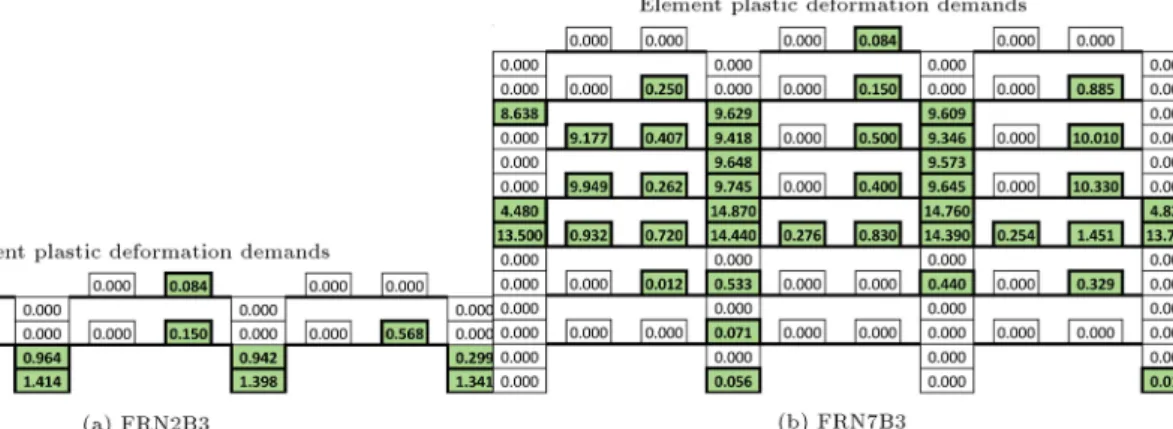
responses occur in models with dierent numbers of spans and stories at the element level; where demand distribution between beams and columns can have great changes in comparison with another depending on the relative strength of the elements at conjunc-tion node. The values (obtained maximum values in analysis) related to plastic deformation demands of
the elements have been obtained from NSP in global drift of 4% for frames and the results are represented in Figure 7, separately. Numbers with a bold box around are representatives of maximum plastic rotation of beam and column (all values are multiplied by 100). The results obtained from investigating peak plas-tic rotation at all elements indicate that the increase
Figure 7. Maximum plastic rotation demand resulted from NSP for 2-, 7-, 15-, and 25-story frames and 3 spans (4% global drift and all values multiplied by 100).
in the number of stories leads plastic rotation demand of elements to be accumulated in the upper stories because of higher mode participation. This result is valid for ordinary ground motions [31]. On the opposite, parallel study shows that for near eld ground motions, the accumulation of inelastic demands is al-most located in the lower stories, especially for high-rise models under forward directivity eects. Furthermore, increasing the number of stories and spans, the plastic rotation of the interior columns signicantly increases. On the one hand, in low-rise structures (up to 4 stories), the plastic rotation is mostly concentrated on lower stories and the assessed demands of exterior beams are more than middles. In other words, in the low-rise models, the fundamental mode is the predominant mode shape of lateral deformation. The other point is that increasing the number of spans leads to increase in the participation of the side beams during inelastic phase. In other words, the number of spans leads to amplication of the contribution of most beams to become inelastic and absorb much energy. Moreover, due to the eects of gravity loads, the plastic rotation demand does not form symmetrically in the beams and columns, which leads to increase of demands in one side and reduction of them in the other side. In addition, in the lower stories, the plastic rotation demand is at the bottom of column; however, by moving to the upper stories, the maximum plastic rotation demand will move toward the upper side of the columns. At the end, in the low-rise models, most beams yield and enter into the plastic region, while by the increase in the number of stories, the number of yielded beams decreases due to increase in the redundancy factor. 7.3. The element plastic rotation versus drift
angle resulted from NSP
The calculation of structure demands against gravity and lateral loads is dened as force and deformation. The force demand is dened for element, while, the duc-tility demand can generally be divided into three levels of global, interstory, and element. Since the global deformation demand (roof displacement) depends on the deformation demand of the story and element, the global ductility of the structure is inuenced by the interstory and element ductility. Therefore, to make a correlation between element and global ductility demands, rst, a proper understanding of the rela-tion between interstory and element ductility demands should be excavated.
For this purpose, in this part of the study, rst, the element deformation values and the interstory drift angle (normalized by story height) are calculated by NSP. The structure is pushed to global drift of 4% (roof drift angle equals 4%). Then, the variance of plastic deformation values of the critical elements in each story has been drawn against the global drift angle
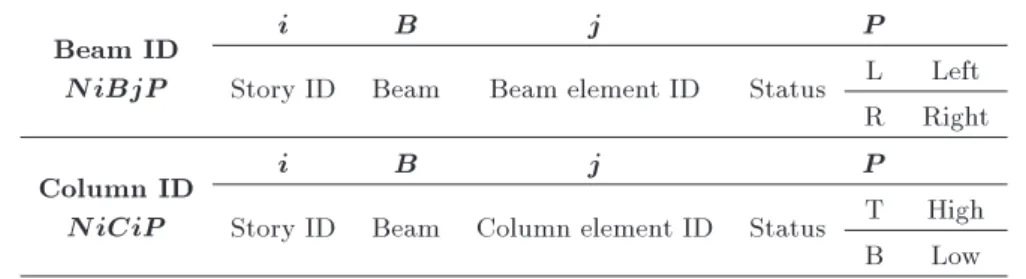
(see Figure 8). Since for every element, two joints have been dened at both ends, the maximum deformation is identied as the maximum plastic rotation of the critical node. For each element, special name was assigned. The specied name consists of 4 characters of which: the rst character refers to the number of the stories where the element is selected; the second character refers to a beam or column; the third char-acter represents the element number at story; and the last character shows the place of (end of) calculation in the element. The specications and details of the assigned names have been presented in Table 2. As an example, N1B1L refers to the beam, which is located at the rst story with an ID number of 1. In addition, the maximum rotation is recorded from the left end node of the element.
7.4. The moment demand versus interstory drift angle resulted from NSP
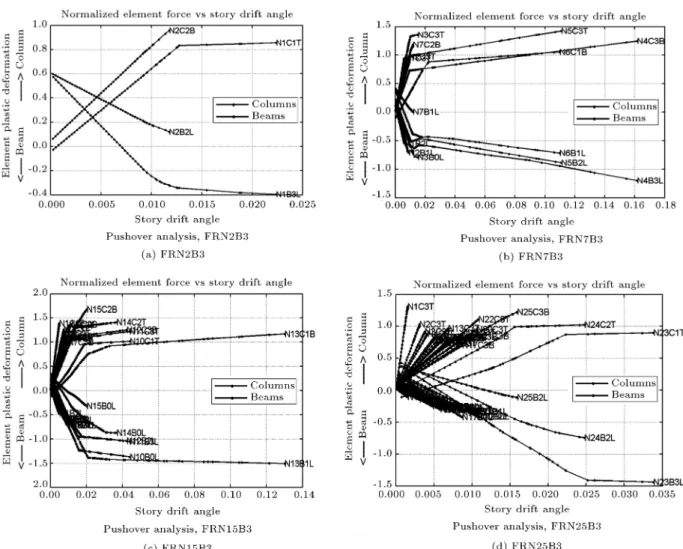
In this section of the paper, the relation between force demands (exural moment) and interstory drift has been investigated. In other words, the changes in the element forces (normalized according to related yield values obtained by FEMA356 equations) have been calculated as a function of story drift angle for the most critical beam and column in the considered story. As an example, the results obtained for 2-, 7-, 15-, and 25-story frames with three spans have been depicted in Figure 9. In these gures, the moment demands for the critical section of column and beam near the connection interface are recorded. 4% roof drift angle was dened as a target displacement of all frames. In 2-story model, the normalized force demands of columns are almost equal and independent of the number of spans. In this case, for a certain drift value, force demand of both columns in the rst and second story remains constant. In beams, the increase of interstory drift angle increases the ratio of normalized demand. The normalized ratio of column force is about 2 times more than the beam ratio. In the 7-story model, the interstory drift corresponding to the yield point of columns is almost lesser than beams (0.02 for columns against 0.12 for beams). In addition, the normalized exural moment demand in the column is more than that in the beams. Furthermore, the number of yielded columns is 4 times greater than that of the yielded beams. By increasing the number of stories in 15-story structure, the force demand of columns is more than that of beams in such a way that a considerable number of columns are yielded in a smaller drift angle value. It means that while the height of models increases, the contribution of columns in energy dissipation is greater than the beam. In other words, design models to fulll the \Strong Column-Weak Beams" does not prevent making plastic hinges in columns after beams. This is while in this structure, just two beams of upper
Figure 8. Plastic rotation demand (for critical columns " and beams #) versus interstory drift angle resulted from NSP (4% global drift).
Table 2. The index of beam and column nodes situation whose plastic rotations are reported. Beam ID
NiBjP
i B j P
Story ID Beam Beam element ID Status L Left R Right Column ID
NiCiP
i B j P
Story ID Beam Column element ID Status T High
B Low
stories have been yielded. The higher force demand of columns than that of beams is obvious in the 25-story structure. The main point is that in this structure, the number of yielded columns is less than those in the previous models. On the other hand, only one beam has been yielded. It means that while the height of model increases, due to the contribution of beam and columns and increase in the redundancy, most part of imposed earthquake energy is dissipated through elastic deformations.
7.5. The assessment of beam rotation ductility (b;k) by NDP
The third ductility level in the structure is element ductility which is known as local (rotation or curvature) ductility. This can be calculated for beams and columns in each story by means of NSP (capacity) or NDP (demand). The rotation ductility factor has been calculated as a ratio of ultimate rotation demand in both ends of the beam or column to yield rotation capacity. Since the interstory demands can be reective
Figure 9. The moment demand of elements (separated by critical columns " and beams #) versus interstory drift angle resulted from NSP (4% global drift).
of the deformation of story elements, it is logical to expect there be a relation between local element and interstory demands. Moreover, the correlation between interstory and roof ductility has been established by previous studies; so, it is possible to create a relation between roof and local ductility factors. The advan-tages of this method are: (1) Ease of global ductility evaluation via simple pushover analysis; and (2) Re-moval of computed error of local ductility resulted from roof ductility instead of interstory ductility. For the second advantage, it should be mentioned that most of the previous research establishes a relation between roof and interstory ductility via practical equation. If we decide to introduce an explicit formulation in which the interstory and local ductility correlate, another error would be entered in the approximation.
It seems that the interstory drift demand, IDR, of the moment resistant frames, which is expressed in terms of drift angle of =h ( is interstory drift and h is the height of the story), is the best performance crite-rion in intermediate damage assessment level. IDR can be a global parameter if it is associated with spectral
displacement demand; it also can be a local parameter since it provides a good estimation of deformation de-mands and element forces. To evaluate the relationship between roof and local (element) ductilities, in the rest of this section of the paper, imposed deformation demands to the elements of each story (the critical beam and column of each story) are the maximum plastic rotation on each element in that critical section resulted from NDP. The results of this section prepare a correlation between roof and local ductility demands and can be used to dene a practical equation of the next section. To calculate beam rotation ductility factor, the maximum ultimate rotation in beam critical section in each story was dened by bu;k, where k
represents the ID of critical beam in each story. Thus, the beam rotation ductility factor is:
b;k= max bu;k
by;k: (6)
We remind that b;k is the yield rotation of beam by
using Eq. (4). In the following, the mean distribution of beam rotation ductility over the height of the structure
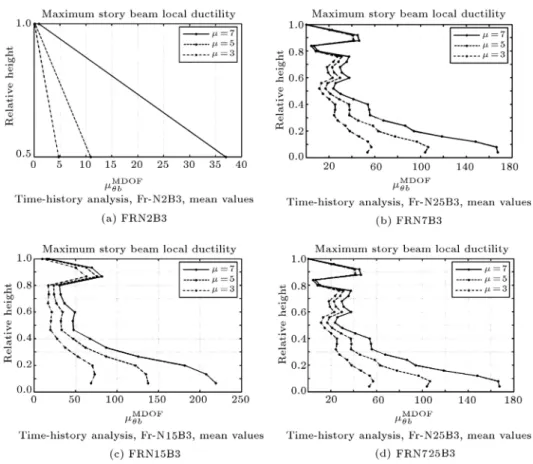
Figure 10. Maximum beam ductility demands over the height (b;k) resulted from NDP.
has been depicted in Figure 10. In these graphs, the horizontal axis is a maximum beam ductility demand, which is calculated from Eq. (6) and the vertical axis is normalized height (story height from the base normal-ized by the total height of the model). The evaluation of graphs shows that when the target ductility increases (inelastic expected behavior of structures), the rotation ductility demand for all models (with dierent numbers of stories) in each oor also increases. In addition, the element ductility values are much bigger than the story ductility factor. For example, for target ductility of 7, maximum b;k for 20-story frame was estimated
near 220. Although this value seems too much for the columns in comparison with FEMA356 limitation, at this demand level, none of the models experience any kind of dynamic instability.
Looking at the trend of b;k for short period
models (4-story and lesser) shows that by moving to the upper stories of the structure, b;k reduces. However,
the accumulation of beam maximum rotation demands is located in the lower stories of the structure. This shows that models tend to vibrate in the fundamental mode. Since, in short period structures, the higher modes eect is not signicant in local ductility distri-bution such as beam rotation ductility. However, when the number of stories increases, the distribution trend of ductility demand is no longer uniform and inclines towards the upper stories of structure due to the
partic-ipation of higher modes in local deformation demands between beam and column elements. Moreover, the maximum rotation ductility demand has been located in lower stories and by moving toward upper stories, the dierence between rotational ductility demands for various target ductility levels reduces and the rotational ductility demand value in the upper stories is less than that in lower stories. It means that the higher mode contribution has less eect on upper-story local ductilities, and it is not sensible to pre-dened target ductility. However, in the lower part of the model, changing the level of target ductility, = 7, leads to increase in local ductility of the beam between 1.5 to 1.8 times greater than = 3 and = 5. As an instant, in FRN25B3, at the rst story, b;kis 52, 103, and 168
for 3, 5, and 7 target ductilities. Finally, in all models, the maximum b;k is located at the rst story.
8. Practical equation to calculate b;k
According to the results presented in the previous sections, a controversial issue is to make a simple and logical relation between beam local ductility and target ductility (selected for MDOF systems). In fact, the main purpose is to dene modication factor by which it would be possible to calculate the maximum ductility (and, consequently, maximum total rotation) in beam for predened MDOF ductility. Then, maximum
rotation ductility factor of beam for the most critical story is restored from the previous section. Then, the modication factor of maximum beam rotation ductility, b, is calculated for all models. It should
be noted that these factors have been estimated for all models and four dierent spans. In fact, b
associates the beam maximum rotation ductility to the lateral roof ductility factor of the MDOF system. For better familiarization and deep understanding of the calculation procedure of b;k (maximum beam
ductility), on the one hand, and b, the procedure has
been illustrated in Figure 11. In the proposed method,
b was founded according to the results obtained
from the NSP and NDP. In this case, by changing the earthquake scale factor, the input ground motions have been scaled so that the corresponding roof ductility of MDOF systems is equalized to the prescribed target ductility.
Since the ductility factor can be representative of the displacement or rotation of the structure demand, in this paper, the roof ductility factor of MDOFs and maximum rotation ductility factor of beam in the critical story of the MDOFs are associated with the use of modication equation, b. In fact, this modication
factor is the ratio of maximum beam rotation ductility of MDOFs to the corresponding value obtained from SDOFs structure. To this end, the trend of bagainst
period is presented in Figure 12. It is worth noting that the results of the frames with 1, 2, 3, and 5 spans have been considered separately. Referring to Figure 12, b
increases for a period less than 2.6 sec. For dierent numbers of spans (except for the frame with one bay), the maximum value of this factor has been calculated at T = 2:6 sec. For T > 2:60 sec, balmost decreases
while the period increases. However, for a medium period, an immediate reduction has been observed. In addition, for a given period and with increase of target
ductility, b increases. Moreover, for short periods
(less than 2.6 sec), b the eect of ductility level on
b is not considerable. This is true if the ductility
has the values of 5 and 7. However, it seems that this dierence is sensitive to the number of spans, i.e. for a given period, the increase in the number of spans leads to decrease in b.
By analyzing the response databank described in this paper, the ratio of beam rotation ductility demand to a global (target ductility) was found to be strongly dependent on period, ductility, and number of spans. A nonlinear regression analysis of the response databank is presented herein, leading to the following explicit form of Eq. (6):
b= C1(; b) e (T 2:50:95 )2+ C2()e (T 63 )2; (7)
where:
C1(; b) = 22 + 1:2 1:5b; (8)
C2() = 22 + 1:5: (9)
In the above equations, , b, and T are target ductility, bay number, and fundamental period. For testing
Figure 13. The comparison of accurate values of bobtained from NDP with estimated values resulted by Eq. (6).
Table 3. The comparison of results obtained from the proposed equation of bwith analytical results in three sample
frames. Frame
ID T1 = 3:0 = 5:0 = 7:0
Analytical result
Proposed equation
Error (%)
Analytical result
Proposed equation
Error (%)
Analytical result
Proposed equation
Error (%)
N4B2 1.322 7.385 7.12 3.59 9.77 8.65 11.46 11.105 12.07 14.36
N20B3 3.121 20.019 20.8 3.2 23.733 23.92 0.79 26.779 27.3 1.94
N10B5 1.972 20.904 17.7 15.32 23.363 20.6 11.83 24.704 23.5 4.87
the accuracy of the proposed method, the values ob-tained from the analytical results along with the values obtained from a proposed formula are presented in Figure 13. These graphs have been drawn for 2-, 3-, and 5-span frames. To investigate the dierence between the results obtained from analysis and the results obtained from the above equation, the numerical values of b are compared for three sample frames as in
Table 3.
9. Conclusions
The primitive objectives of this paper were the eval-uation of the plastic rotation and imposed force on the beams and columns and establishing a practical formula to calculate maximum beam rotation ductility (and maximum beam plastic rotation) as a function of
fundamental period, number of span, and pre-dened target ductility (i.e., roof ductility). Thus, to associate the element ductility and the global ductility demand, a proper understanding of the relation between interstory and element forces and deformation demands should be obtained rstly. To do this, nonlinear static analysis with conventional load distributions (FEMA356 load pattern), so-called NSP, was used. The results obtained from the NSP show that the interior columns yield sooner due to higher contribution and interaction of axial-exural force. Furthermore, the rule of \strong column-weak beam" does not postpone the formation of plastic hinges (PH) in columns. Moreover, increasing story number causes the interior beams to absorb and dissipate inelastic demands more than exterior ones. Meanwhile, the PH sequence demonstrates that the increase in the number of stories may lead to the
for-mation of PHs in interior columns. The concentration of PH formation toward upper stories is indicative of the higher mode contribution on distributed demands of the high-rise building. Furthermore, due to the eect of gravity loads, the PH demand does not form symmetrically in beams and columns. It is good to mention that in the lower stories, the PH rotation demand is at the bottom of the column; however, for the upper stories, the PH rotation demand location moves upward the column. Due to higher mode eects, only those elements located in the upper stories yield and the contribution of plastic rotation of the lower stories of the structure severely decreases.
In order to establish a relationship between local and global demands, maximum local ductility factor for critical beams of all models was calculated. Then, an explicit factor, b, was proposed as a ratio of
beam ductility factor to target (roof) ductility. In this case, the earthquake intensity was scaled by an iterative procedure in such a way that the maximum displacement ductility ratio of MDOF structure almost equaled the target ductility bwithin a 1% tolerance
error. The most important results obtained from this section showed that the highest dierence between local ductilities was related to the lower stories of the structure under various target ductility levels. In the upper stories, this factor is almost independent of target ductility levels. It means that although the higher mode eects are important in local deformation distribution, in high-rise buildings, the inelastic region is concentrated in the lower stories. This behavior is due to shear deformation mechanism in moment resting frames. In this deformation type, the concentration of lateral drift is located at the lower stories and the contribution of beam stiness to control the drift is always more than columns.
The ductility distribution over the height of the models showed that in the short period models (4-story and lesser), the structure almost behaves in the rst mode of vibration. Thus, the concentration of deformation is in the lower stories, while by the increase in the number of stories, the distribution of ductility demand is no longer uniform and it increases in the upper stories due to the participation of higher modes. Furthermore, the increase in the number of spans increases the ductility demand of the upper stories. With an increase in the number of stories, the variation of b remains almost constant for dierent
target ductilities (i) in the middle stories. While, in
the lower stories, there will be signicant dierences between corresponding b. On the contrary, in the
upper stories, the dierence between b decreases
with respect to dierent values of i. The correlation
between band period indicates that with increasing
period this factor increases. The maximum value of b corresponds to the period of 2.6 seconds for all
cases, except for 1-span model. After this period, ub immediately decreases and then it remains almost
constant. In addition, for a given period, the increase of target ductility increases b. But, for a given
period, the increase in the number of spans decreases b. As an instant, for 2-span models, maximum
b (corresponding to a period of 2.6 sec) was
esti-mated 43, which had decreased to one-third of 1-span frames.
References
1. Nassar, A. and Krawinkler, K. \Seismic demands for SDOF and MDOF", Report No. 95, Dept. of Civil Engineering, Stanford University, Stanford, California (1991).
2. Gupta, A. and Krawinkler, H. \Estimation of seis-mic demands for frame structures", Earthquake En-gineering & Structural Dynamics, 29(9), pp.1287-1305 (2002).
3. Gupta, A. and Krawinkler, H. \Behavior of ductile SMRFs at various seismic hazard levels", Journal of Structural Engineering, 126(1), pp. 98-107 (2000). 4. Chopra, A.K. and Chintanapakdee, C. \Inelastic
defor-mation ratios for design and evaluation of structures: single-degree-of-freedom bilinear systems", Journal of Structural Engineering, 130(9), pp. 1309-1319 (2004). 5. Ruiz-Garca, J. and Miranda, E. \Inelastic dis-placement ratios for evaluation of existing struc-tures", Earthquake Engineering & Structural Dynam-ics, 32(8), pp. 1237-1258 (2003).
6. Iwan, W.D. \Estimating inelastic response spectra from elastic spectra", Earthquake Engineering & Struc-tural Dynamics, 8(4), pp. 375-388 (1980).
7. Jacobsen, L.S. \Steady forced vibrations as inuenced by damping", Trans. ASME, 52(15), pp. 169-181 (1930).
8. SAC 95-06, \Technical report: surveys and assessment of damage to buildings aected by the Northridge earthquake of July 17, 1994", Part of FEMA Phase I SAC Project, Report No. 95-06 (1995).
9. Miranda, E. and Bertero, V. \Evaluation of strength reduction factors for earthquake-resistant design", Earthquake Spectra, 10(2), pp. 357-379 (1994). 10. Veletsos, A.S. and Vann, W.P. \Response of
ground-excited elastoplastic systems", Journal of the Struc-tural Division, 97(4), pp. 1257-1281 (1971).
11. Nassar, A.A., Osteraas, J.D. and Krawinkler, H. \Seis-mic design based on strength and ductility demands", In 10th World Conference on Earthquake Engineering, 10, pp. 5861-5866 (July 1992).
12. Seneviratna, G.D.P.K. \Evaluation of inelastic MDOF eects for Seismic design", Ph.D. Dissertation to be submitted to the Dept. of Civil Engineering, Stanford University Stanford, California (1995).
13. Humar, J. and Rahgozar, M. \Application of inelastic response spectra derived from seismic hazard spectral ordinates for Canada", Canadian Journal of Civil Engineering, 23(5), pp. 1051-63 (1996).
14. Gulkan, P. and Akkar, S. \A simple replacement for the drift spectrum", Journal of Engineering Structures, 24(11), pp. 1477-1484 (2002).
15. Loeding, S., Kowalsky, M.J. and Priestley, M.N. \Di-rect displacement-based design of reinforced concrete building frames", Report No. SSRP-98/08. San Diego (La Jolla, CA): Division of Structural Engineering, University of California (2007).
16. Miranda, E. \Approximate seismic lateral deformation demands in multistory buildings", Journal of Struc-tural Engineering, 125(4), pp. 417-25 (1999).
17. Miranda, E. and Reyes, C.J. \Approximate lateral drift demands in multistory buildings with non-uniform stiness", Journal of Structural Engineering, 128(7), pp. 840-9 (2002).
18. Gerami, M. \The eect of higher modes on ductility demand and seismic strength of SMRF", Ph.D. Disser-tation to be submitted to Dept. of Civil Engineering, University of Tarbiat-e-Modarres, Tehran (2002). 19. Medina, R., Seismic Demands for Nondeteriorating
Frame Structures and their Dependence on Ground Motions, Ph.D. Dissertation to be submitted to the Dept. of Civil Engineering, Stanford University, Stan-ford, California (2003).
20. Karavasilis, T.L., Bazeos N. and Beskos, D.E. \Maxi-mum displacement proles for the performance based seismic design of plane steel moment resisting frames", Engineering Structures, 28, pp. 9-22 (2006).
21. Karavasilis, T.L., Bazeos N. and Beskos, D.E. \Drift and ductility estimates in regular steel MRF subjected to ordinary ground motions: A design-oriented ap-proach", Earthquake Spectra, 24, pp. 431-151 (2008). 22. Karavasilis, T.L., Makris, N., Bazeos, N. and Beskos
D.E. \Dimensional response analysis of multi-story regular steel MRF subjected to pulse-like earthquake ground motions", Journal of Structural Engineering (ASCE), 136, pp. 921-932 (2010).
23. Zhou, J., He, F. and Liu, T. \Curvature ductility of columns and structural displacement ductility in RC frame structures subjected to ground motions", Soil Dynamics and Earthquake Engineering, 63, pp. 174-183 (2014).
24. FEMA 356, NEHRP Recommended Provisions for Seismic Regulations for New Buildings and Other Structures, Building Seismic Safety Council, Washing-ton D.C (2000).
25. American Society of Civil Engineering ASCE, Seismic Rehabilitation of Existing Buildings, ASCE/SEI 41-13, Reston, Virginia (2013).
26. BHRC, Iranian Code of Practice for Seismic Resistant Design of Buildings, Standard no. 2800-05, 3rd Ed., Building and House Research Center, Tehran, Iran (2005).
27. INBR, Loads on Buildings (Code No.6), Iran Na-tional Building Regulations Center, INBR Publica-tions, Tehran, Iran (2008).
28. ANSI/AISC 360-05, Specication for Structural Steel Buildings, American Institute of Steel Construction, INC, Chicago, Illinois 60601-1802 (2005).
29. Prakash, V., Powell, G.H. and Campbell, S., DRAIN-2DX, Static and Dynamic Analysis of Plane Struc-ture, NISEE, Earthquake Engineering Research Cen-ter, University of California, Berkeley (1993).
30. Antoniou, S. and Pinho, R., SeismoSignal, Version 5.0.0 (2010-2012).
31. Gerami, M. and Abdollahzadeh, D. \Vulnerability of steel moment-resisting frames under eects of forward directivity", The Structural Design of Tall and Special Buildings, 24(2), pp. 97-122 (2014).
Biographies
Mohsen Gerami was born in 1964. He received his PhD degree from Tarbiat Modares University, Tehran, Iran, in 2003. He is now working as Associate Professor of Civil Engineering and also a head of Building Hi-Technology Research Center at Semnan University. His research focuses on seismic design of steel structures, earthquake engineering, and nonlinear problems. He has published more than 120 journal and conference papers, and 2 books.
Navid Siahpolo was born in 1982. He obtained his BS degree in Civil Engineering from the Department of Civil Engineering at Chamran university of Ahwaz, Iran, in 2003, and his MS degree from Persian-Gulf University, Bushehr, Iran, in 2006. He is now working as faculty member in Civil Engineering Department at Khuzestan ACECR Institute for Higher Education. He received his PhD degree from Semnan University, Semnan, Iran, in 2015. His research eld focuses on the eect of near-fault pulse-like earthquakes on frame structures and development of practical equations for quick assessment of steel structures. He has published more than 30 journal and conference papers, and 2 books.
![Figure 1. Force-deformation curves used for plastic hinges modelling based on FEMA356 [24].](https://thumb-us.123doks.com/thumbv2/123dok_us/8381673.2226817/3.892.482.822.942.1114/figure-force-deformation-curves-plastic-hinges-modelling-based.webp)
![Figure 4. Nine-story building (adapted from [8]).](https://thumb-us.123doks.com/thumbv2/123dok_us/8381673.2226817/7.892.124.795.644.1138/figure-nine-story-building-adapted-from.webp)