Address for correspondence
Ava Nikbin
E-mail: [email protected]
Funding sources
None declared
Conflict of interest
None declared
Acknowledgements
We would like to thank the employees of Ayatollah Rouhani Hospital, Iran, especially Dr. Mahdi Rahmani, for their cooperation.
Received on April 4, 2018 Reviewed on July 3, 2018 Accepted on July 18, 2018
Abstract
Background. Densitometry plays an important role in the diagnosis of different types of dental materials and treatment planning. Due to diversity in density, equal amounts of different materials absorb various amounts of X-rays and yield different radiographic views.
Objectives. The aim of this study was to evaluate the gray scales of 5 commercially available restorative ma-terials, including amalgam, composite resin, flowable composite resin, glass-ionomer, and Dycal.
Material and methods. Samples of the 5 test materials from various manufacturers were prepared, each 5-millimeter-thick. There were 7 glass-ionomer samples and 10 of each of the other materials, making a total of 47 samples in the study. The test materials were scanned using a Kodak cone-beam computed tomography (CBCT) unit. Subsequently, the gray scales were determined and evaluated by a radiologist using OnDemand3DTM Dental software and analyzed with SPSS v. 22 software.
Results.Amalgam had a higher gray scale than the other groups of restorative materials. In some cases, it was the same as that of composite resin; however, it was significantly different from gray scales of flowable composite resin, glass-ionomer and Dycal. It was concluded that composite resin and amalgam were high in gray scale, while flowable composite resin, glass-ionomer and Dycal exhibited low gray scales.
Conclusions. Amalgam and composite resin had high gray scales, and glass-ionomer and Dycal exhibi-ted the lowest gray scale values. The findings show that CBCT can be helpful in differentiating amalgam and composite resin from other materials.
Key words: cone-beam computed tomography, dental materials, densitometry
Słowa kluczowe: stożkowa tomografia komputerowa, materiały dentystyczne, densytometria DOI
10.17219/dmp/93569
Copyright
© 2018 by Wroclaw Medical University and Polish Dental Society
This is an article distributed under the terms of the Creative Commons Attribution Non-Commercial License (http://creativecommons.org/licenses/by-nc-nd/4.0/)
Evaluation of the gray level of restorative materials using
cone-beam computed tomography: A cross-sectional study
Ocena poziomu szarości materiałów stomatologicznych
w tomografii stożkowej – badanie przekrojowe
Pezhman Hadadi
1,A, Farzane Ostovarrad
2,B, Ava Nikbin
2,D–F, Hadi Ranjzad
3,B, Farzane Ghasemi
4,B, Somayeh Nemati
2,B1 Department of Oral and Maxillofacial Radiology, Faculty of Dentistry, Guilan University of Medical Sciences, Anzali, Iran 2 Department of Oral and Maxillofacial Radiology, Faculty of Dentistry, Guilan University of Medical Sciences, Rasht, Iran 3 Department of Prosthodontics, Faculty of Dentistry, Guilan University of Medical Sciences, Anzali, Iran
4 Faculty of Dentistry, Guilan University of Medical Sciences, Rasht, Iran
A – research concept and design; B – collection and/or assembly of data; C – data analysis and interpretation; D – writing the article; E – critical revision of the article; F – final approval of the article
Introduction
One of the main issues playing an important role in the assessment of different dental materials and in treatment planning is densitometry. For example, distinguishing the density of bone undeniably affects the success of dental implants.1 In addition, in the case of maxillofacial
trau-ma or a foreign body suspected in the surrounding soft tissue, densitometry can be used to determine the kind of the foreign body, which might be a restorative material. Densitometry is also useful while distinguishing restor-ative materials used in older treatment plans from each other and from the recent ones, which can be of great im-portance in dental treatment planning.2,3 Equal amounts
of different materials, due to differences in their atomic number and density, result in differences in the attenu-ation of X-rays. As a result, they have different radio-graphic projections even on plain films. Therefore, given the density of any material, its nature can be determined through radiography.4 Denser materials have less space
in their crystal networks and their molecules are highly compressed. These substances absorb much more X-ray radiation when they are exposed to X-rays, since they have more atoms and more electrons.5,6
X-rays are used to produce images from opaque mate-rials based on the relationship between the density and X-ray absorption of different materials.7 Different
tech-niques, such as computed tomography (CT) and cone-beam computed tomography (CBCT) can be used.
In the CT technique, one number is assigned to each pixel displaying the images and this shows the rate of at-tenuation of rays by each tissue. Computed tomography numbers are known as Hounsfield units (HU). In 1978, this technique was introduced in bone densitometry. Var-ious studies have recognized CT as the gold standard for tissue densitometry.8
The CBCT technique is of great importance in head and neck traumas. In recent years, CBCT has also been used as a critical diagnostic tool in dentistry9–13 and it is an
in-novative technique in scanning and data reconstruction. Cone-beam computed tomography is widely used for 3-dimensional and multiplanar images. Compared to CT, this method can provide detailed images – up to sub-millimeter resolution – in a shorter time and at a lower dosage; in addition, it is more affordable for patients. However, CBCT has shortcomings as well. The quality of reconstructed CBCT images is affected by noise, beam hardening, the cone-beam effect and photon starvation. These effects result in the formation of different types of artifacts, such as bright streaks of radiation, dark areas adjacent to metal objects or even a complete loss of gray shadows between adjacent metal objects. Beam harden-ing results from the preferential absorption of lower-energy photons in a heterogeneous X-ray beam. As op-posed to rectangular objects, in spherical and cylindrical objects, like the skull and implants, the distance through
the center is longer than a path closer to the surface, the central area can appear as a dark area with a decreased CT number (HU) in the middle of axial cuts.14
Neverthe-less, recent research shows that by analyzing gray scales, CBCT can determine HU of tissues and, as a result, the densities of different bones.14,15 There are limited studies
on the use of CBCT to determine the density of restor-ative materials.15
The aim of this study was to evaluate the gray levels of materials in restorative dentistry, using CBCT in stan-dard exposure, which could help to assess the materials, and thus improve treatment planning.
Material and methods
This pilot study is one of the first studies on evaluating the gray levels of dental restorative materials with the use of the CBCT technique. Each group of substances con-sisted of 10 different products from various manufactur-ers, except for the glass-ionomer group, which included 7 samples, making a total of 47 samples of restorative ma-terials evaluated in 5 groups.
The technical specifications of the 5 substances, com-monly used in restorative dentistry, evaluated in this study are as follows:
– amalgam: A – ANA 2000® ( Nordiska Dental, Ängelholm, Sweden); B – GS-80® (SDI, Itasca, USA); C – Cinalux® (Shahid Faghihi, Tehran, Iran); D – GK® (AT&M Bio-materials, Beijing, China); E – GK-110® (AT&M Bioma-terials; F – Wykalloy® (Prestige Dental Products, Ana-heim, USA); G – Aristaloy 21® (Lavadent, London, UK); H – World Work Powder Alloy® (World Work, Monte-bello Vicentino, Italy); I – Contour® (Kerr, Orange, USA); J – 110-Plus® (Anas Dental Supplies, Damascus, Syria); – composite resin: A – SDI Luna® (SDI, Itasca, USA);
B – Coltene-Synergy® (Coltene Whaledent Inc., Cuyahoga Falls, USA); C – Filtek Z250-XT® (3M, Seefeld, Germany); D – Opallis® (FGM, Joinville, Bra-zil); E – Bisco-Aelite Aesthetic Enamel® (Bisco, Scha-umburg, USA); F – Estelite Sigma Quick® (Tokuyama, Tokyo, Japan); G – Shofu-Beautifil II® (Shofu, Kyoto, Japan); H – Denfil® (Vericom, Anyang, South Ko-rea); I – Diafil® (Diadent, Cheongju, South Korea); J – Charmfil Plus® (Dentkist, Seoul, South Korea); – flowable composite resin: A – Denfil Flow® (Vericom);
B – Diafil Flow® (Diadent); C – Denu Flow Resin® (HDI-Denu, Seoul, South Korea); D – Permaflo Pink® (Ultra Dent, South Jordan, USA); E – Clearfil AP-X Flow® (Ku-raray, Chicago, USA); F – Opallis Flow® (FGM); G – He-liomolar Flow® (Ivoclar Vivadent, Mississauga, Canada); H – Tetric N-flow® (Ivoclar Vivadent, Mumbai, India); I – Wave® (SDI, Itasca, USA); J – Filtek Z350-XT® (3M); – glass-ionomer: A – Riva Luting® (SDI, Bayswater,
Aus-tralia); B – GC Fuji I® (GC, Tokyo, Japan); C – Tokuso Ion-omer® (Tokuyama); D – Chemfil Superior® (Dentsply,
Tulsa, USA); E – Ionoseal® (VOCO, Cuxhaven, Ger-many); F – Iono Cid-LC® (FSDS, Greenock, Canada); G – Glass Liner® (WP Dental, Barmstedt, Germany); – Dycal: A – ACTIVA Bioactive-base/liner® (Pulpdent
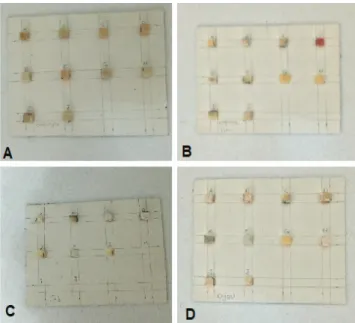
Corporation, Watertown, USA); B – Dycal Ivory® (Dentsply); C – ANA Liner® (Nordiska Dental, Ängel-holm, Sweden); D – Biner-LC® (Meta Biomed, Cheon-gju, South Korea); E – Hidrox-Cal® (Maquira, Maringá, Brazil); F – Theracal LC® (Bisco); G – Ionosit-Baseliner® (DMG Chemisch-Pharmazeutische, Hamburg, Ger-many); H – Master Dent Cavity Liner® (Master Dent, Garden Grove, USA); I – Ultra Blend Plus® (Ultra Dent, South Jordan, USA); J – Charmfil Flow® (Dentkist). To prepare the test set, a cardboard grid measuring 135 × 60 × 1 mm was selected and a collection of cubes with the same size (5 × 5 × 5 mm) was made of it (Fig. 1). The rows show the material types used and the columns show the manufacturers. Each material was placed in one of the cubes and the samples were prepared for final set-ting according to the same clinical procedure. The prepa-ration procedures were as follows: amalgam samples were packed using a condenser, and composite resin samples were light-cured layer by layer; to light-cure flowable composite resin, glass-ionomer and Dycal, a light-curing unit was used (Fig. 2).
After the final setting, the restorative materials were separated from the cardboard grid and each group of ma-terials was laid on a separate sheet. The composite res-in, flowable composite resres-in, glass-ionomer, and Dycal samples were placed on 4 separate cardboards with a dis-tance of 1.5 cm between them (Fig. 3). For the amalgam samples, a little more space was left between them (about 2 cm) due to artifacts made by amalgam during image ac-quisition (Fig. 4). It should be pointed out that there was a limitation to the cardboard sheet size, since a larger size would have been out of the field of view of the CBCT sys-tem. In addition, since the space between the amalgam samples was more than that between other materials, each sample had to be scanned separately.
Fig. 1. A cardboard grid fabricated for the placement of the restorative materials
Fig. 2. Squares of the cardboard grid fi lled with the restorative materials
Fig. 3. A –composite resin; B – fl owable composite resin; C – glass-ionomer; D – Dycal cubes attached to the cardboard sheet with a distance of 1.5 cm between them
Fig. 4. Amalgam cubes attached to the cardboard sheet with a distance of 2 cm between them
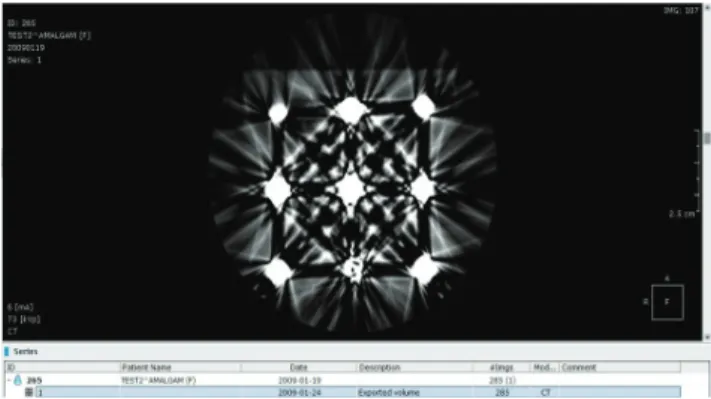
Each cardboard sheet holding 1 of the restorative mate-rials was exposed to a CBCT system (Kodak CBCT, Car-estream Company, Rochester, USA) under standard ex-posure conditions (MA = 6.3, kVp = 73, voxel = 180). The acquired images were analyzed by an experienced radiolo-gist in a horizontal view, using OnDemand3DTM Dental
software (Cybermed, Seoul, South Korea) and the gray scale of each sample was recorded by determining the mean, min and max values at the center of the sample (Fig. 5,6).
The gray levels were determined at the center of the samples to minimize the artifact effect. It should be point-ed out that cubic and homogeneous samples were uspoint-ed in the present study to eliminate the beam-hardening ef-fect, which is a problem in spherical, cylindrical and non-homogeneous samples. The samples were completely identical and the artifact effect, if any, would affect them all similarly.
The data was recorded in checklists and analyzed with SPSS v. 22 software (IBM Corp., Armonk, USA). The gray scale was evaluated using means and standard deviations (SDs) at a 95% confidence interval (CI), separately for each dental material under standard exposure conditions. An analysis of variance (ANOVA) was used to compare the means of gray scales in the dental materials under exposure conditions and between different materials. Post-hoc Tukey’s tests were used for two-by-two comparisons of the mean gray scale values of the dental materials. In the cases when the gray scale data was not normally distributed, corresponding non-parametric tests were used. Statistical significance was set at p < 0.05.
Results
The data in Table 1 shows that the highest min gray scale value among the samples in the study was exhibited by amal-gam (10,160.20 ±1,766.53; 95% CI: 8,896.50‒11,423.90). Dycal exhibited the lowest min gray scale value among the restorative materials in the study (4,861.00 ±1,159.35; 95% CI: 4,031.65‒5,690.35). Based on a one-way ANOVA, the 5 restorative materials in the study showed significant dif-ferences in the min gray scale values (p = 0.001).
The data in Table 1 shows that the highest max gray scale value was exhibited by amalgam (14,554.1 ±2927.9; 95% CI: 12,459.63‒16,648.57). The lowest max gray scale value belonged to glass-ionomer (8,192.29 ±4,172.52; 95% CI: 4,333.34‒12,051.23), indicating a significant difference in the max gray scale values based on a one-way ANOVA (p = 0.001).
Fig. 5. The cone-beam computed tomography (CBCT) image of amalgam cubes scanned by a Kodak CBCT system
Fig. 6. The cone-beam computed tomography (CBCT) images of: A – composite resin; B – fl owable composite resin; C – glass-ionomer; D – Dycal cubes, scanned by a Kodak CBCT system
The analysis of the mean gray scale values of the re-storative materials (Table 1) shows that the highest val-ue was displayed by amalgam (11,253.7 ±1706.37; 95% CI: 10,033.03‒12,474.37). The lowest mean gray scale value was found in Dycal (6,692.80 ±1,837.25; 95% CI: 5,378.51‒8,007.09), indicating a statistically significant dif-ference in the mean gray scale values among the 5 restor-ative materials in this study based on a one-way ANOVA (p = 0.009).
Post-hoc Tukey’s tests were used to compare the min, max and mean gray scale values. Using pair-wise analy-ses of the restorative materials, it was concluded that the min value of amalgam was significantly different from all
the other materials except for composite resin. It is worth noting that flowable composite resin exhibited a border-line significant difference from amalgam in the min gray scale value.
Regarding the gray scale max value, in pair-wise com-parisons of the restorative materials, amalgam exhibited the following statistically significant differences from the other materials: composite resin (p = 0.013), flowable composite resin (p = 0.016), glass-ionomer (p = 0.005), and Dycal (p = 0.002). Amalgam had the highest max gray scale value of all the materials. Other materials, however, did not show a statistically significant difference in the above test (p > 0.05).
Table 1. Comparison of the min and max gray scale values in 5 restorative materials
Descriptives
Types of dental materials n mean SD 95% CI min max p-value
lower bound upper bound
Min
amalgam 10 10,160.20 1,766.53 8,896.50 11,423.90 7,703.00 13,193.00 0.001 composite 10 7,248.90 2,690.49 5,324.24 9,173.56 2,839.00 11,188.00
composite flow 10 6,491.40 3,279.22 4,145.59 8,837.21 1,723.00 10,544.00 glass-ionomer 7 6,248.14 3,582.88 2,934.53 9,561.75 232.00 9,639.00 Dycal 10 4,861.00 1,159.35 4,031.65 5,690.35 2,864.00 6,494.00
Max
amalgam 10 14,554.10 2,927.87 12,459.63 16,648.57 10,474.00 19,335.00
composite 10 9,306.00 3,017.59 7,147.35 11,464.65 4,263.00 14,888.00 0.001 composite flow 10 9,457.30 4,713.73 6,085.30 12,829.30 4,476.00 18,368.00
glass-ionomer 7 8,192.29 4,172.52 4,333.34 12,051.23 1,906.00 14,798.00 Dycal 10 8,269.60 2,081.21 6,780.80 9,758.40 5,816.00 12,905.00
Mean
amalgam 10 11,253.70 1,706.37 10,033.03 12,474.37 8,433.00 13,765.00 0.009 composite 10 8,217.50 2,768.59 6,236.97 10,198.03 3,644.00 12,503.00
composite flow 10 7,713.10 3,698.44 5,067.39 10,358.81 2,660.00 12,286.00 glass-ionomer 7 7,252.57 3,835.23 3,705.57 10,799.57 1,276.00 12,583.00 Dycal 10 6,692.80 1,837.25 5,378.51 8,007.09 4,145.00 10,927.00 SD – standard deviation; CI – confidence interval.
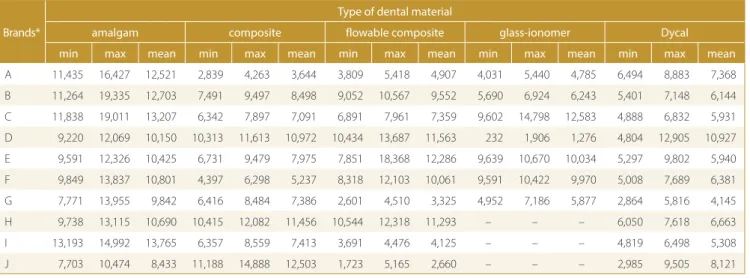
Table 2. The min, max and mean gray scale values in diff erent brands of 5 restorative materials
Brands*
Type of dental material
amalgam composite flowable composite glass-ionomer Dycal
min max mean min max mean min max mean min max mean min max mean
A 11,435 16,427 12,521 2,839 4,263 3,644 3,809 5,418 4,907 4,031 5,440 4,785 6,494 8,883 7,368 B 11,264 19,335 12,703 7,491 9,497 8,498 9,052 10,567 9,552 5,690 6,924 6,243 5,401 7,148 6,144 C 11,838 19,011 13,207 6,342 7,897 7,091 6,891 7,961 7,359 9,602 14,798 12,583 4,888 6,832 5,931 D 9,220 12,069 10,150 10,313 11,613 10,972 10,434 13,687 11,563 232 1,906 1,276 4,804 12,905 10,927 E 9,591 12,326 10,425 6,731 9,479 7,975 7,851 18,368 12,286 9,639 10,670 10,034 5,297 9,802 5,940 F 9,849 13,837 10,801 4,397 6,298 5,237 8,318 12,103 10,061 9,591 10,422 9,970 5,008 7,689 6,381 G 7,771 13,955 9,842 6,416 8,484 7,386 2,601 4,510 3,325 4,952 7,186 5,877 2,864 5,816 4,145 H 9,738 13,115 10,690 10,415 12,082 11,456 10,544 12,318 11,293 – – – 6,050 7,618 6,663 I 13,193 14,992 13,765 6,357 8,559 7,413 3,691 4,476 4,125 – – – 4,819 6,498 5,308 J 7,703 10,474 8,433 11,188 14,888 12,503 1,723 5,165 2,660 – – – 2,985 9,505 8,121 * The letters A–J represent different brands according to the description in section “Material and methods”.
The results of pair-wise analyses of the mean gray scale values showed that amalgam was significantly different from glass-ionomer (p = 0.048) and Dycal (p = 0.007). The difference between amalgam and flowable composite resin was borderline significant (p = 0.057), while the dif-ference between amalgam and composite resin was not significant (p = 0.136). Based on Tukey’s honest signifi-cant difference (HSD) tests, the other restorative mate-rials did not exhibit significant differences in the mean values in pair-wise comparisons.
Amalgam had higher min, max and mean gray scale val-ues than the other restorative materials. It exhibited the same gray scale value as composite resin in some cases, but was significantly different from glass-ionomer, Dycal and flowable composite resin. It can be concluded that composite resin and amalgam were high in gray scale, and flowable composite, glass-ionomer and Dycal exhibited low gray scale.
Table 2 presents the min, max and mean gray scale val-ues of the restorative materials in terms of their brands. The results show that among the amalgam samples, Kerr had the highest min and mean values, and SDI had the highest max gray scale value compared to the other brands.
Among the composite brands, Dentkist exhibited the highest min, max and mean gray scale values, and the lowest values belonged to SDI.
Among the flowable composite resins, the highest max and mean gray scale values belonged to Kuraray, and the highest min gray scale level was found in Ivoclar Vivadent, India. The lowest min nad mean gray scale values belonged to 3M, and the lowest max gray level belonged to SDI.
Out of the 7 glass-ionomer brands, the highest max and mean gray scale values belonged to Tokuyama, and the lowest values were found in Dentsply.
In Dycal, the highest min gray scale value belonged to Pulpdent Corporation, and the lowest max, min and mean values belonged to DMG Chemisch-Pharmazeutische.
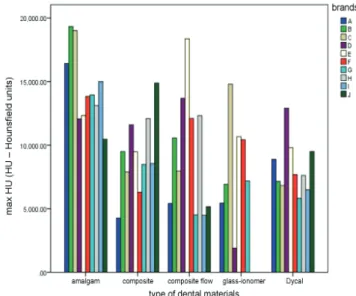
The min, max and mean gray scale values of different re-storative materials in terms of their brands are presented in Fig 7–9.
The min gray scale value was higher in amalgams than in the other restorative materials. Glass-ionomer and Dy-cal had a lower value than the other restorative materials. Composite resin and flowable composite resin were in the middle of the range.
Among the amalgam samples, the max gray value be-longed to SDI and the min value bebe-longed to Anas Den-tal Supplies. Among the composite resins, the max was found in Dentkist and the min was noted in SDI. Flow-able composite resins showed their max and min values in Kuraray and 3M, respectively. Glass-ionomer exhibited the max and min values in Tokuyama and Dentsply, re-spectively. Finally, in Dycal, the max and min gray scale values belonged to Meta Biomed and DMG Chemisch-Pharmazeutische, respectively.
Fig. 7. Minimum gray scale values of restorative materials in relation to their brands
Fig. 8. Maximum gray scale values of restorative materials in relation to their brands
Fig. 9. Mean gray scale values of restorative materials in relation to their brands
Discussion
Cone-beam computed tomography has been used as an important diagnostic tool in recent years.9–13 It is an
innovative method in scanning and image reconstruc-tion. In this technique, materials with different densi-ties, such as bone and soft tissue, can be differentiated based on their densitometry. Several studies have been conducted in this regard, but only a few have evaluat-ed the density of restorative materials commonly usevaluat-ed in dentistry.
Among these studies, Lachowski et al. analyzed the ra-diopacity of various dental materials (bases and liners).16
They used digital intraoral radiography (Kodak; radiovisi-ography (RVG): 5000, 70 kVp, 7 mA, 0.32 s, 30-centime-ter distance). As in the present study, Tetric N-flow was among the flowable composite resins. With a thickness of 3 mm, this material exhibited the highest gray scale. It had the second highest gray scale value in the pres-ent study, consistpres-ent with the results of the study by La-chowski et al. It must be pointed out that the gray scale value of a material is directly related to its density. Con-sidering this and the results of the present study, in the category of flowable composite resins, the lowest gray scale value belonged to the most flowable one. The same cannot be said with certainty regarding glass-ionomers, because they are supplied as 2-part powder and liquid systems that require mixing, depending on their different therapeutic applications. Glass-ionomers are sometimes used in a creamy consistency to line dental caries, but in class V restorations on the root surface, they are used in a thicker consistency.
By scanning samples of different sizes, Lachowski et al. concluded that the thickness of the samples had a di-rect effect on the final radiography. Thicker samples had a greater amount of substance, and thus more X-ray at-tenuation was observed16. In the present study, all the
samples for scanning were prepared in the same dimen-sions and their thickness was fixed at 5 mm. In addition, the sub-categories of each group of restorative materials were compared to each other in terms of the min and max gray scale values, with a direct relation between density and gray scale values resulting from the CBCT images.
Although intraoral digital imaging is less costly than CBCT, since it does not provide a value level as the out-put of the radiopacity analysis, the materials in the study by Lachowski et al. were measured with a single opaque item. In that study, the opacity of the materials in alumi-num sheets of different thicknesses were evaluated. The ingredients of aluminum sheets vary and this affects their opacity. Furthermore, the opacity of the study samples, compared to the opaque aluminum sheet, was evaluated with the use of relative measurements.16 However, in the
present study, the CBCT technique was used to capture images, which had the advantage of higher resolution and accuracy compared to other imaging systems.
In another study, Devito et al. compared the radiopacity of 3 types of calcium hydroxide (Dycal, Hydro-C, Life) us-ing digital radiography. They concluded that the radiopac-ity of the cement and enamel was equal to 2 mm of alumi-num, but the radiopacity of the dentin was equal to 1 mm of aluminum. In that study, the lowest opacity belonged to Life.17 In the present study, among the 10 different types
of Dycal, the least opacity was noted for Ionosit-Baseliner and the highest for Biner-LC. Hidrox-Cal, which was as-sessed both in this study and in the study by Devito et al., was in the middle of the spectrum.
Pires de Souza et al. investigated the optical densities of calcium hydroxide and glass-ionomer, concluding that in order to assess the radiopacity of different materials, the min thickness of the samples must be approx. 1.5‒2 mm.18
In the present study, the thickness of each sample was 5 mm. It is consistent with the above-mentioned authors, who used intraoral radiography to examine the opacity of the materials.
In research conducted by Imperiano et al., intraoral ra-diography and materials of equal thickness (2 × 10 mm) were used to measure the density of different composite resin types. In that study, Natural Flow and Protect Liner F composite resins did not exhibit any specific opacity that would allow them to be differentiated from dental car-ies.19 However, in the present study, none of the
compos-ite resins exhibcompos-ited a significant difference from amalgam and all had the necessary opacity for differentiation from the tooth structure. This discrepancy between the results of studies might be attributed to differences in research methods. In addition, none of the brands evaluated in the present study was used in the study by Imperiano et al.
Factors affecting the results obtained from CBCT in-clude the scanning conditions and the type of device.4,8,20,21
Therefore, to determine the gray scale of different restor-ative dental materials, a single CBCT device was used.
As discussed above, in the CT technique one number is assigned to each pixel, which indicates the amount of radia-tion attenuated by the studied tissue.8 This is one of the
dif-ferences between CT and CBCT, and the lack of real HU (as in CT) is a disadvantage of CBCT. Mah et al. examined the different structures of 11 dental CBCT units and 2 medical CT systems. The results showed that there was a high cor-relation between HU in CT and the gray scale in CBCT.21
In the present study, CBCT was used instead of CT due to its greater advantages, such as low-dose radiation, high preci-sion in supplying images at shorter scan times, higher reso-lution and clarity, and lower cost compared to medical CT.
In a study by Razi et al., the soft tissue of a sheep’s head was used.4 Mah et al. placed specimens in a bowl of water
in or-der to simulate soft tissue to some extent for X-ray attenu-ation.21 However, Parsa et al. used a dry mandible.20 In the
present study, an attempt was made to obtain a number for the gray scale value of the restorative materials by eliminat-ing confoundeliminat-ing factors, such as facial soft tissue, tongue and saliva in order to provide a background for future studies.
In another study, Emadi et al. compared different sam-ples of restorative materials and reported that amalgam and AH-26 had the highest gray scale value. Zinc phos-phate, gutta-percha and zinc oxide eugenol had the sec-ond place, followed by MTA and polycarboxylate.8 In the
present study, amalgam, composite resin, flowable com-posite resin, glass-ionomer, and Dycal were studied, and the highest gray scale value was noted for amalgam; this was consistent with the results reported by Emadi et al. In the present study, Dycal exhibited the lowest gray scale.
Conclusions
The results of the present study show that CBCT can be efficient in differentiating amalgam and composite resin from other materials, such as flowable composite resin, glass-ionomer and Dycal. This is a pilot study; therefore, in further studies we will compare this value in different CBCT and multi-row-detector computed tomography (MDCT) systems.
References
1. Arisan V, Karabuda ZC, Avsever H, Özdemir T. Conventional mul-ti-slice computed tomography (CT) and cone beam CT (CBCT) for computer assisted implant placement. Part I: Relationship radio-graphic gray density and implant stability. Clin Impl Dent Rel Res. 2013;15(6):893–906.
2. Aras MH, Miloglu O, Barutcugil C, Kantarici M, Ozcan E, Harorli A. Comparison of the sensitivity for detecting foreign bodies among conventional plain radiography, computed tomography and ultra-sonography. Dentomaxillofac Radiol. 2010;39(2):72–78.
3. White SC, Pharoah MJ. Oral Radiology: Principles and Interpretation. 5th ed. St. Louis, MO: Mosby; 2009:207–211.
4. Razi T, Niknami M, Alavi Ghazani F. Relationship between Hounsfield unit in CT scan and gray scale in CBCT. J Dent Res Dent Clin Dent Prospects. 2014;8(2):107–110.
5. Katsumata A, Hirukawa A, Okumura S, et al. Relationship between density variability and imaging volume size in cone-beam com-puterized tomographic scanning of the maxillofacial region: An in vitro study. Oral Surg Oral Med Oral Pathol Oral Radiol Endod. 2009;107(3):420–425.
6. Lagravère MO, Carey J, Ben-Zvi M, Packota GV, Major PW. Effect of object location on the density measurement and Hounsfield conversion in a NewTom 3G cone beam computed tomography unit. Dentomaxillofac Radiol. 2008;37(6):305–308.
7. Oliveria ML, Freitas DQ, Ambrosano GM, Haiter-Neto F. Influence of exposure factors on the variability of CBCT voxel values: A phan-tom study. Dentomaxillofac Radiol. 2014;43(6):20140128.
8. Emadi N, Safi Y, Akbarzadeh Bagheban A, Asgary S. Comparison of CT-number and gray scale value of different dental materials and hard tissues in CT and CBCT. Iran Endod J. 2014;9(4):283–286. 9. Esmaeili F, Johari M, Haddadi P, Vatankhah M. Beam hardening
arti-facts: Comparison between two cone-beam computed tomogra-phy scanners. Dent Res Dent Clin Dent Prospects. 2012;6(2):2–7. 10. Chindasombatjareon J, Kakimoto N, Murakami S, Maeda Y, Furukawa S.
Quantitative analysis of metallic artifacts caused by dental metals: Comparison of cone-beam and multi-detector row CT scanners.
Oral Radiol. 2011;27:114–120.
11. Ludlow JB, Ivanovic M. Comparative dosimetry of dental CBCT devices and 64-slice CT for oral and maxillofacial radiology. Oral Surg Oral Med Oral Pathol Oral Radiol Endod. 2008;106(1):930–938. 12. Ludlow JB, Davis-Ludlow LE, Brooks SL, Howerton WB. Dosimetry
of 3 CBCT devices for oral and maxillofacial radiology: CB Mercuray, NewTom 3G and i-Cat. Dentomaxillofac Radiol.2006;35(4):219–226.
13. Schulze RK, Berndt D, d’Hoedt B. On cone-beam computed tomog-raphy artifacts induced by titanium implants. Clin Oral Implant Res. 2010;21(1):100–107.
14. Zöller JE, Neugebauer J. Cone-beam Volumetric Imaging in Den-tal, Oral and Maxillofacial Medicine: Fundamentals, Diagnostics
and Treatment Planning. London, UK: Quintessence Publishing;
2008:27–35.
15. Haristoy RA‚ Valiyaparambil JV‚ Mallya SM. Correlation of CBCT gray scale values with bone densities. Oral Surg Oral Med Oral Pathol Oral Radiol Endod. 2009;107(4):28–35.
16. Lachowski KM, Botta SB, Lascala CA, Matos AB, Sobral MA. Study of the radio-opacity of base and liner dental materials using a digital radiography system. Dentomaxillofac Radiol. 2013;42(2):20120153. 17. Devito KL, Ortega AI, Haiter Neto F. Radiopacity of calcium
hydrox-ide cement compared with human tooth structure. J Appl Oral Sci. 2004;12(4):290–293.
18. Pires de Souza FC, Pardini LC, Cruvinel DR, Hamida HM, Garcia LFR. In vitro comparison of the radiopacity of cavity lining materials with human dental structures. J Conserv Dent. 2010;13(2):65–70. 19. Imperiano MT, Jamil Khoury H, Anjos Pontual ML, Japiassú Resende
Montes MA, Fonseca Silveira MM. Comparative radiopacity of four low viscosity composites. Braz J Oral Sci. 2007;6(20):20–26. 20. Parsa A, Ibrahim N, Hassan B, Motroni A, van der Stelt P,
Wismei-jer D. Influence of cone beam CT scanning parameters on grey value measurements at an implant site. Dentomaxillofac Radiol. 2013;42(3):79884780.
21. Mah P, Reeves TE, McDavid WD. Deriving Hounsfield units using grey levels in cone beam computed tomography. Dentomaxillofac Radiol. 2010;39(6):323–335.